logo

Financial Performance of Vodafone Plc: A Ratio Analysis

This assignment requires conducting a vertical analysis and financial ratio analysis on the financial information of DT Group for the years 2013, 2014, and 2015. The analysis includes profitability ratios, liquidity ratios, solvency ratios, efficiency ratios, and investor ratios.

11 Pages2538 Words416 Views
   

Added on  2022-11-26

About This Document

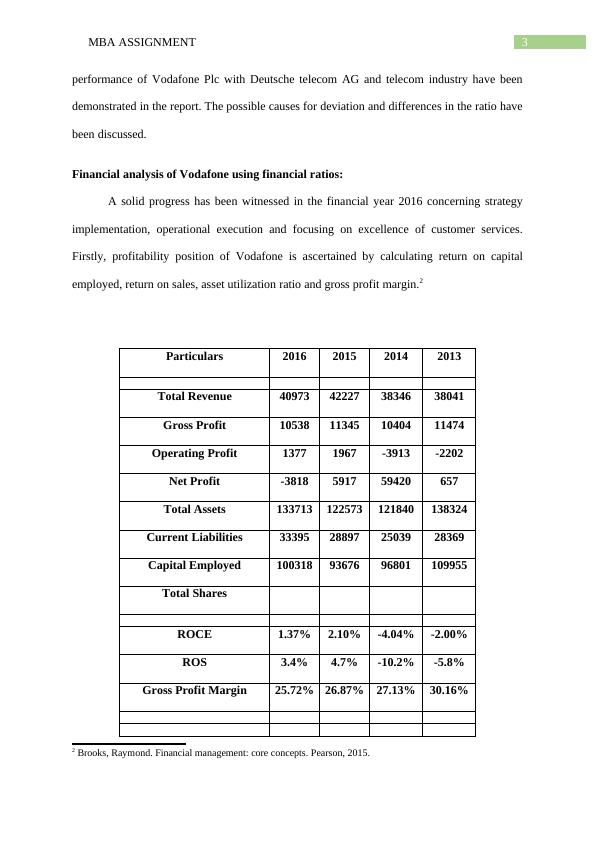
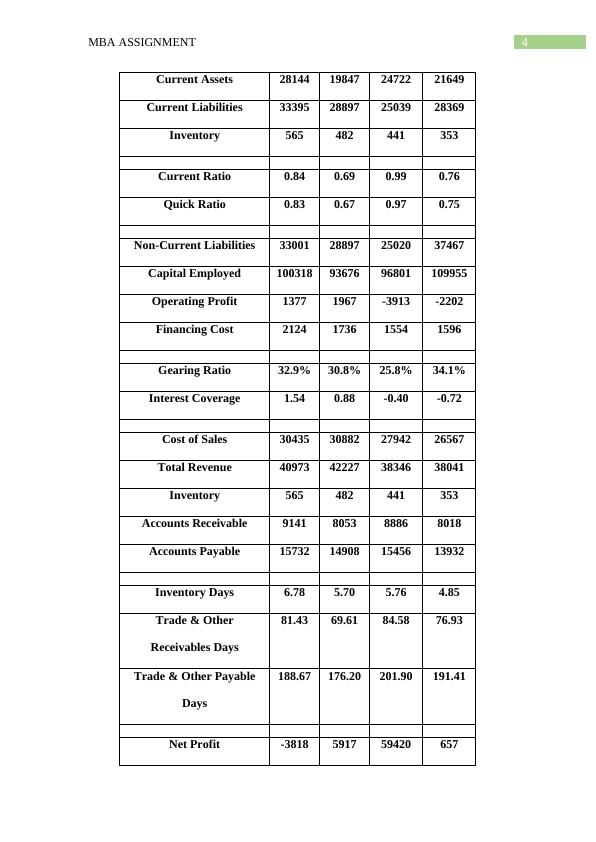
This report analyzes the financial performance of Vodafone Plc over the last three years using ratio analysis. It compares the performance of Vodafone with Deutsche Telecom AG and the telecom industry as a whole. The report discusses the profitability, liquidity, solvency, and efficiency ratios of Vodafone and provides insights into its overall financial performance.

Financial Performance of Vodafone Plc: A Ratio Analysis

This assignment requires conducting a vertical analysis and financial ratio analysis on the financial information of DT Group for the years 2013, 2014, and 2015. The analysis includes profitability ratios, liquidity ratios, solvency ratios, efficiency ratios, and investor ratios.

   Added on 2022-11-26

ShareRelated Documents
Running head: MBA ASSIGNMENT
MBA Assignment
Name of the University
Name of Student
Authors’ Note
Financial Performance of Vodafone Plc: A Ratio Analysis_1
2MBA ASSIGNMENT
Introduction:
Vodafone Plc is a British telecommunication that has it’s headquartered in London
and provides wide range of services for meeting the satisfaction of customers. Over the last
five years, Vodafone has been undergoing a substantial transformation.
Business of organization was developed that exclusively focuses on text services and
mobile and mobile voices. It offers high speed broad band services and reaches 72 million
homes in Europe market. Across the footprint of twenty six countries, a broad portfolio of
integrated fixed, market leading and mobile leading services are offered by group. Significant
investment and organic acquisition has been the factors responsible for the progress of
organization.1 There will be enhancement in the performance of organization through
customer experience excellence program that was launched last year. Regulatory
environment is aimed at Vodafone group that enables return for investment made,
maintenance of adequate level of competitions and innovation that helps in proving value for
money and customer choices. Advantage of growth opportunities are taken by the group by
providing a broad mix of communication services such as fixed broadband, mobile, internet
of things offerings, cloud and content . There are two geographic region in which the
business of group is organized that involves Africa, Europe, Asia pacific and Middle East.
Great opportunities exist for this organization resulting from increasing customer demand for
reliable, secure, high network speed data connections.
The present report discusses about the financial performance of Vodafone plc over the
period of last three years using the tool of ratio analysis. Various ratios for analyzing
financial position of group involve calculation of efficiency ratio, liquidity ratio, leverage
ratio, investor’s ratio and profitability ratio. Furthermore, comparison of financial
1 Brigham, Eugene F., and Michael C. Ehrhardt. Financial management: Theory & practice. Cengage Learning,
2013.
Financial Performance of Vodafone Plc: A Ratio Analysis_2
3MBA ASSIGNMENT
performance of Vodafone Plc with Deutsche telecom AG and telecom industry have been
demonstrated in the report. The possible causes for deviation and differences in the ratio have
been discussed.
Financial analysis of Vodafone using financial ratios:
A solid progress has been witnessed in the financial year 2016 concerning strategy
implementation, operational execution and focusing on excellence of customer services.
Firstly, profitability position of Vodafone is ascertained by calculating return on capital
employed, return on sales, asset utilization ratio and gross profit margin.2
Particulars 2016 2015 2014 2013
Total Revenue 40973 42227 38346 38041
Gross Profit 10538 11345 10404 11474
Operating Profit 1377 1967 -3913 -2202
Net Profit -3818 5917 59420 657
Total Assets 133713 122573 121840 138324
Current Liabilities 33395 28897 25039 28369
Capital Employed 100318 93676 96801 109955
Total Shares
ROCE 1.37% 2.10% -4.04% -2.00%
ROS 3.4% 4.7% -10.2% -5.8%
Gross Profit Margin 25.72% 26.87% 27.13% 30.16%
2 Brooks, Raymond. Financial management: core concepts. Pearson, 2015.
Financial Performance of Vodafone Plc: A Ratio Analysis_3
4MBA ASSIGNMENT
Current Assets 28144 19847 24722 21649
Current Liabilities 33395 28897 25039 28369
Inventory 565 482 441 353
Current Ratio 0.84 0.69 0.99 0.76
Quick Ratio 0.83 0.67 0.97 0.75
Non-Current Liabilities 33001 28897 25020 37467
Capital Employed 100318 93676 96801 109955
Operating Profit 1377 1967 -3913 -2202
Financing Cost 2124 1736 1554 1596
Gearing Ratio 32.9% 30.8% 25.8% 34.1%
Interest Coverage 1.54 0.88 -0.40 -0.72
Cost of Sales 30435 30882 27942 26567
Total Revenue 40973 42227 38346 38041
Inventory 565 482 441 353
Accounts Receivable 9141 8053 8886 8018
Accounts Payable 15732 14908 15456 13932
Inventory Days 6.78 5.70 5.76 4.85
Trade & Other
Receivables Days
81.43 69.61 84.58 76.93
Trade & Other Payable
Days
188.67 176.20 201.90 191.41
Net Profit -3818 5917 59420 657
Financial Performance of Vodafone Plc: A Ratio Analysis_4

End of preview

Want to access all the pages? Upload your documents or become a member.

Related Documents
Financial Analysis of Vodafone Group
|15
|3228
|66

Managing Financial Resources and Performance
|12
|2242
|250

Financial Statement Analysis of Vodafone Group
|14
|2946
|44

Financial Analysis of Vodafone and Comparison with Deutsche Telekom
|14
|2428
|226

MSC Accounting and Finance: Financial Analysis and Cash Budgeting
|11
|2104
|252

Managing Financial Resources and Performance
|12
|3096
|20