Microeconomic Analysis - Consumption of Coffee
VerifiedAdded on 2022/08/16
|10
|2975
|11
AI Summary
Contribute Materials
Your contribution can guide someone’s learning journey. Share your
documents today.
Running Head: MICROECONOMIC ANALYSIS
MICROECONOMIC ANALYSIS
Name of the student
Name of the University
Author’s Note
MICROECONOMIC ANALYSIS
Name of the student
Name of the University
Author’s Note
Secure Best Marks with AI Grader
Need help grading? Try our AI Grader for instant feedback on your assignments.
1
MICROECONOMIC ANALYSIS
Table of Contents
Discussion.............................................................................................................................................2
Market Overview..............................................................................................................................2
Characteristics of the coffee industry:...............................................................................................3
Porter’s five forces............................................................................................................................3
Drivers of Demand and Supply in the Coffee industry......................................................................7
References...........................................................................................................................................11
-
2
MICROECONOMIC ANALYSIS
Discussion
Market Overview
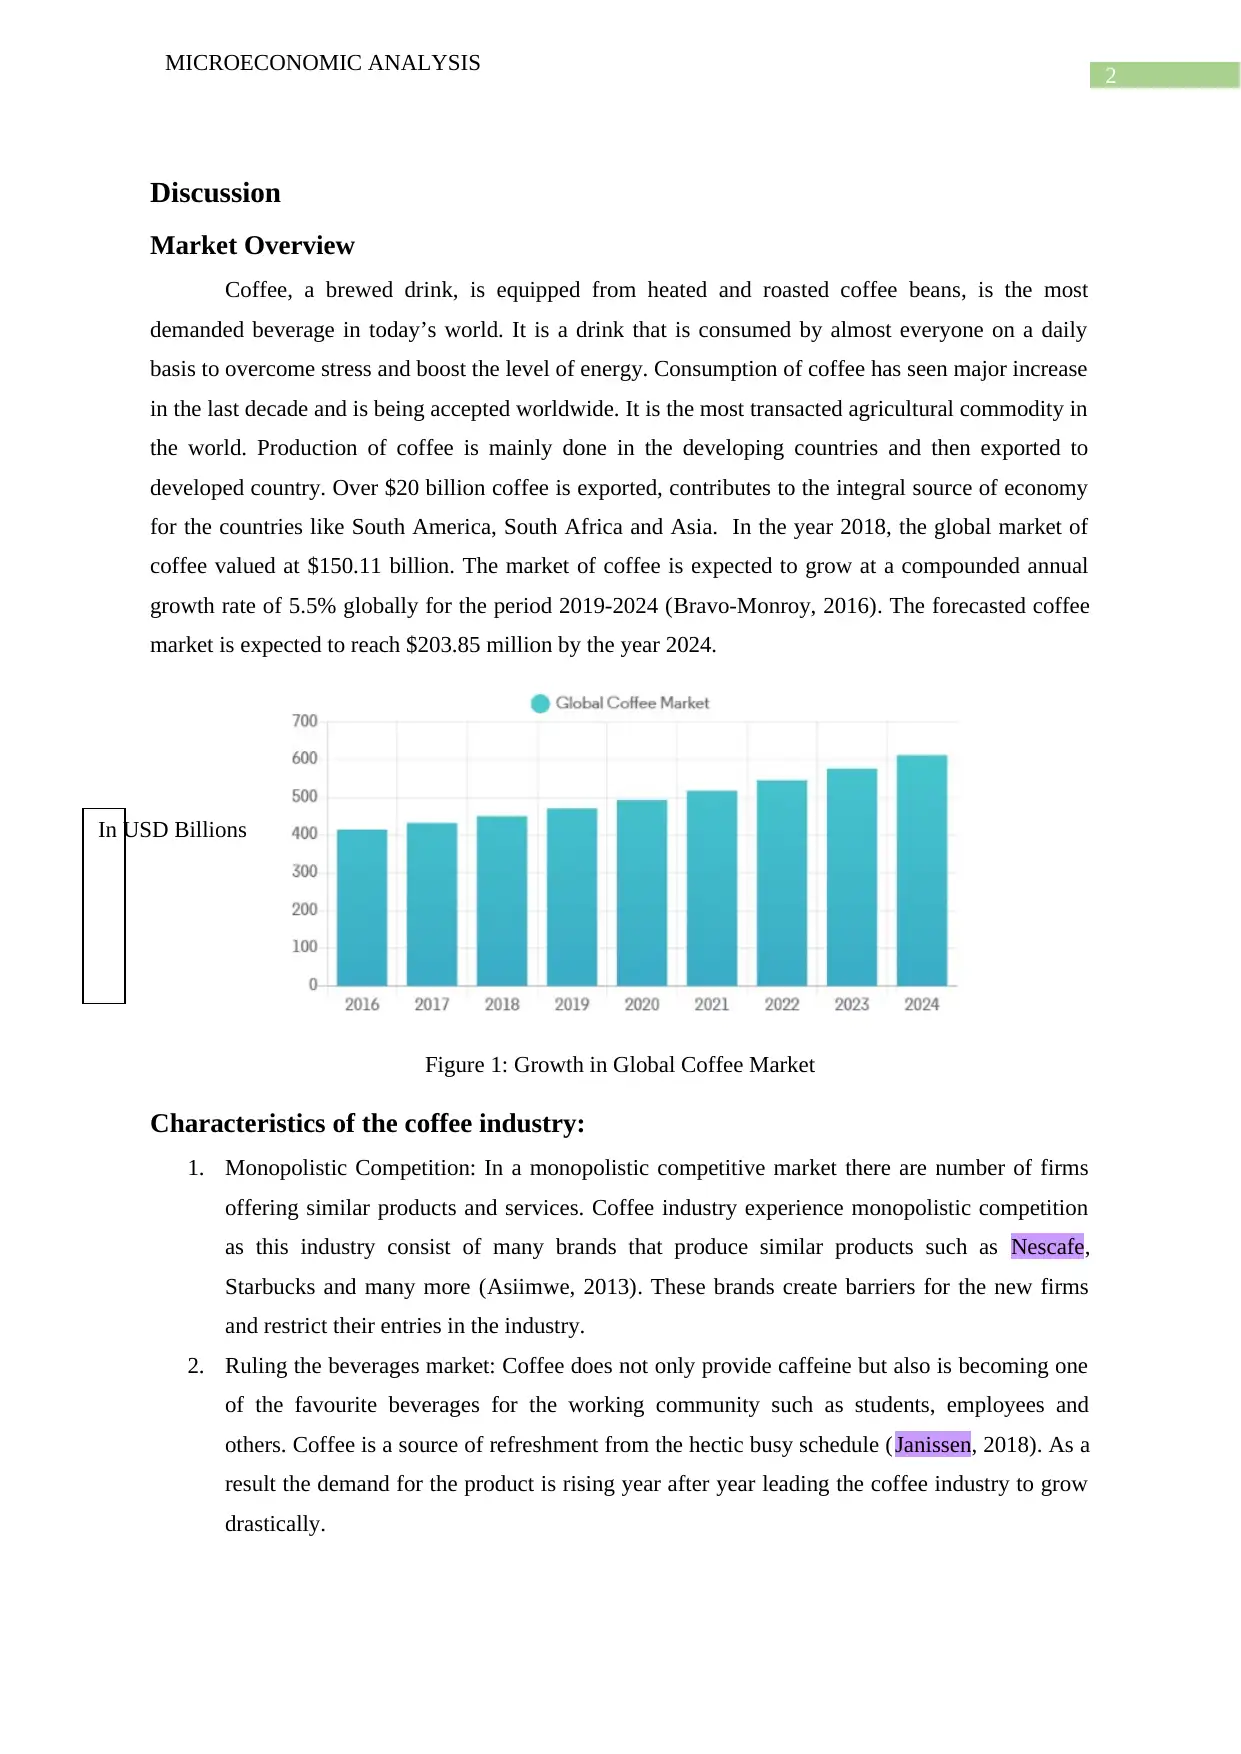
Coffee, a brewed drink, is equipped from heated and roasted coffee beans, is the most
demanded beverage in today’s world. It is a drink that is consumed by almost everyone on a daily
basis to overcome stress and boost the level of energy. Consumption of coffee has seen major increase
in the last decade and is being accepted worldwide. It is the most transacted agricultural commodity in
the world. Production of coffee is mainly done in the developing countries and then exported to
developed country. Over $20 billion coffee is exported, contributes to the integral source of economy
for the countries like South America, South Africa and Asia. In the year 2018, the global market of
coffee valued at $150.11 billion. The market of coffee is expected to grow at a compounded annual
growth rate of 5.5% globally for the period 2019-2024 (Bravo-Monroy, 2016). The forecasted coffee
market is expected to reach $203.85 million by the year 2024.
Figure 1: Growth in Global Coffee Market
Characteristics of the coffee industry:
1. Monopolistic Competition: In a monopolistic competitive market there are number of firms
offering similar products and services. Coffee industry experience monopolistic competition
as this industry consist of many brands that produce similar products such as Nescafe,
Starbucks and many more (Asiimwe, 2013). These brands create barriers for the new firms
and restrict their entries in the industry.
2. Ruling the beverages market: Coffee does not only provide caffeine but also is becoming one
of the favourite beverages for the working community such as students, employees and
others. Coffee is a source of refreshment from the hectic busy schedule (Janissen, 2018). As a
result the demand for the product is rising year after year leading the coffee industry to grow
drastically.
In USD Billions
MICROECONOMIC ANALYSIS
Discussion
Market Overview
Coffee, a brewed drink, is equipped from heated and roasted coffee beans, is the most
demanded beverage in today’s world. It is a drink that is consumed by almost everyone on a daily
basis to overcome stress and boost the level of energy. Consumption of coffee has seen major increase
in the last decade and is being accepted worldwide. It is the most transacted agricultural commodity in
the world. Production of coffee is mainly done in the developing countries and then exported to
developed country. Over $20 billion coffee is exported, contributes to the integral source of economy
for the countries like South America, South Africa and Asia. In the year 2018, the global market of
coffee valued at $150.11 billion. The market of coffee is expected to grow at a compounded annual
growth rate of 5.5% globally for the period 2019-2024 (Bravo-Monroy, 2016). The forecasted coffee
market is expected to reach $203.85 million by the year 2024.
Figure 1: Growth in Global Coffee Market
Characteristics of the coffee industry:
1. Monopolistic Competition: In a monopolistic competitive market there are number of firms
offering similar products and services. Coffee industry experience monopolistic competition
as this industry consist of many brands that produce similar products such as Nescafe,
Starbucks and many more (Asiimwe, 2013). These brands create barriers for the new firms
and restrict their entries in the industry.
2. Ruling the beverages market: Coffee does not only provide caffeine but also is becoming one
of the favourite beverages for the working community such as students, employees and
others. Coffee is a source of refreshment from the hectic busy schedule (Janissen, 2018). As a
result the demand for the product is rising year after year leading the coffee industry to grow
drastically.
In USD Billions
3
MICROECONOMIC ANALYSIS
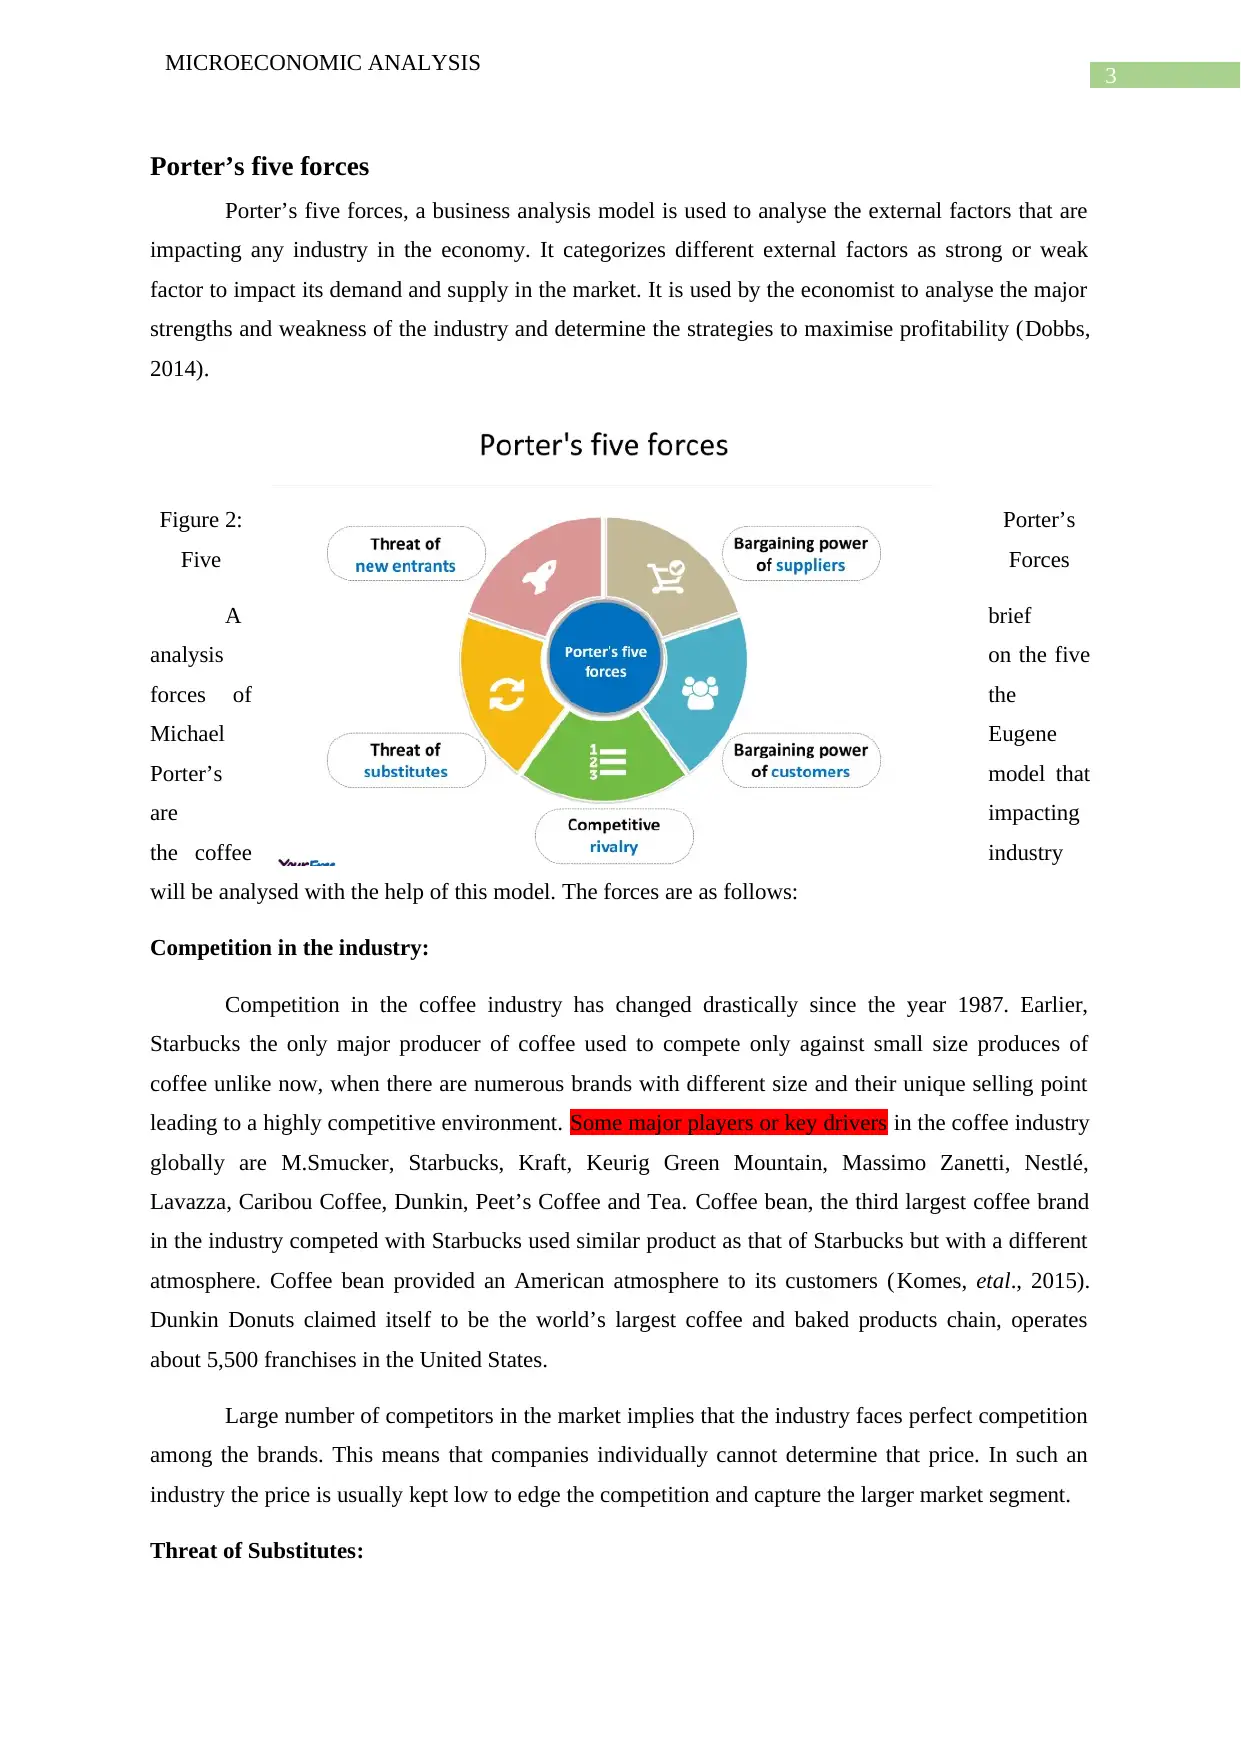
Porter’s five forces
Porter’s five forces, a business analysis model is used to analyse the external factors that are
impacting any industry in the economy. It categorizes different external factors as strong or weak
factor to impact its demand and supply in the market. It is used by the economist to analyse the major
strengths and weakness of the industry and determine the strategies to maximise profitability (Dobbs,
2014).
Figure 2: Porter’s
Five Forces
A brief
analysis on the five
forces of the
Michael Eugene
Porter’s model that
are impacting
the coffee industry
will be analysed with the help of this model. The forces are as follows:
Competition in the industry:
Competition in the coffee industry has changed drastically since the year 1987. Earlier,
Starbucks the only major producer of coffee used to compete only against small size produces of
coffee unlike now, when there are numerous brands with different size and their unique selling point
leading to a highly competitive environment. Some major players or key drivers in the coffee industry
globally are M.Smucker, Starbucks, Kraft, Keurig Green Mountain, Massimo Zanetti, Nestlé,
Lavazza, Caribou Coffee, Dunkin, Peet’s Coffee and Tea. Coffee bean, the third largest coffee brand
in the industry competed with Starbucks used similar product as that of Starbucks but with a different
atmosphere. Coffee bean provided an American atmosphere to its customers (Komes, etal., 2015).
Dunkin Donuts claimed itself to be the world’s largest coffee and baked products chain, operates
about 5,500 franchises in the United States.
Large number of competitors in the market implies that the industry faces perfect competition
among the brands. This means that companies individually cannot determine that price. In such an
industry the price is usually kept low to edge the competition and capture the larger market segment.
Threat of Substitutes:
MICROECONOMIC ANALYSIS
Porter’s five forces
Porter’s five forces, a business analysis model is used to analyse the external factors that are
impacting any industry in the economy. It categorizes different external factors as strong or weak
factor to impact its demand and supply in the market. It is used by the economist to analyse the major
strengths and weakness of the industry and determine the strategies to maximise profitability (Dobbs,
2014).
Figure 2: Porter’s
Five Forces
A brief
analysis on the five
forces of the
Michael Eugene
Porter’s model that
are impacting
the coffee industry
will be analysed with the help of this model. The forces are as follows:
Competition in the industry:
Competition in the coffee industry has changed drastically since the year 1987. Earlier,
Starbucks the only major producer of coffee used to compete only against small size produces of
coffee unlike now, when there are numerous brands with different size and their unique selling point
leading to a highly competitive environment. Some major players or key drivers in the coffee industry
globally are M.Smucker, Starbucks, Kraft, Keurig Green Mountain, Massimo Zanetti, Nestlé,
Lavazza, Caribou Coffee, Dunkin, Peet’s Coffee and Tea. Coffee bean, the third largest coffee brand
in the industry competed with Starbucks used similar product as that of Starbucks but with a different
atmosphere. Coffee bean provided an American atmosphere to its customers (Komes, etal., 2015).
Dunkin Donuts claimed itself to be the world’s largest coffee and baked products chain, operates
about 5,500 franchises in the United States.
Large number of competitors in the market implies that the industry faces perfect competition
among the brands. This means that companies individually cannot determine that price. In such an
industry the price is usually kept low to edge the competition and capture the larger market segment.
Threat of Substitutes:
Secure Best Marks with AI Grader
Need help grading? Try our AI Grader for instant feedback on your assignments.
4
MICROECONOMIC ANALYSIS
Coffee substitutes are those non-coffee products that possess same coffee like flavour. The
forces created by the substitute products of coffee has decreased in the industry over the years.
However, companies like Coca Cola and Pepsi Co have started producing their own caffeinated
products, which to some extent is a threat to the coffee market. Although people did not prefer these
product over coffee in the last decade the scenario is changing in the present era. Products like
chicory, dandelion and many more act as some healthy substitute of coffee (Komes, etal., 2015).
Polyphenols reduces inflation and toxins which are found in chicory and dandelion provides calcium
and various nutrition to the body. The new generation are becoming health conscious and demands
healthier products, this makes them shift from coffee to these healthy coffee like products.
Supplier’s bargaining power:
It refers to the number of suppliers present in the market and how the companies can reduce
its cost of input to maximise its wealth. If the number of suppliers in the market are limited, the
company does not have a wide variety of choices and supplier has the choice to decide the price. On
the other hand, if the number of suppliers are more in the market it gives the company to choose the
supplier that is providing input products at a lower price (Dobbs, 2014).
Over the years, supplier bargaining has changed with the extensive growth in the coffee
industry. In 1987, when the farmers, the main suppliers of the coffee, were unable to communicate,
coffee brands used this as an advantage and bargained in order to take a cheaper deal ( Komes, etal.,
2015). In the recent time it is impossible to bargain as the suppliers are large in number and are well
aware of the strike price. As a result to benefit from this force recent buyers of input products in the
coffee industry come into a contract with the suppliers to lock their suppliers for long term. This helps
the company when the price of input products are increased.
Threat to new entrants:
Power of the buyers is reflected by its ability to create barriers for new companies in the
industry, lesser the time taken by the new company to set up in the industry, more is the threat created
on the existing buyers. Hence, an industry should create barriers to new companies entering in the
industry (Dobbs, 2014).
In the coffee industry the barriers to entry has substantially increased as new entrants would
not get input products at a cheaper prices as those existing ones who are in contract with the farmers
attracting high discounts. As a result the treat from this force has gone down gradually. However, due
to less investment the industry has various small companies setting up (Komes, etal., 2015). These
companies are not regarded as major competitors as it serves to a small amount of the total
consumers.
Bargaining power of buyers:
5
MICROECONOMIC ANALYSIS
Last factor of the porter’s five forces is the bargaining power that the buyer in the industry
has. It refers to the ability that the customers have in order to drive lower or cheaper price for a
commodity. If a seller has large number of independent buyers, it becomes easier for them to charge
high price (Dobbs, 2014).
Coffee industry consists of buyers of two categories, first, those who are regular buyers and
purchase products in small units. These buyers do not have enough power to bargain and lower the
price. Second category buyers are those buyers who buy the product in bulk. These buyers supply to
companies like Starbucks, Nestle and others (Komes, etal., 2015). The sellers in the industry afraid to
lose these buyers as they contribute to a large amount of revenue to them. As a result these buyers has
the power to influence the price.
Market concentration and Strategic Interdependence in the industry:
Coffee industry is one of the most demanded and traded industry globally. Around 75% of the
total coffee production is exported to US in the year 2018, creating market for the job seekers. Coffee
trades in a monopoly competition, where less number of firms are engaged in aggressive competition.
To gain a competitive edge any firm in this industry needs to have their own independent strategy,
which serve differentiate products with some unique features (Dobbs, 2014). The most commonly
observed strategy in this industry is to enhance the quality of the service provided. This would help
creating a loyal customer base that will give the firm a competitive advantage. According to the
research 4 out of 5 coffee shops in US is Starbucks, this is because of the quality of the product and
services offered by the company (Komes, etal., 2015).
Drivers of Demand and Supply in the Coffee industry
Demand and supply of the coffee is determined by various number of factors. These can be
climatic condition, number of nations producing coffee and many more. To predict or forecast the
analysis of the coffee industry, analysing these demand and supply factors and its affects play an
important role.
Demand
Demand can be explained as the amount of goods or services that a consumers is willing and
able to buy at a particular price. According to the law of demand, if the price of a commodity
decreases its demand increases and vice versa keeping other factors constant ( Aneiros, etal., 2016).
This implies that the demand and price of a product shares an inverse relationship.
6
MICROECONOMIC ANALYSIS
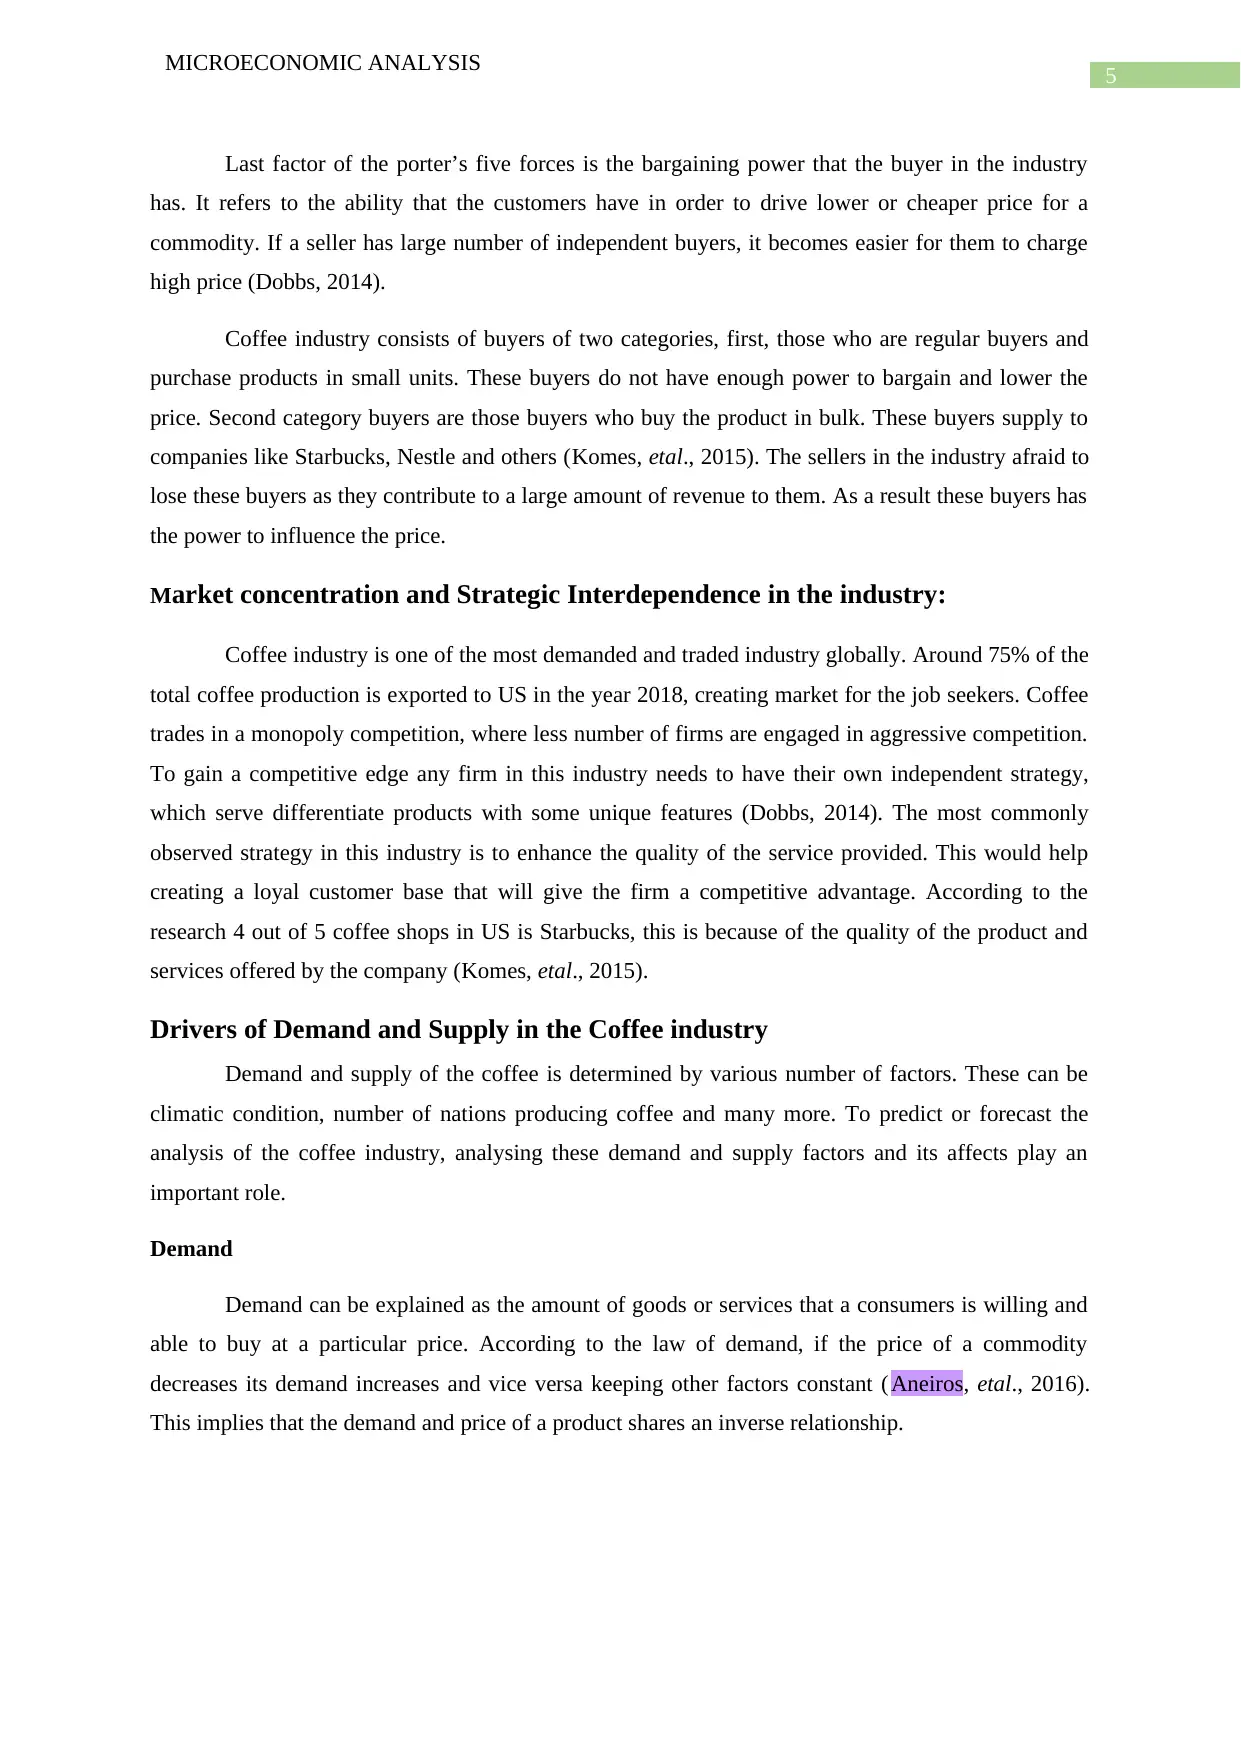
Figure 3: Graph showing Demand curve
The above figure explains that if the price of the commodity increases from P to P” its
demand decreases from M to N and when the price decreases from P to P’, demand increases from M
to N. However, there are other factors that affect the demand of a product such as consumer
preference, quality and many more.
Drivers of demand of coffee
One of the major use of coffee is that it is consumed as a daily beverage by almost all
generation as a stress buster and for refreshment. Beside that coffee is used in producing coffee
flavoured products such as chocolates, sweets and many more. Hence, demand of coffee can be
affected if demand of these products are increased or decreased.
In the recent times the demand of coffee has seen a hike irrespective of the increase in price
of the product. Reason why coffee is experiencing high demand is that work load on people is
increasing resulting in increase in requirement of coffee on a daily basis.
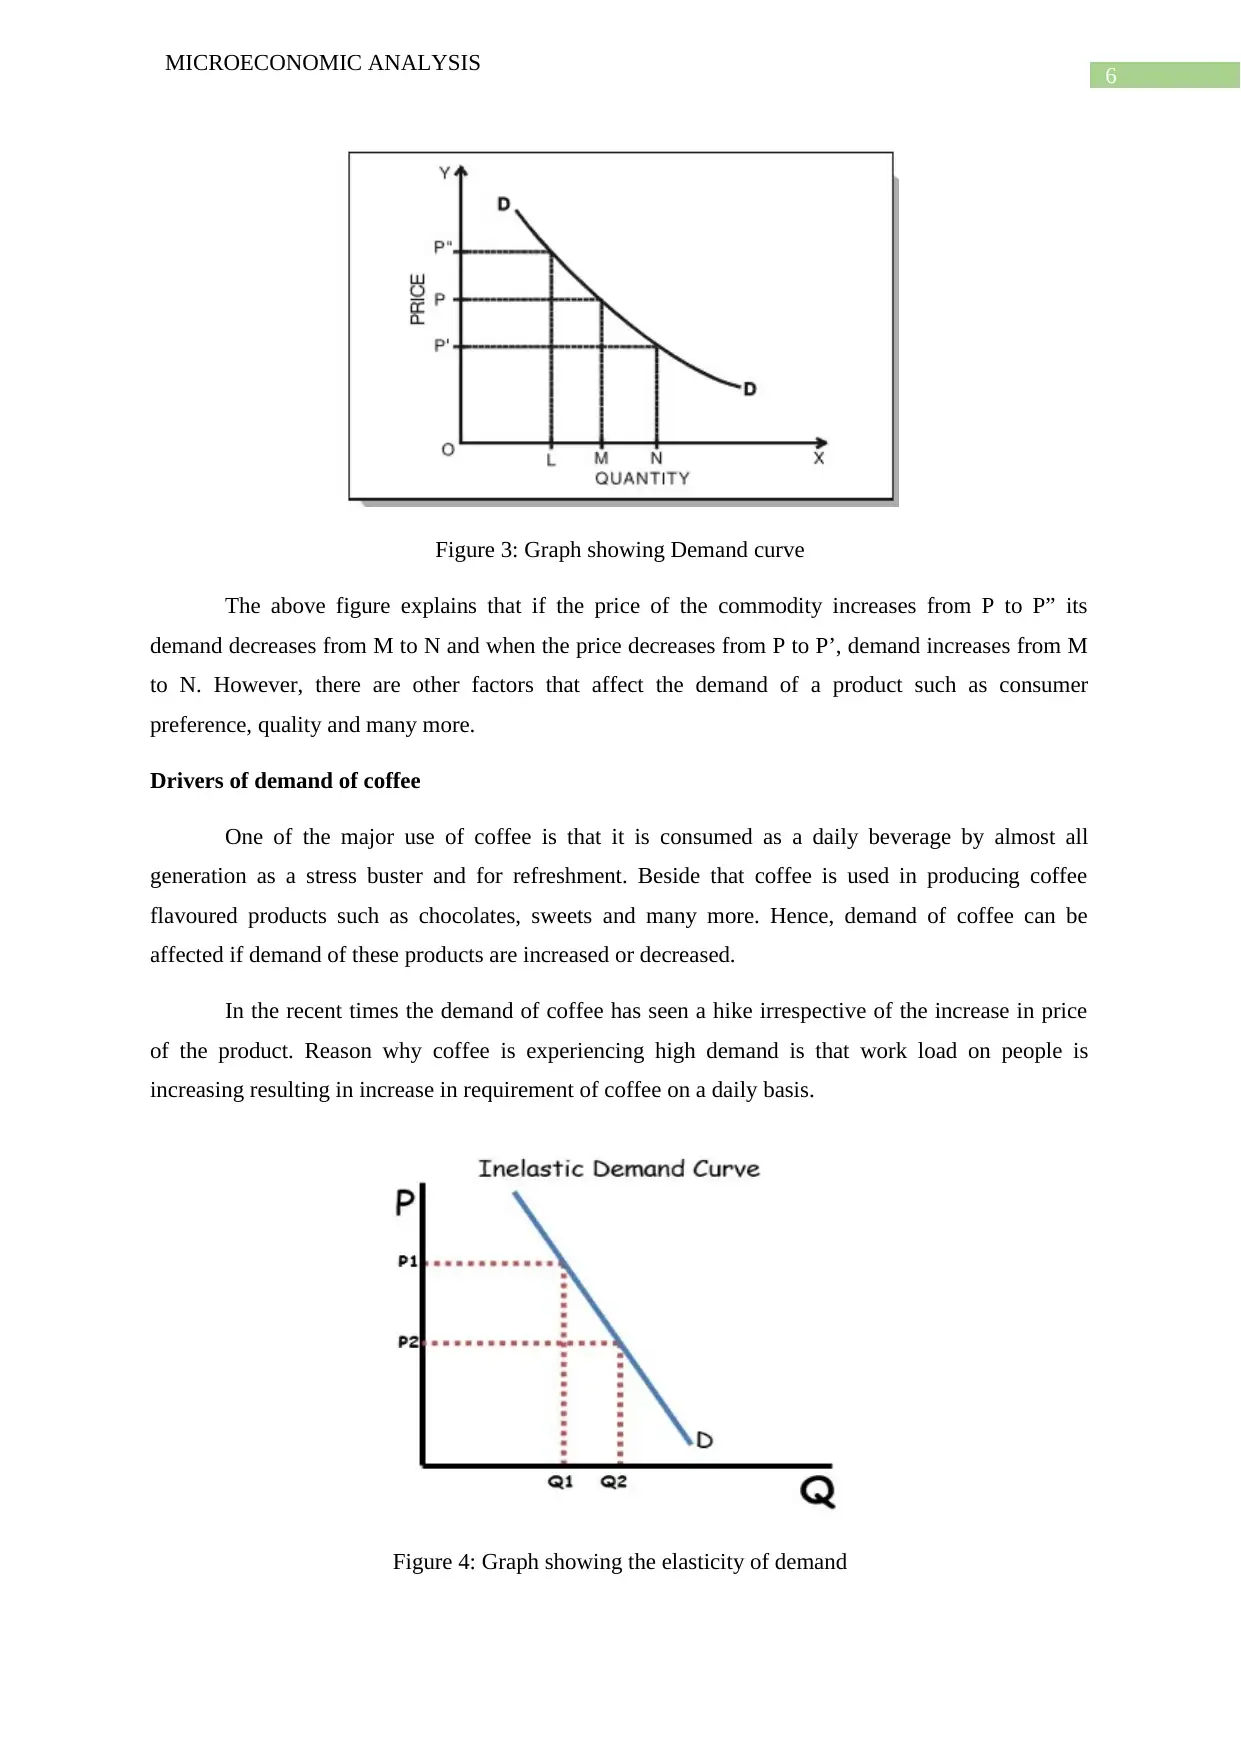
Figure 4: Graph showing the elasticity of demand
MICROECONOMIC ANALYSIS
Figure 3: Graph showing Demand curve
The above figure explains that if the price of the commodity increases from P to P” its
demand decreases from M to N and when the price decreases from P to P’, demand increases from M
to N. However, there are other factors that affect the demand of a product such as consumer
preference, quality and many more.
Drivers of demand of coffee
One of the major use of coffee is that it is consumed as a daily beverage by almost all
generation as a stress buster and for refreshment. Beside that coffee is used in producing coffee
flavoured products such as chocolates, sweets and many more. Hence, demand of coffee can be
affected if demand of these products are increased or decreased.
In the recent times the demand of coffee has seen a hike irrespective of the increase in price
of the product. Reason why coffee is experiencing high demand is that work load on people is
increasing resulting in increase in requirement of coffee on a daily basis.
Figure 4: Graph showing the elasticity of demand
Paraphrase This Document
Need a fresh take? Get an instant paraphrase of this document with our AI Paraphraser
7
MICROECONOMIC ANALYSIS
Elasticity of demand can be defined as “the responsiveness of quantity demanded to a change
in price”. In the above figure it can be seen that change in price is more than change in quantity
demanded. This means that demand of the commodity is not affected if the price increases or
decreases. The demand of coffee is inelastic in nature (Esteves, 2014). Even if the price decreases it
would not affect the demand much as people would not consume thirty cups of coffee a day if it is
cheaper. It is a necessary good and hence, price is not a factor that is considered by the people.
Demand of coffee in South Africa has seen an increase from 29,760 tonnes in 2013 to 35,400
tonnes in the year 2017. The expected compounded annual growth of coffee is 4.4%, this is because
demand of coffee has increased with younger generation demanding more of coffee as their beverage
choices (Pacula, 2013).
Supply
Market supply is explained as the amount of good and services that the seller is willing and
able to produce or sell at a particular price. As per the law of supply, supply of commodity increases
of the price increases and decreases if the price decreases keeping other factors constant. Hence,
unlike demand, supply of a product has a positive relationship with its price.
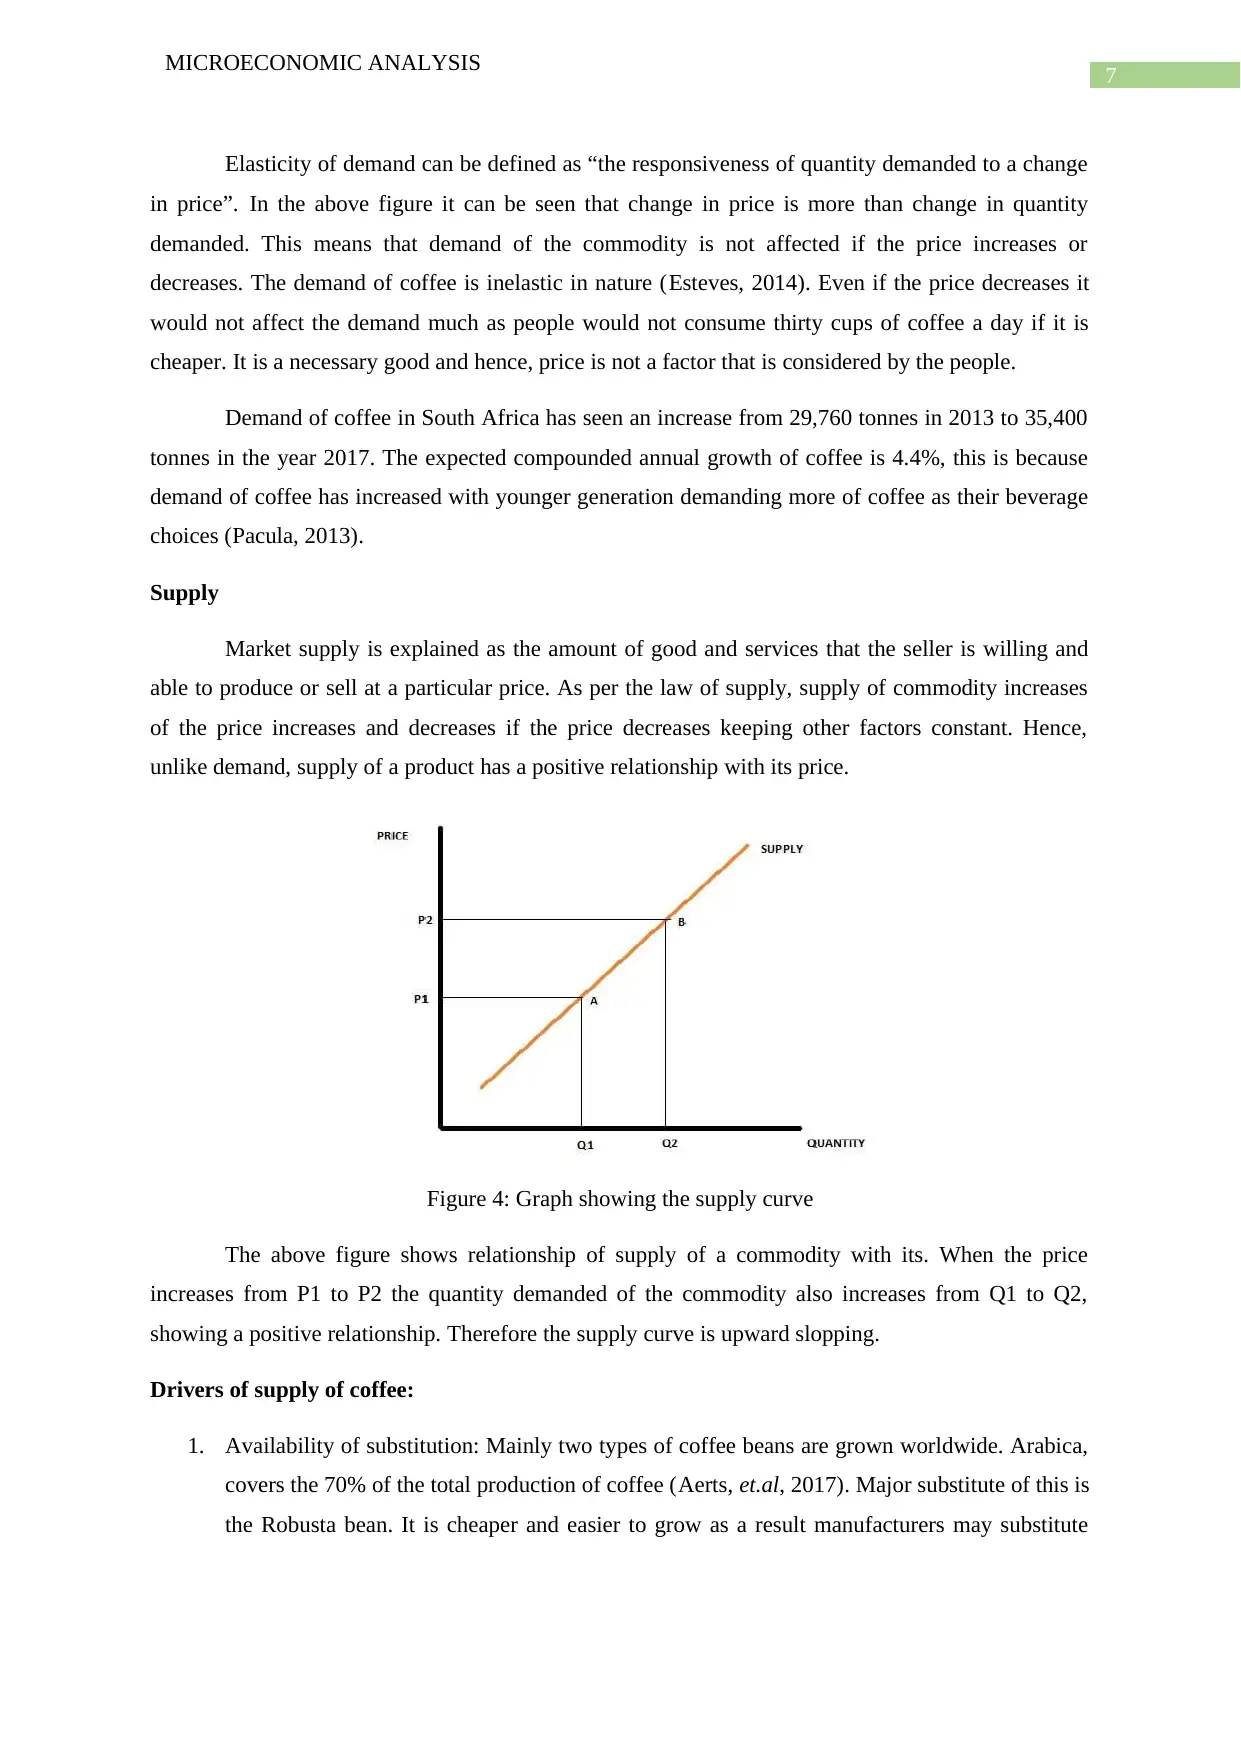
Figure 4: Graph showing the supply curve
The above figure shows relationship of supply of a commodity with its. When the price
increases from P1 to P2 the quantity demanded of the commodity also increases from Q1 to Q2,
showing a positive relationship. Therefore the supply curve is upward slopping.
Drivers of supply of coffee:
1. Availability of substitution: Mainly two types of coffee beans are grown worldwide. Arabica,
covers the 70% of the total production of coffee (Aerts, et.al, 2017). Major substitute of this is
the Robusta bean. It is cheaper and easier to grow as a result manufacturers may substitute
MICROECONOMIC ANALYSIS
Elasticity of demand can be defined as “the responsiveness of quantity demanded to a change
in price”. In the above figure it can be seen that change in price is more than change in quantity
demanded. This means that demand of the commodity is not affected if the price increases or
decreases. The demand of coffee is inelastic in nature (Esteves, 2014). Even if the price decreases it
would not affect the demand much as people would not consume thirty cups of coffee a day if it is
cheaper. It is a necessary good and hence, price is not a factor that is considered by the people.
Demand of coffee in South Africa has seen an increase from 29,760 tonnes in 2013 to 35,400
tonnes in the year 2017. The expected compounded annual growth of coffee is 4.4%, this is because
demand of coffee has increased with younger generation demanding more of coffee as their beverage
choices (Pacula, 2013).
Supply
Market supply is explained as the amount of good and services that the seller is willing and
able to produce or sell at a particular price. As per the law of supply, supply of commodity increases
of the price increases and decreases if the price decreases keeping other factors constant. Hence,
unlike demand, supply of a product has a positive relationship with its price.
Figure 4: Graph showing the supply curve
The above figure shows relationship of supply of a commodity with its. When the price
increases from P1 to P2 the quantity demanded of the commodity also increases from Q1 to Q2,
showing a positive relationship. Therefore the supply curve is upward slopping.
Drivers of supply of coffee:
1. Availability of substitution: Mainly two types of coffee beans are grown worldwide. Arabica,
covers the 70% of the total production of coffee (Aerts, et.al, 2017). Major substitute of this is
the Robusta bean. It is cheaper and easier to grow as a result manufacturers may substitute
8
MICROECONOMIC ANALYSIS
Arabica beans with the Robusta beans to reduce the cost of manufacturing and to increase the
demand of the product in the market.
2. Climatic conditions: Climate is the main driver when it comes to cultivation of coffee beans.
Arabica coffee is the either cultivated at high altitudes of 16-24 degrees or at lower altitudes
in the equatorial regions lower that 10 degrees (Samper, 2017). Rainfall in these regions
causes continuous flowering which results in increase in coffee production. Climate plays a
major role in determining the price of the coffee which in result affects the supply of the
product.
3. Currency movement: major producer of coffee is Brazil and any movement in the Brazilian
currency and market influence the price of coffee and affect the supply of the same. Similarly,
any movement in the currency of other major exporters of coffee such as Vietnam, Columbia
and others influence the price of the product resulting in influencing the supply.
9
MICROECONOMIC ANALYSIS
References
Aerts, R., Geeraert, L., Berecha, G., Hundera, K., Muys, B., De Kort, H., & Honnay, O. (2017).
Conserving wild Arabica coffee: Emerging threats and opportunities. Agriculture, Ecosystems
& Environment, 237, 75-79.
Aneiros, G., Vilar, J., & Raña, P. (2016). Short-term forecast of daily curves of electricity demand and
price. International Journal of Electrical Power & Energy Systems, 80, 96-108.
Asiimwe, G. B. (2013). From monopoly marketing to coffee magendo: Responses to policy
recklessness and extraction in Uganda, 1971–79. Journal of eastern African studies, 7(1),
104-124.
Bravo-Monroy, L., Potts, S. G., & Tzanopoulos, J. (2016). Drivers influencing farmer decisions for
adopting organic or conventional coffee management practices. Food policy, 58, 49-61.
Bunn, C., Läderach, P., Rivera, O. O., & Kirschke, D. (2015). A bitter cup: climate change profile of
global production of Arabica and Robusta coffee. Climatic Change, 129(1-2), 89-101.
Dobbs, M. E. (2014). Guidelines for applying Porter's five forces framework: a set of industry
analysis templates. Competitiveness Review.
Esteves, R. B., & Reggiani, C. (2014). Elasticity of demand and behaviour-based price
discrimination. International Journal of Industrial Organization, 32, 46-56.
Jaffee, D. (2014). Brewing justice: Fair trade coffee, sustainability, and survival. Univ of California
Press.
Janissen, B., & Huynh, T. (2018). Chemical composition and value-adding applications of coffee
industry by-products: A review. Resources, Conservation and Recycling, 128, 110-117.
Komes, D., Bušić, A., Vojvodić, A., Belščak-Cvitanović, A., & Hruškar, M. (2015). Antioxidative
potential of different coffee substitute brews affected by milk addition. European food
research and technology, 241(1), 115-125.
Pacula, R. L., & Lundberg, R. (2013). Why changes in price matter when thinking about marijuana
policy: A review of the literature on the elasticity of demand. Public Health Reviews, 35(2), 2.
Samper, L. F., & Quiñones-Ruiz, X. F. (2017). Towards a balanced sustainability vision for the coffee
industry. Resources, 6(2), 17.
1 out of 10
Related Documents


Your All-in-One AI-Powered Toolkit for Academic Success.
+13062052269
info@desklib.com
Available 24*7 on WhatsApp / Email
![[object Object]](/_next/static/media/star-bottom.7253800d.svg)
Unlock your academic potential
© 2024 | Zucol Services PVT LTD | All rights reserved.