MIS784 Conjoint Analysis of the Market
VerifiedAdded on 2022/08/22
|15
|2801
|21
AI Summary
Contribute Materials
Your contribution can guide someone’s learning journey. Share your
documents today.

MIS784 Marketing Analytics (Assignment Two)
By(name)
Institutional Affiliation.
By(name)
Institutional Affiliation.
Secure Best Marks with AI Grader
Need help grading? Try our AI Grader for instant feedback on your assignments.
Contents
Introduction....................................................................................................................................2
Methodology...................................................................................................................................3
Interpretation.................................................................................................................................5
Recommendation...........................................................................................................................8
Appendix.........................................................................................................................................9
Dummy Variable Generation....................................................................................................9
Parts-Worth Analysis Respondent.........................................................................................11
Source code for the Python Script..........................................................................................12
Table of Figures
Table 1 Dummy Variable Generation..............................................................................................9
Table 2 Regression Analysis...........................................................................................................9
Table 3 Parts-Worth Analysis........................................................................................................11
Introduction
Most of the big name watch making companies are usually traded as publicly as well as
operated like finance companies. According to Terasaki & Nagasawa (2014), growth of a
company in the luxury watch industry can be contradictory. A watch brand could easily destroy
itself if it is expected to grow in today’s saturated market. Growth means establishing more
stores, retailers and inventory.growth in this context is the opposite of exclusivity which is a
necessary factor for any luxury brand to survive and be competitive. Luxury that is not coupled
with exclusivity in the watch industry is not to be perceived as meaningful at all. Luxury watch
companies such as Rolex put a lot of emphasis on the quality of the final product as well as its
components. These brands often omit unusual or unnecessary complications such as perpetual
calendars present in many other less competitive brands such as Oris. Consequently, any brand
that seeks to raise its status focus on the design of their products with emphasis on offering
exclusive features in their watches. The luxury watch market is a very competitive niche market.
The market leading brands of Rolex and Patek-Philippe command a very high level of price in
this market which Oris has not been able to achieve. As a direct competition to two recently
released limited edition watches by Rolex and Patek-Phillipe, Oris planned to launch a new style
of watch to change its narrative in this market. As an initial step towards this course, Oris did a
conjoint study to analyze the market and to identify the gold watch profile which is most likely
to make them succeed in this competitive market. The targeted group in the study were wealthy
people with minimum net worth of $5 million. The study was based on the different watch
attributes to determine the consumer preferences. The purpose of this report, therefore, is to
present a conjoint analysis of the market based on the conjoint study that was conducted.
Methodology
An optimal market research approach was used to determine the value that consumers of
limited edition watches place on the watch attributes. Using a fractional factorial design, the
purchase intentions of the consumers for the different watch profiles were collected. A conjoint
analysis on a segment of the population (20 respondents) was done to determine the likelihood
that Oris watches will get a breakthrough in the next season.
In the conjoint analysis, a model is built where the following are the inputs: Attributes, Levels,
Respondents, Prior Knowledge, Experimental Design and Conjoint Method.
i. Attributes: There are five watch attributes considered namely brand name, price, size of
watch case, type of gold and number of complications.
Importance of the watch attributes in determining consumer preferences
The most important topic in this competitive market is customer’s decision making. Product
valuation depends on its attributes. The conjoint analysis of the different watch attributes is thus
crucial.
The brand name is a significant indicator of the quality of the watch. It is believed that a
renowned company produces more quality products than small companies. In this case, the
Rolex and the Patek-Philippe brands are more trusted by the consumers.
People can be willing to pay more for better product quality. The price of the watch may be used
by a consumer to pre-judge on its quality.
The size of the watch case determines its packaging size. The consumers may link packaging
size to watch prices and a smaller size could change the price perception of the customers. The
size also gives an idea about the weight of the watch and big sizes could be a turn-off for some
customers.
The type of gold used on the watch may give the customers a perception on the price and quality
of the product. Moreover, color is important for aesthetics purposes as some costumers would
prefer one color to another.
The number of complications on the watch could be additional features of the watch. These are
welcomed by some customers while others will just prefer a simple design with zero
complications.
ii. Levels: The levels/variables of the different attributes are as shown in the table below
Table 1: Conjoint Study Design
Attribute Level 1 Level 2 Level 3
Brand Rolex Patek-Philippe Oris
Size of watch case 39mm 42mm 45mm
Number of complications 0 3 5
Secure Best Marks with AI Grader
Need help grading? Try our AI Grader for instant feedback on your assignments.

Type of gold White Yellow Rose
Price $40,000 $50,000 $60,000
18 possible combinations (watch profiles) were obtained from the attributes and the levels and
used in this analysis.
iii. Respondents: There were 20 wealthy participants who represented the target population.
iv. Prior knowledge
It is known that Rolex and Patek-Phillipe watches come with the following profiles:
a) A Yellow, 39 mm Rolex watch with 3 complications costing $60,000.
b) A White 39mm Patek-Philippe watch with 5 complications costing $50,000.
v. Experimental Design
In this stage, dummy variables for the known attributes were used to build a dataset that was
useful for the conjoint analysis method. The first procedure involved transforming all the
categorical data for the 18 watch samples into a set of dummy variables. A set of dummy
variables are shown in the appendices section. The variable transformation was conducted using
a golden rule that if there are n variations in categorical variables, then the number of dummy
variables can only be n-1. Using Data Analysis Tool Pack in Microsoft Excel, a regression
analysis was done for all the 20 participants with the preference as the independent variable.
Once the market share was obtained from conjoint analysis, a python code was written to
evaluate the profit profiles for Oris.
vi. Conjoint Method
Regression analysis was applied to the dataset to determine the utility scores and importance
score of the attributes. Purchase probability of each Oris watch profile was calculated to
determine the product profile that is likely to get the highest market share and what portion of the
market it can get.
The part worth or the utility scores of the different attributes were calculated using regression
analysis in MS-Excel for all the 20 respondents and for each level. The analysis also produced all
the viable product profiles that Oris can offer with a fixed size of 45mm.
The purchase probability of each Oris watch profile was calculated with reference to the Rolex
and Patek-Phillipe limited edition watches. The market share was also calculated for each
profile.
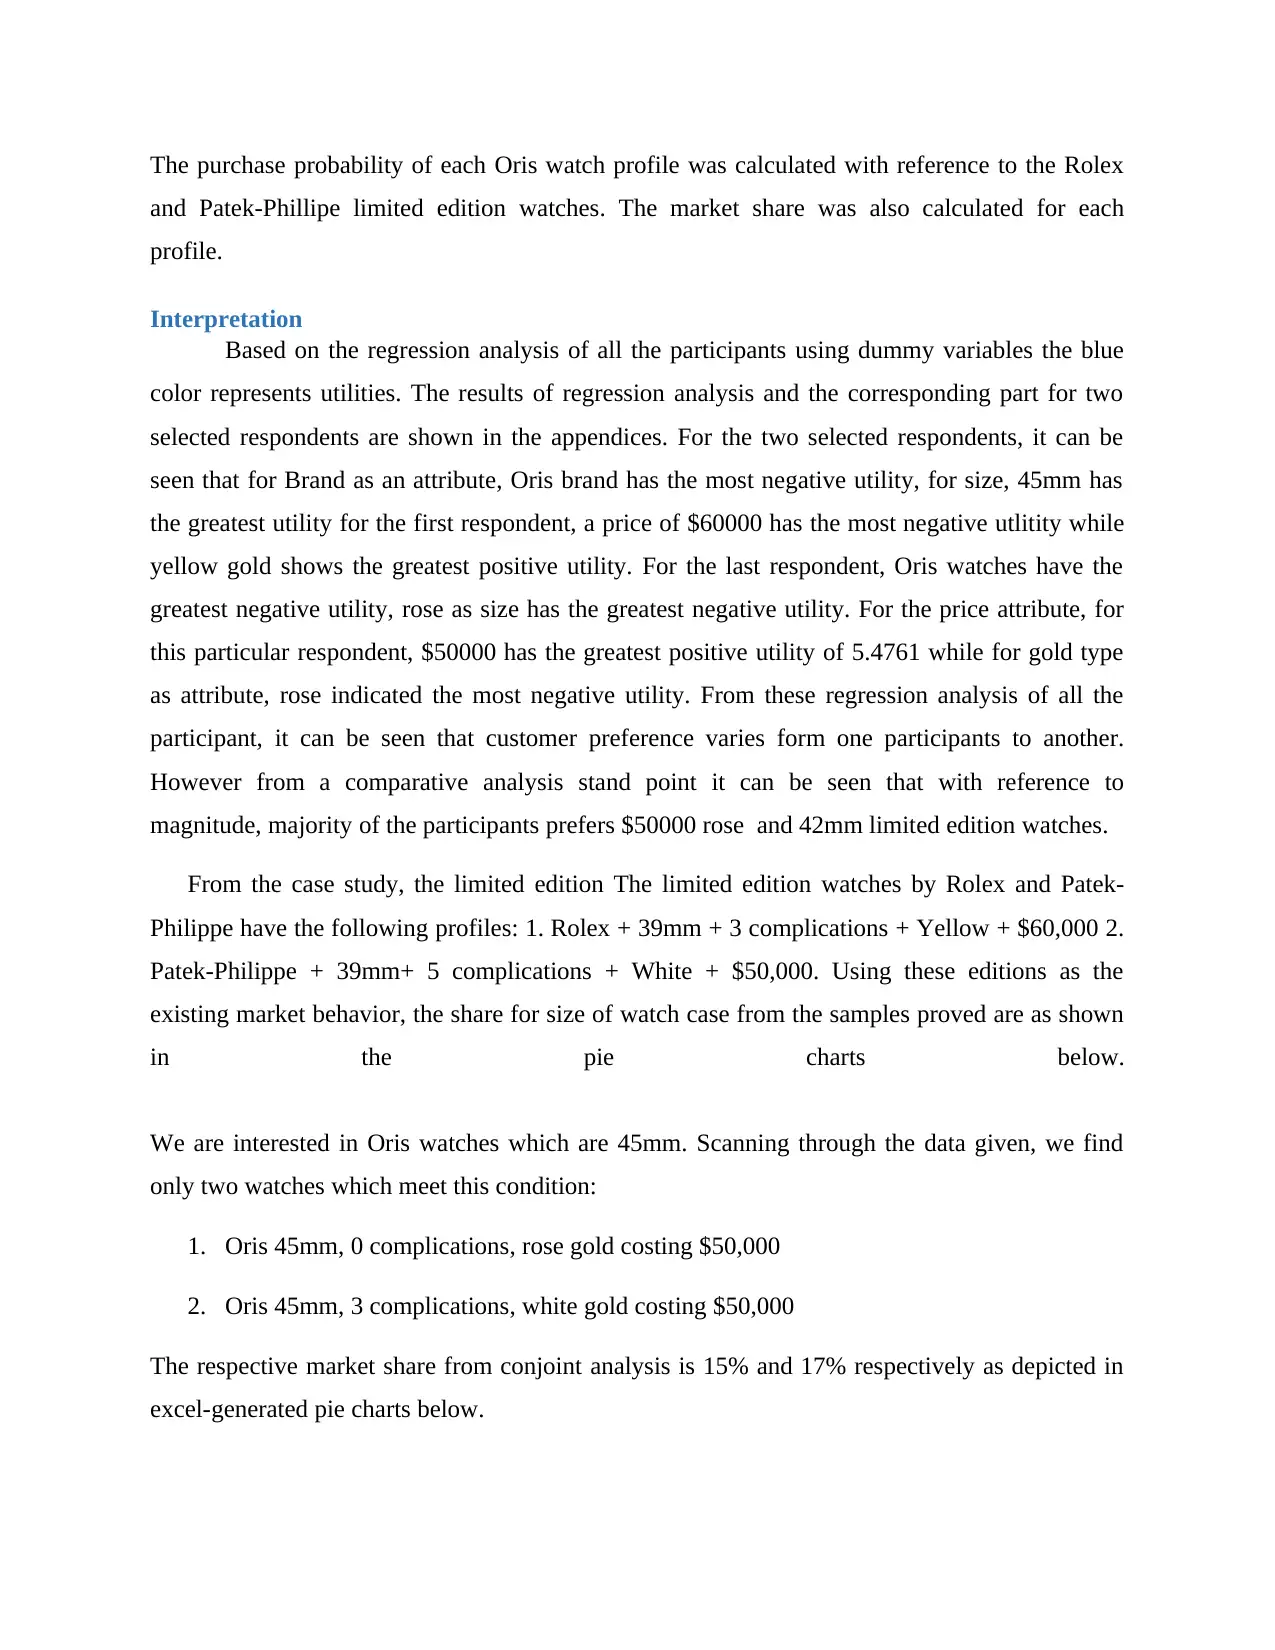
Interpretation
Based on the regression analysis of all the participants using dummy variables the blue
color represents utilities. The results of regression analysis and the corresponding part for two
selected respondents are shown in the appendices. For the two selected respondents, it can be
seen that for Brand as an attribute, Oris brand has the most negative utility, for size, 45mm has
the greatest utility for the first respondent, a price of $60000 has the most negative utlitity while
yellow gold shows the greatest positive utility. For the last respondent, Oris watches have the
greatest negative utility, rose as size has the greatest negative utility. For the price attribute, for
this particular respondent, $50000 has the greatest positive utility of 5.4761 while for gold type
as attribute, rose indicated the most negative utility. From these regression analysis of all the
participant, it can be seen that customer preference varies form one participants to another.
However from a comparative analysis stand point it can be seen that with reference to
magnitude, majority of the participants prefers $50000 rose and 42mm limited edition watches.
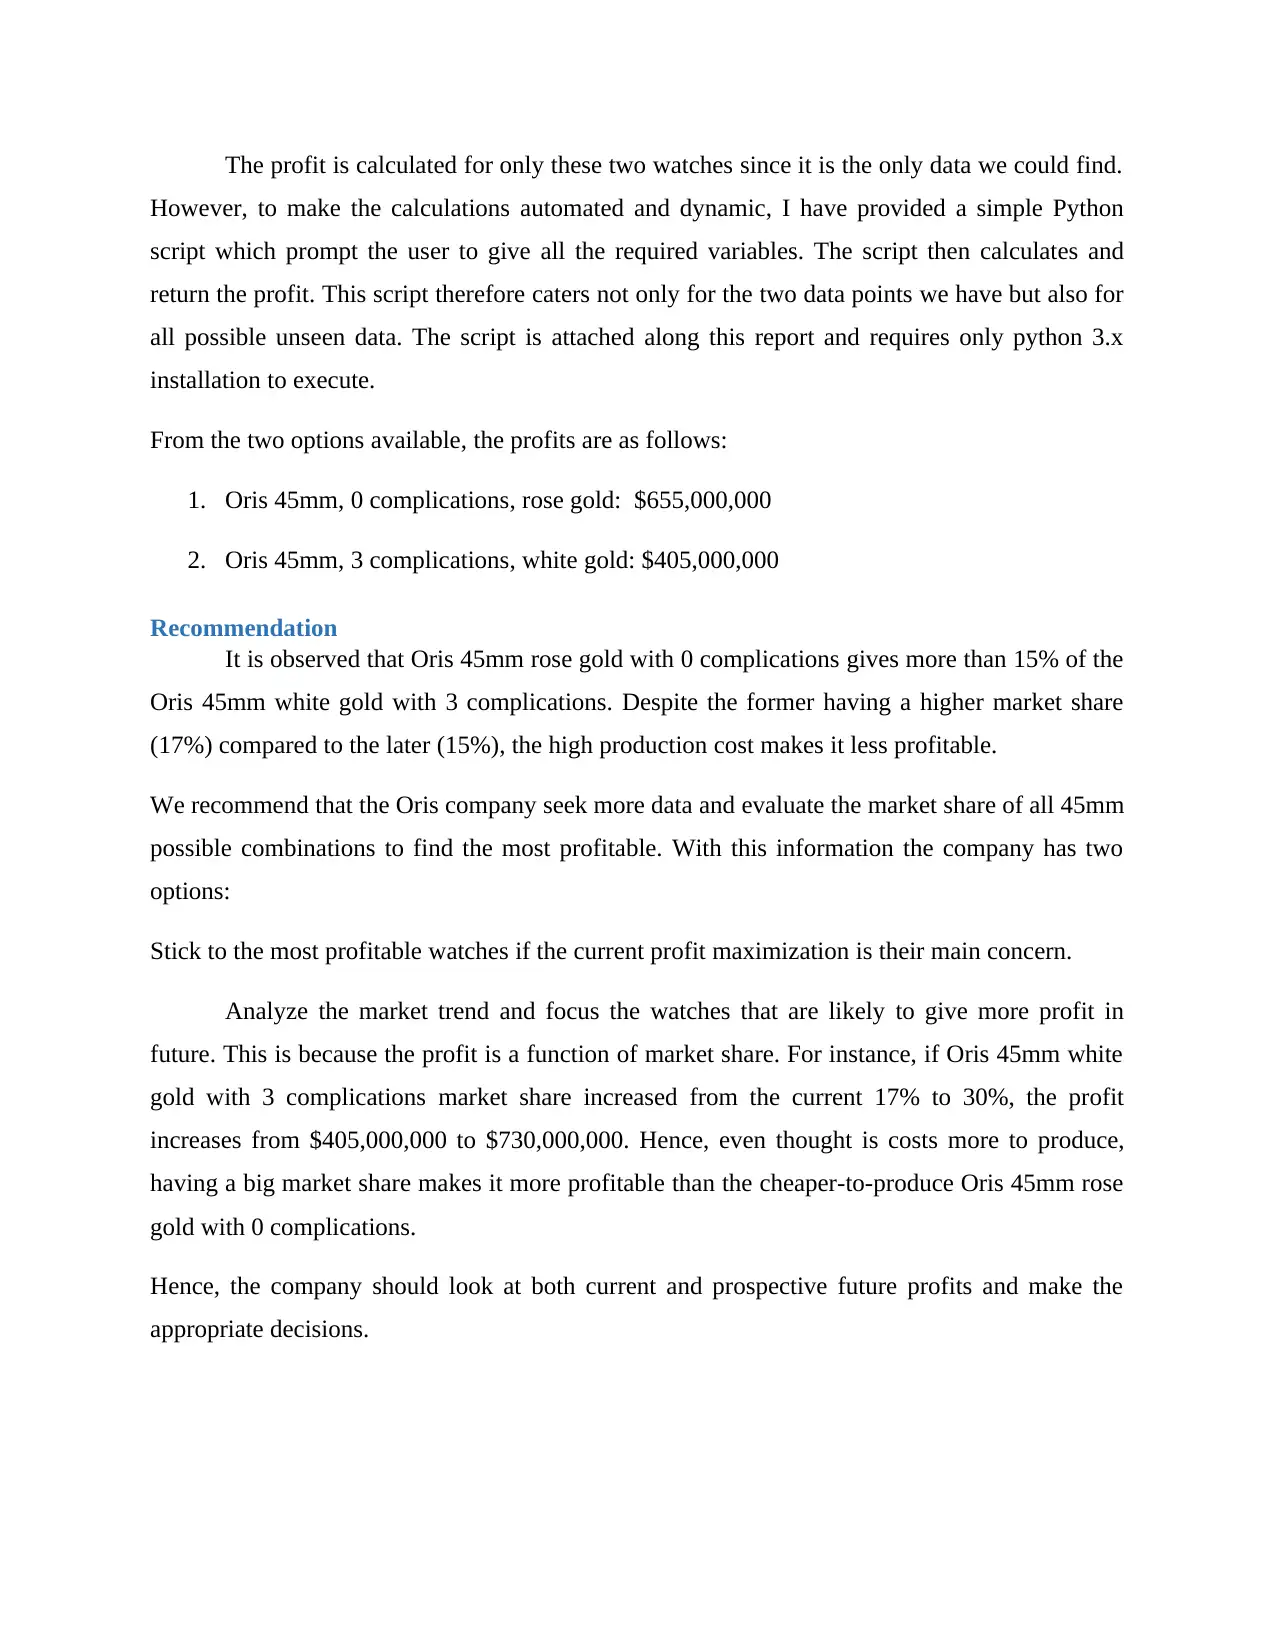
From the case study, the limited edition The limited edition watches by Rolex and Patek-
Philippe have the following profiles: 1. Rolex + 39mm + 3 complications + Yellow + $60,000 2.
Patek-Philippe + 39mm+ 5 complications + White + $50,000. Using these editions as the
existing market behavior, the share for size of watch case from the samples proved are as shown
in the pie charts below.
We are interested in Oris watches which are 45mm. Scanning through the data given, we find
only two watches which meet this condition:
1. Oris 45mm, 0 complications, rose gold costing $50,000
2. Oris 45mm, 3 complications, white gold costing $50,000
The respective market share from conjoint analysis is 15% and 17% respectively as depicted in
excel-generated pie charts below.
and Patek-Phillipe limited edition watches. The market share was also calculated for each
profile.
Interpretation
Based on the regression analysis of all the participants using dummy variables the blue
color represents utilities. The results of regression analysis and the corresponding part for two
selected respondents are shown in the appendices. For the two selected respondents, it can be
seen that for Brand as an attribute, Oris brand has the most negative utility, for size, 45mm has
the greatest utility for the first respondent, a price of $60000 has the most negative utlitity while
yellow gold shows the greatest positive utility. For the last respondent, Oris watches have the
greatest negative utility, rose as size has the greatest negative utility. For the price attribute, for
this particular respondent, $50000 has the greatest positive utility of 5.4761 while for gold type
as attribute, rose indicated the most negative utility. From these regression analysis of all the
participant, it can be seen that customer preference varies form one participants to another.
However from a comparative analysis stand point it can be seen that with reference to
magnitude, majority of the participants prefers $50000 rose and 42mm limited edition watches.
From the case study, the limited edition The limited edition watches by Rolex and Patek-
Philippe have the following profiles: 1. Rolex + 39mm + 3 complications + Yellow + $60,000 2.
Patek-Philippe + 39mm+ 5 complications + White + $50,000. Using these editions as the
existing market behavior, the share for size of watch case from the samples proved are as shown
in the pie charts below.
We are interested in Oris watches which are 45mm. Scanning through the data given, we find
only two watches which meet this condition:
1. Oris 45mm, 0 complications, rose gold costing $50,000
2. Oris 45mm, 3 complications, white gold costing $50,000
The respective market share from conjoint analysis is 15% and 17% respectively as depicted in
excel-generated pie charts below.
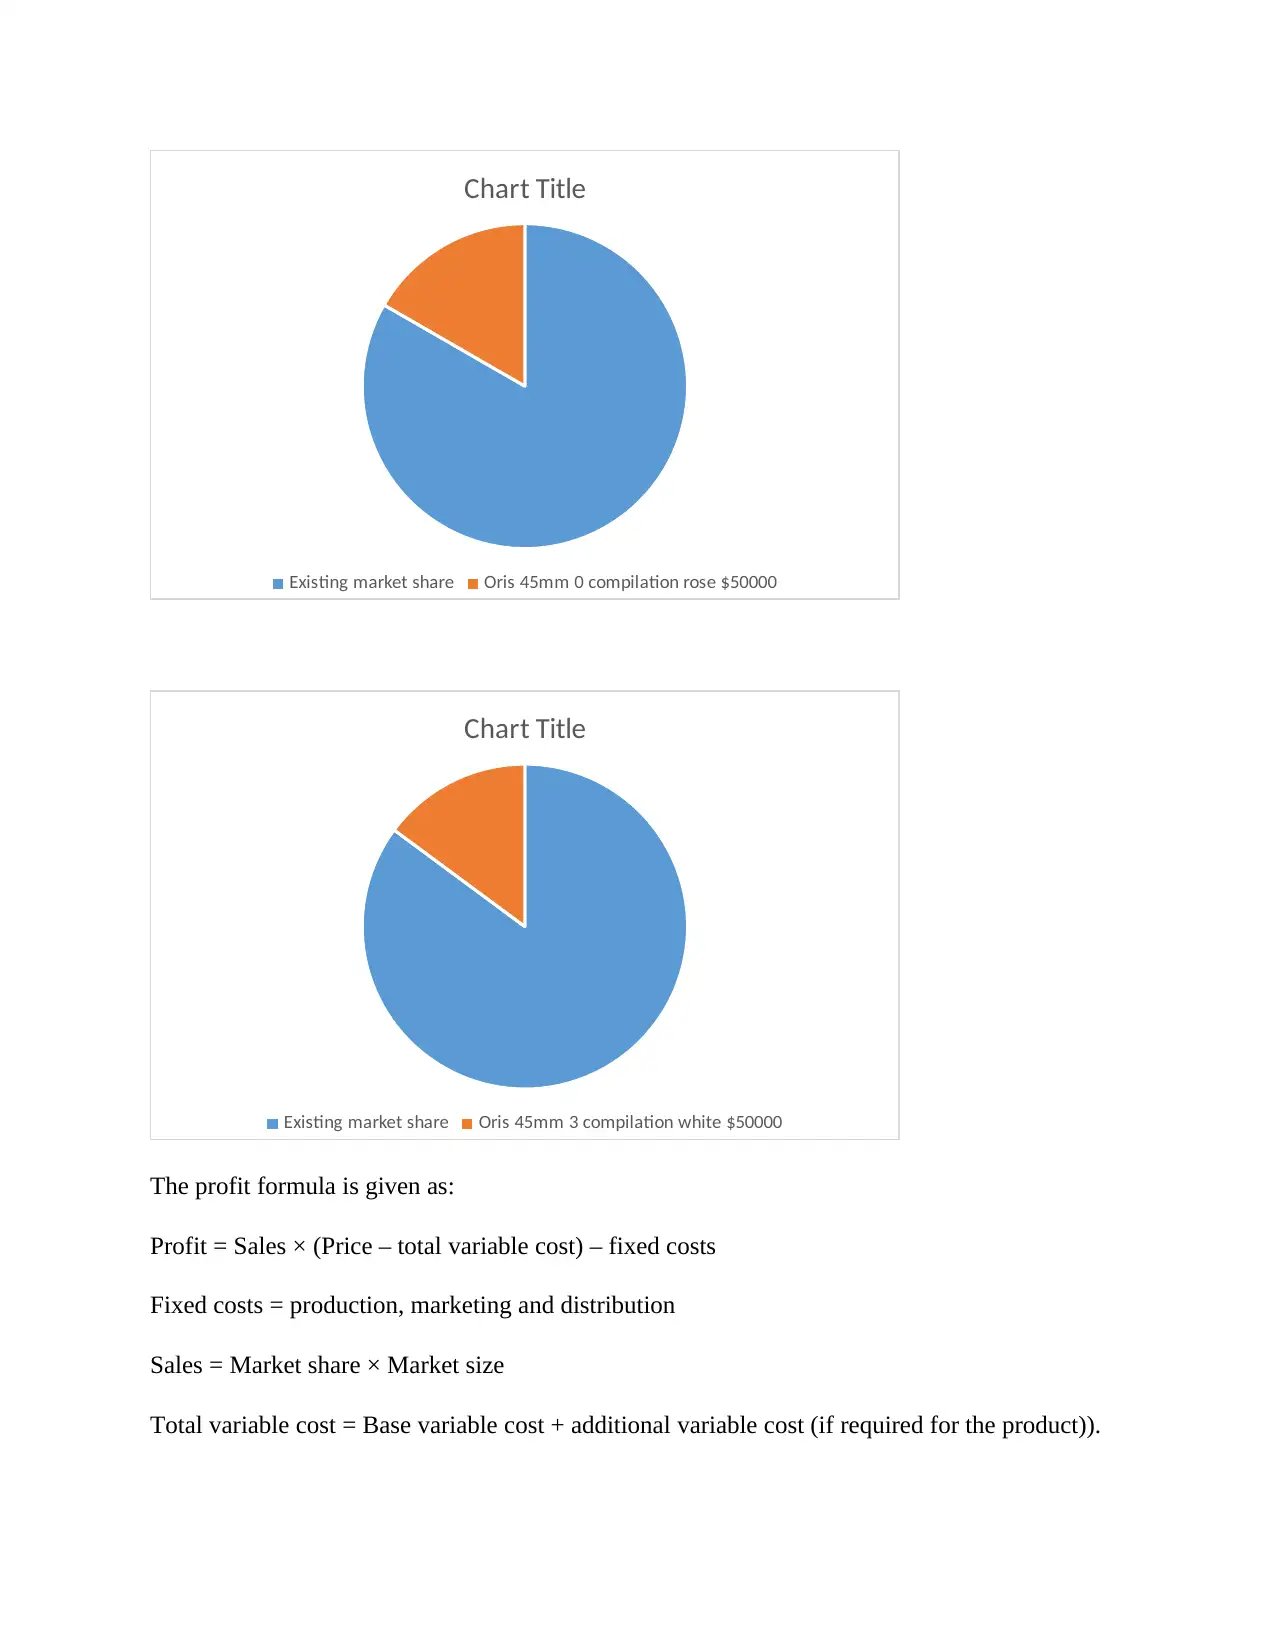
Chart Title
Existing market share Oris 45mm 0 compilation rose $50000
Chart Title
Existing market share Oris 45mm 3 compilation white $50000
The profit formula is given as:
Profit = Sales × (Price – total variable cost) – fixed costs
Fixed costs = production, marketing and distribution
Sales = Market share × Market size
Total variable cost = Base variable cost + additional variable cost (if required for the product)).
Paraphrase This Document
Need a fresh take? Get an instant paraphrase of this document with our AI Paraphraser
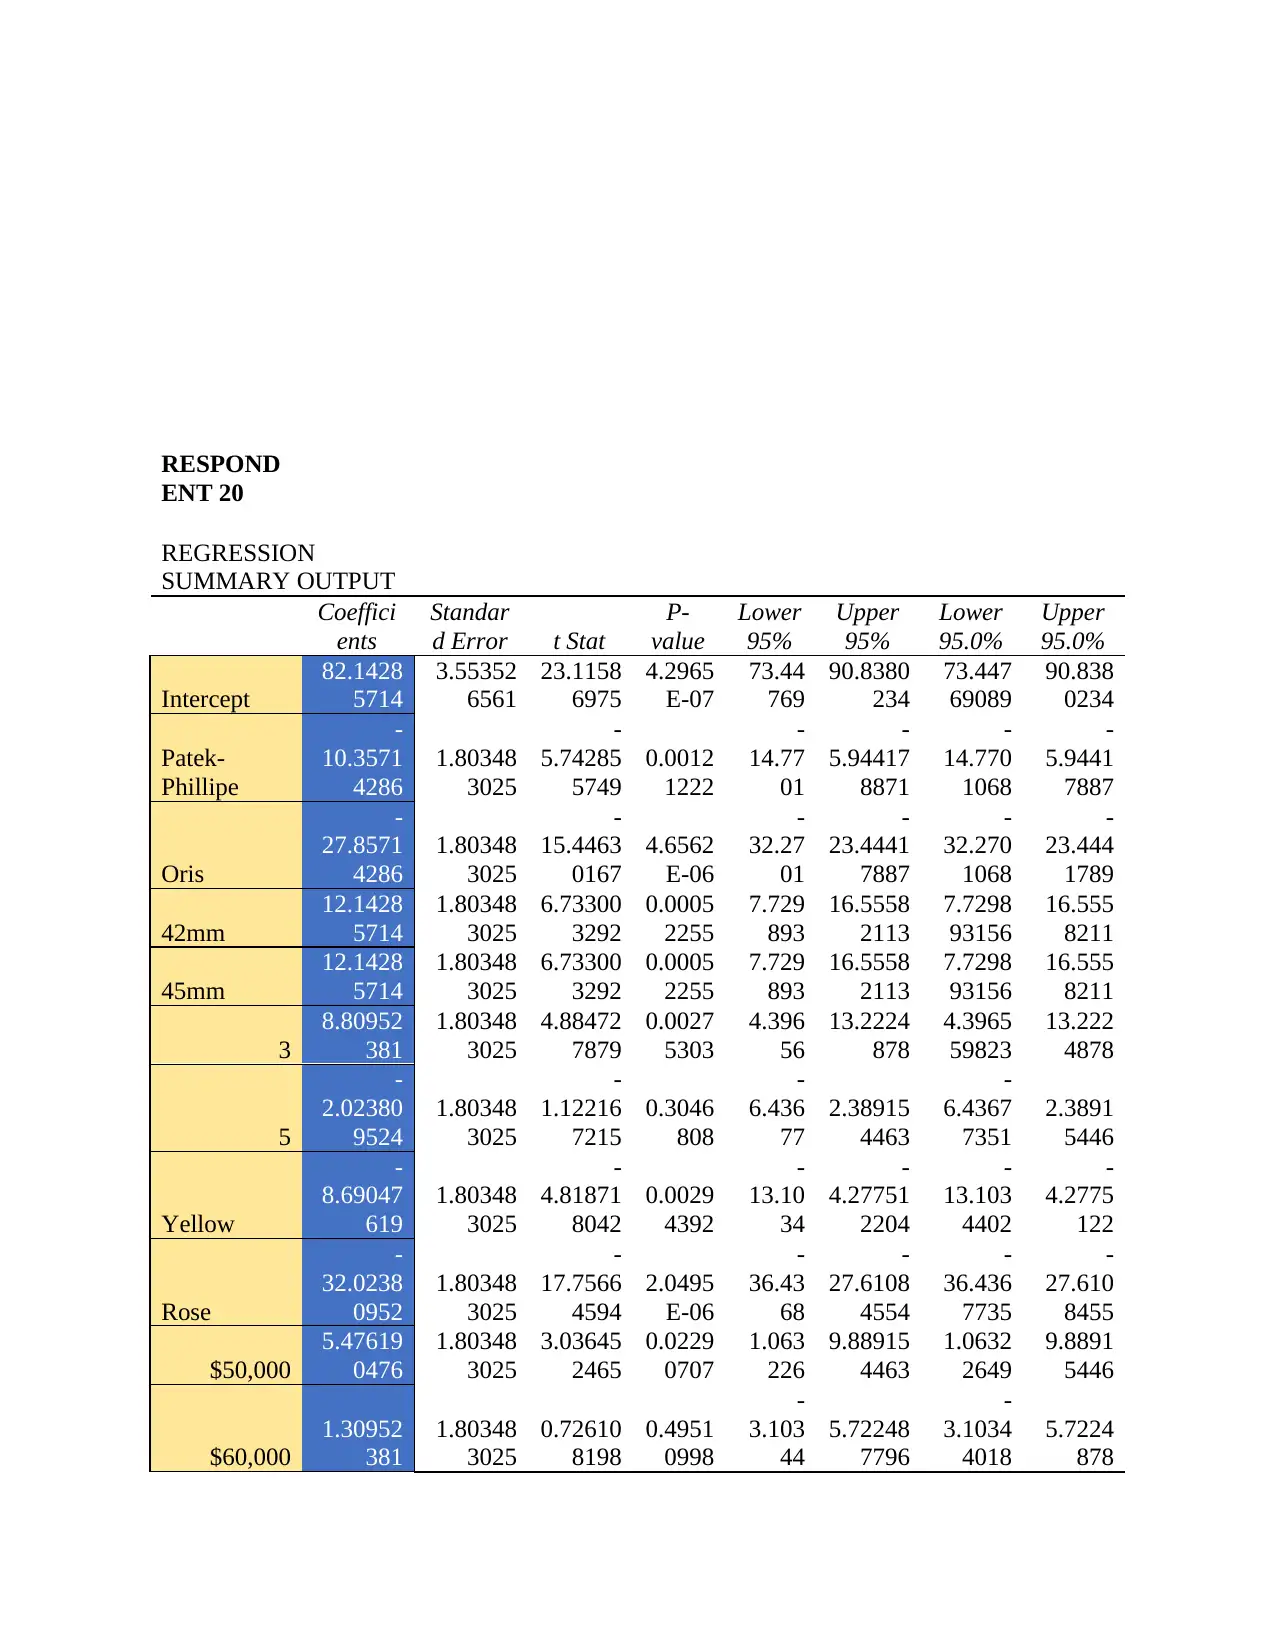
The profit is calculated for only these two watches since it is the only data we could find.
However, to make the calculations automated and dynamic, I have provided a simple Python
script which prompt the user to give all the required variables. The script then calculates and
return the profit. This script therefore caters not only for the two data points we have but also for
all possible unseen data. The script is attached along this report and requires only python 3.x
installation to execute.
From the two options available, the profits are as follows:
1. Oris 45mm, 0 complications, rose gold: $655,000,000
2. Oris 45mm, 3 complications, white gold: $405,000,000
Recommendation
It is observed that Oris 45mm rose gold with 0 complications gives more than 15% of the
Oris 45mm white gold with 3 complications. Despite the former having a higher market share
(17%) compared to the later (15%), the high production cost makes it less profitable.
We recommend that the Oris company seek more data and evaluate the market share of all 45mm
possible combinations to find the most profitable. With this information the company has two
options:
Stick to the most profitable watches if the current profit maximization is their main concern.
Analyze the market trend and focus the watches that are likely to give more profit in
future. This is because the profit is a function of market share. For instance, if Oris 45mm white
gold with 3 complications market share increased from the current 17% to 30%, the profit
increases from $405,000,000 to $730,000,000. Hence, even thought is costs more to produce,
having a big market share makes it more profitable than the cheaper-to-produce Oris 45mm rose
gold with 0 complications.
Hence, the company should look at both current and prospective future profits and make the
appropriate decisions.

Appendix
Dummy Variable Generation
Table 1 Dummy Variable Generation
Brand Dummy
Variables
Size Dummy
variables
Comp Dummy
Variables
Type Dummy
Variable
Price Dummy
Variables
Product
profile
Patek-
Phillipe
Or
is
42m
m
45m
m 3 5
Yello
w Rose
$50,0
00
$60,0
00
1 0 0 0 0 0 0 0 0 0 0
2 0 0 1 0 1 0 1 0 1 0
3 0 0 0 1 0 1 0 1 0 1
4 1 0 0 0 0 0 1 0 1 0
5 1 0 1 0 1 0 0 1 0 1
6 1 0 0 1 0 1 0 0 0 0
7 0 1 0 0 1 0 0 0 0 1
8 0 1 1 0 0 1 1 0 0 0
9 0 1 0 1 0 0 0 1 1 0
10 0 0 0 0 0 1 0 1 1 0
11 0 0 1 0 0 0 0 0 0 1
12 0 0 0 1 1 0 1 0 0 0
13 1 0 0 0 1 0 0 1 0 0
14 1 0 1 0 0 1 0 0 1 0
15 1 0 0 1 0 0 1 0 0 1
16 0 1 0 0 0 1 1 0 0 1
17 0 1 1 0 0 0 0 1 0 0
18 0 1 0 1 1 0 0 0 1 0

Regression Analysis
Table 2 Regression Analysis
Table 2 Regression Analysis
Secure Best Marks with AI Grader
Need help grading? Try our AI Grader for instant feedback on your assignments.

RESPOND
ENT 1
REGRESSION
SUMMARY OUTPUT
Coefficie
nts
Standar
d Error t Stat
P-
value
Lower
95%
Upper
95%
Lower
95.0%
Upper
95.0%
Intercept
74.2857
1429
4.21569
7907
17.6212
1384
2.1442
E-06
63.97
027
84.6011
5546
63.970
27312
84.601
1555
Patek-
Phillipe
-
0.71428
5714
2.13954
7709
-
0.33384
893
0.7498
528
-
5.949
57
4.52099
8931
-
5.9495
7036
4.5209
9893
Oris
-
3.21428
5714
2.13954
7709
-
1.50232
0187
0.1836
9897
-
8.449
57
2.02099
8931
-
8.4495
7036
2.0209
9893
42mm
3.45238
0952
2.13954
7709
1.61360
3164
0.1577
4043
-
1.782
9
8.68766
5598
-
1.7829
0369
8.6876
656
45mm
20.1190
4762
2.13954
7709
9.40341
1541
8.2165
E-05
14.88
376
25.3543
3226
14.883
76297
25.354
3323
3
-
7.38095
2381
2.13954
7709
-
3.44977
2281
0.0136
3679
-
12.61
62
-
2.14566
7736
-
12.616
237
-
2.1456
6774
5
-
1.54761
9048
2.13954
7709
-
0.72333
9349
0.4966
9002
-
6.782
9
3.68766
5598
-
6.7829
0369
3.6876
656
Yellow
15.1190
4762
2.13954
7709
7.06646
9028
0.0004
023
9.883
763
20.3543
3226
9.8837
62974
20.354
3323
Rose
-
24.0476
1905
2.13954
7709
-
11.2395
8066
2.964
E-05
-
29.28
29
-
18.8123
344
-
29.282
9037
-
18.812
3344
$50,000
-
5.71428
5714
2.13954
7709
-
2.67079
1444
0.0369
8751
-
10.94
96
-
0.47900
1069
-
10.949
5704
-
0.4790
0107
$60,000
-
13.2142
8571
2.13954
7709
-
6.17620
5213
0.0008
2819
-
18.44
96
-
7.97900
1069
-
18.449
5704
-
7.9790
0107
RESPOND
ENT 20
REGRESSION
SUMMARY OUTPUT
Coeffici
ents
Standar
d Error t Stat
P-
value
Lower
95%
Upper
95%
Lower
95.0%
Upper
95.0%
Intercept
82.1428
5714
3.55352
6561
23.1158
6975
4.2965
E-07
73.44
769
90.8380
234
73.447
69089
90.838
0234
Patek-
Phillipe
-
10.3571
4286
1.80348
3025
-
5.74285
5749
0.0012
1222
-
14.77
01
-
5.94417
8871
-
14.770
1068
-
5.9441
7887
Oris
-
27.8571
4286
1.80348
3025
-
15.4463
0167
4.6562
E-06
-
32.27
01
-
23.4441
7887
-
32.270
1068
-
23.444
1789
42mm
12.1428
5714
1.80348
3025
6.73300
3292
0.0005
2255
7.729
893
16.5558
2113
7.7298
93156
16.555
8211
45mm
12.1428
5714
1.80348
3025
6.73300
3292
0.0005
2255
7.729
893
16.5558
2113
7.7298
93156
16.555
8211
3
8.80952
381
1.80348
3025
4.88472
7879
0.0027
5303
4.396
56
13.2224
878
4.3965
59823
13.222
4878
5
-
2.02380
9524
1.80348
3025
-
1.12216
7215
0.3046
808
-
6.436
77
2.38915
4463
-
6.4367
7351
2.3891
5446
Yellow
-
8.69047
619
1.80348
3025
-
4.81871
8042
0.0029
4392
-
13.10
34
-
4.27751
2204
-
13.103
4402
-
4.2775
122
Rose
-
32.0238
0952
1.80348
3025
-
17.7566
4594
2.0495
E-06
-
36.43
68
-
27.6108
4554
-
36.436
7735
-
27.610
8455
$50,000
5.47619
0476
1.80348
3025
3.03645
2465
0.0229
0707
1.063
226
9.88915
4463
1.0632
2649
9.8891
5446
$60,000
1.30952
381
1.80348
3025
0.72610
8198
0.4951
0998
-
3.103
44
5.72248
7796
-
3.1034
4018
5.7224
878
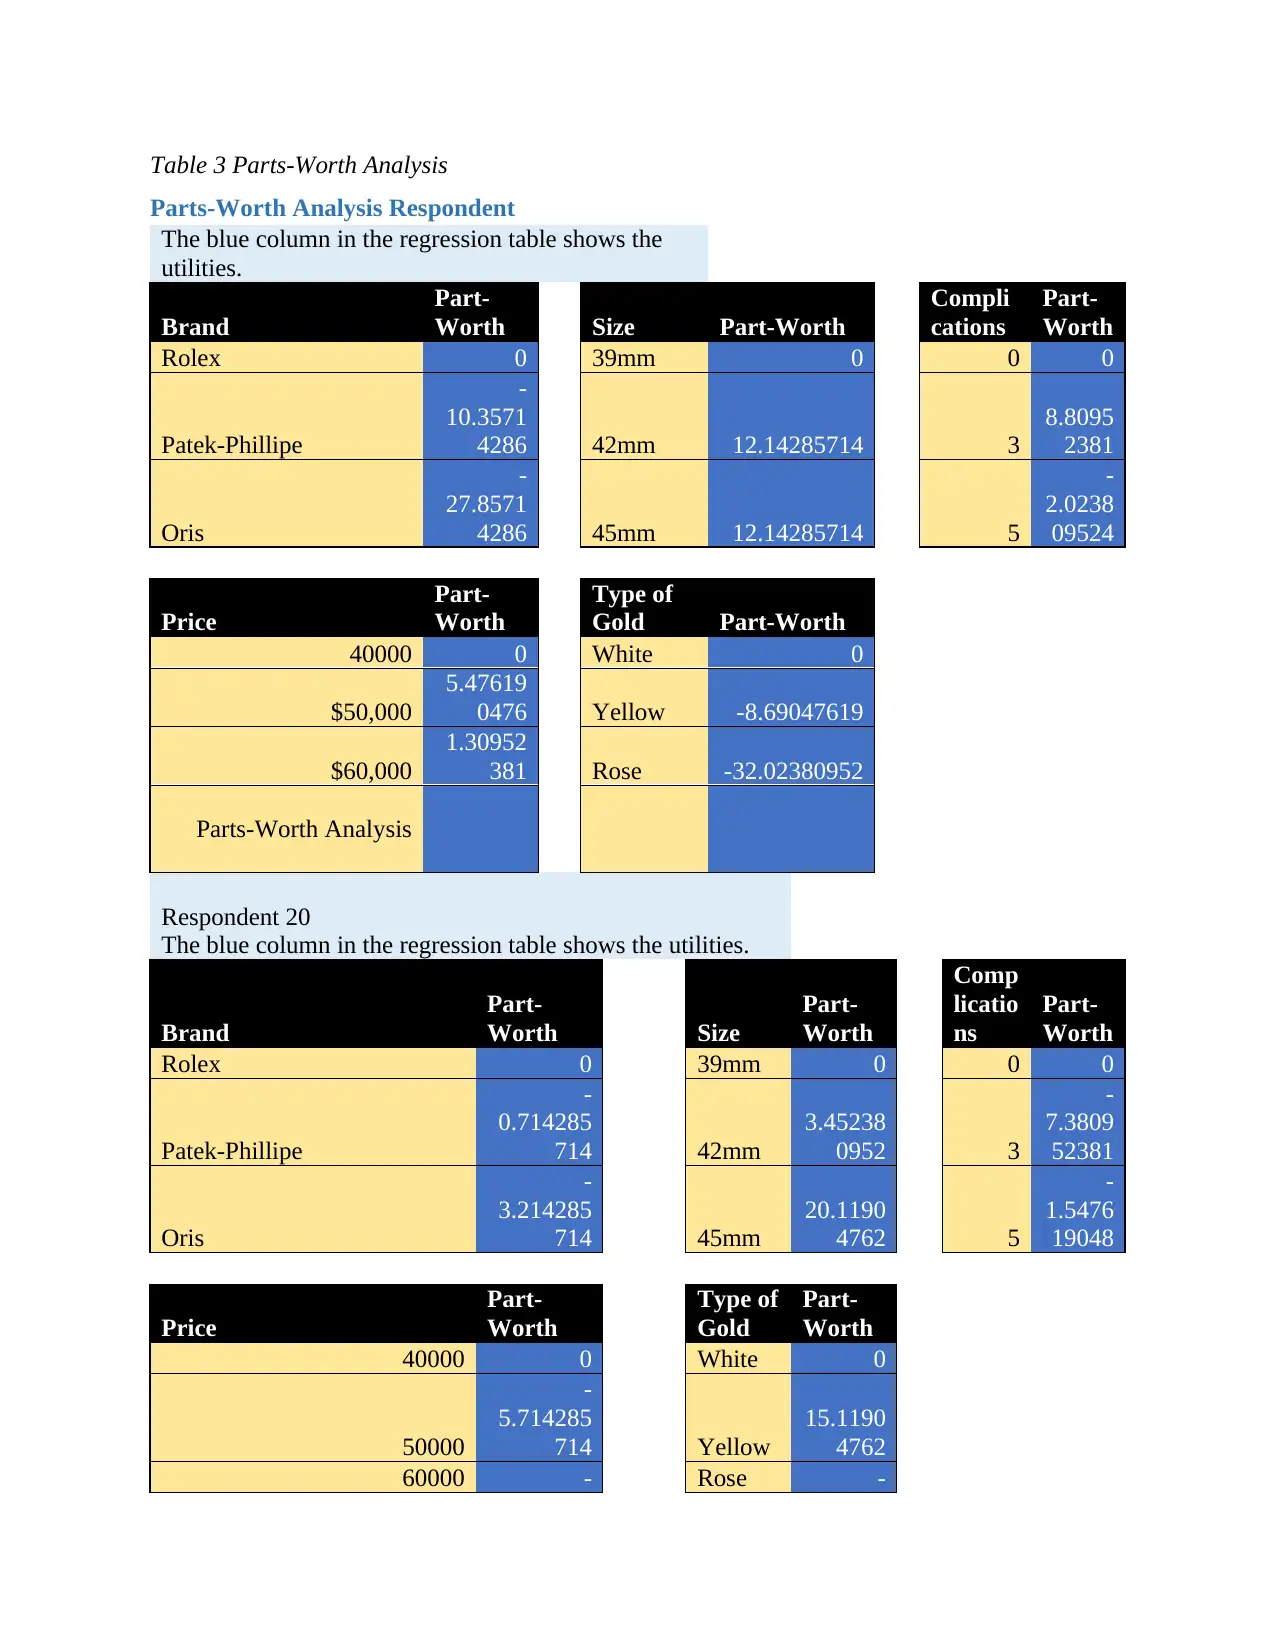
Table 3 Parts-Worth Analysis
Parts-Worth Analysis Respondent
The blue column in the regression table shows the
utilities.
Brand
Part-
Worth Size Part-Worth
Compli
cations
Part-
Worth
Rolex 0 39mm 0 0 0
Patek-Phillipe
-
10.3571
4286 42mm 12.14285714 3
8.8095
2381
Oris
-
27.8571
4286 45mm 12.14285714 5
-
2.0238
09524
Price
Part-
Worth
Type of
Gold Part-Worth
40000 0 White 0
$50,000
5.47619
0476 Yellow -8.69047619
$60,000
1.30952
381 Rose -32.02380952
Parts-Worth Analysis
Respondent 20
The blue column in the regression table shows the utilities.
Brand
Part-
Worth Size
Part-
Worth
Comp
licatio
ns
Part-
Worth
Rolex 0 39mm 0 0 0
Patek-Phillipe
-
0.714285
714 42mm
3.45238
0952 3
-
7.3809
52381
Oris
-
3.214285
714 45mm
20.1190
4762 5
-
1.5476
19048
Price
Part-
Worth
Type of
Gold
Part-
Worth
40000 0 White 0
50000
-
5.714285
714 Yellow
15.1190
4762
60000 - Rose -
Paraphrase This Document
Need a fresh take? Get an instant paraphrase of this document with our AI Paraphraser
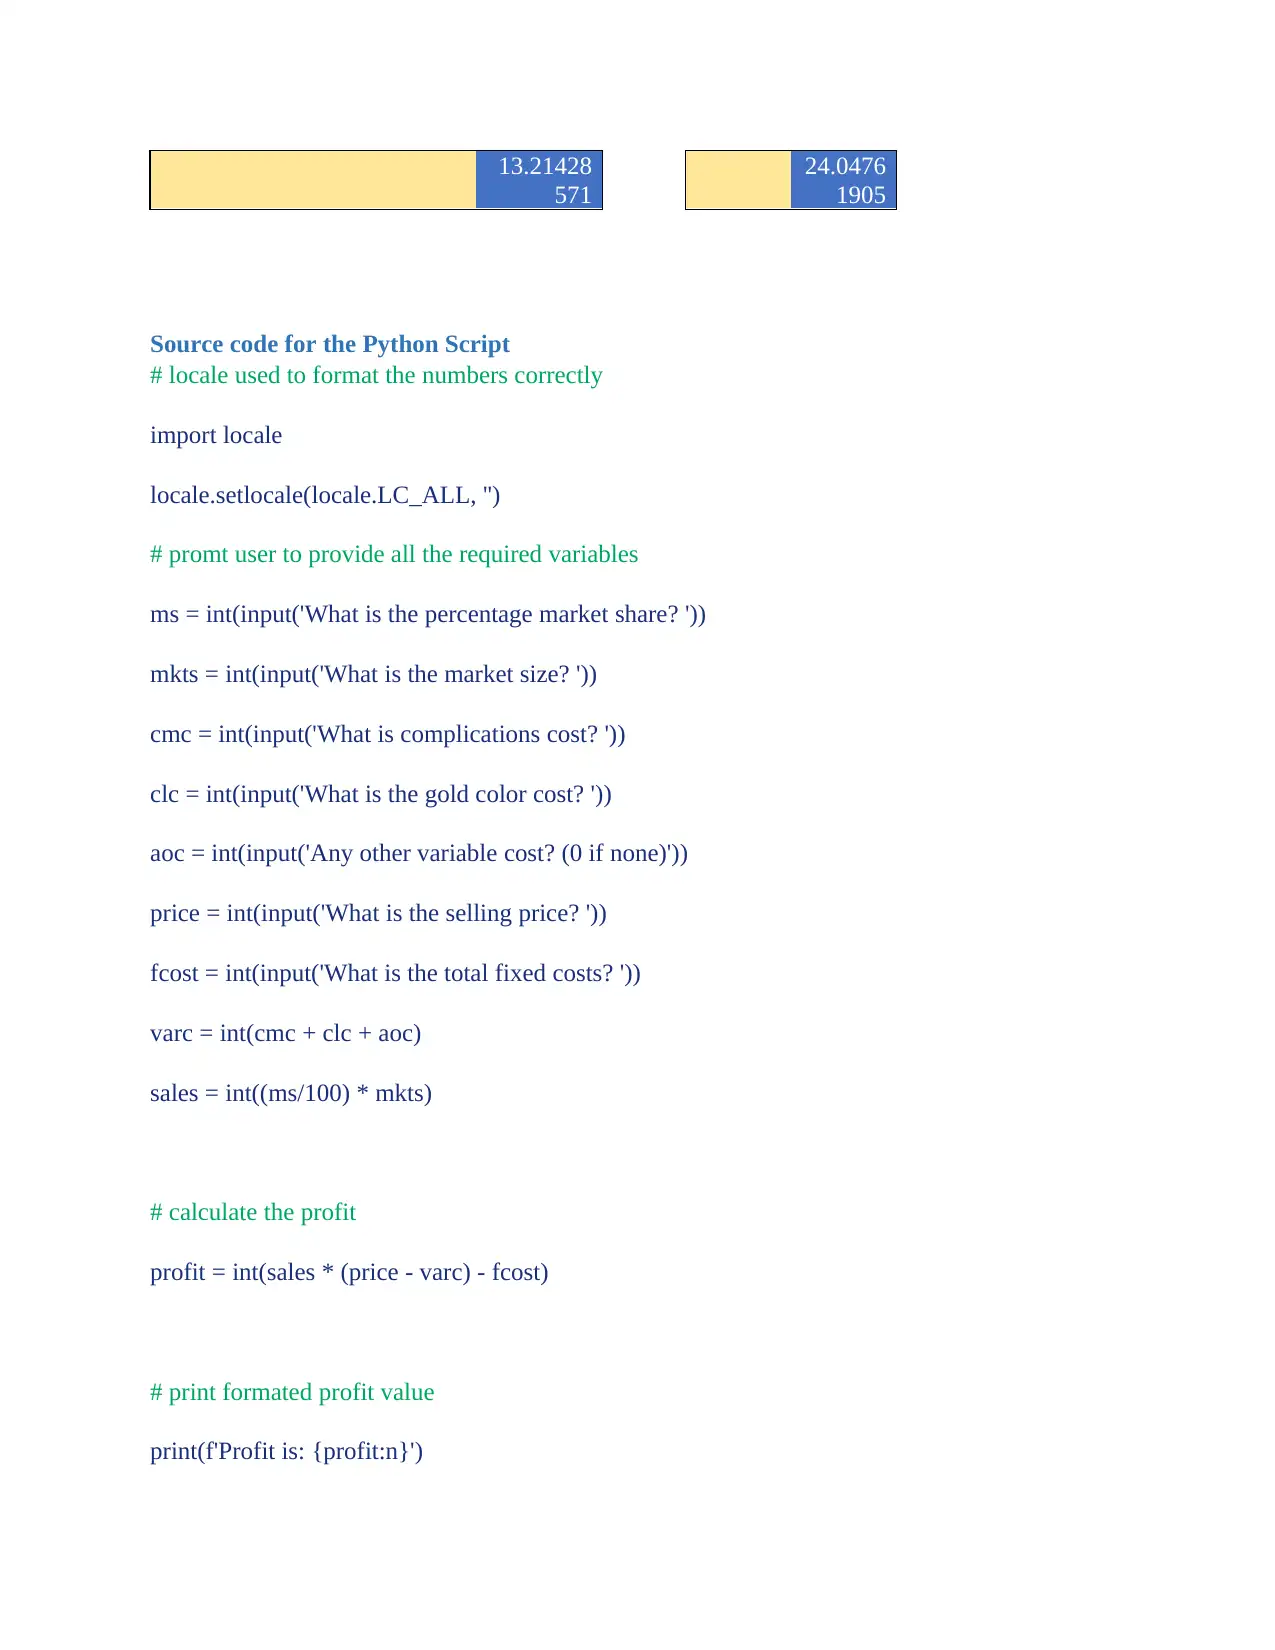
13.21428
571
24.0476
1905
Source code for the Python Script
# locale used to format the numbers correctly
import locale
locale.setlocale(locale.LC_ALL, '')
# promt user to provide all the required variables
ms = int(input('What is the percentage market share? '))
mkts = int(input('What is the market size? '))
cmc = int(input('What is complications cost? '))
clc = int(input('What is the gold color cost? '))
aoc = int(input('Any other variable cost? (0 if none)'))
price = int(input('What is the selling price? '))
fcost = int(input('What is the total fixed costs? '))
varc = int(cmc + clc + aoc)
sales = int((ms/100) * mkts)
# calculate the profit
profit = int(sales * (price - varc) - fcost)
# print formated profit value
print(f'Profit is: {profit:n}')
Reference
Terasaki, S. and Nagasawa, S.Y., 2014. Branding Luxury Through Affective Value Case of Swiss Watch
Industry. In Industrial Applications of Affective Engineering (pp. 167-180). Springer, Cham.
Terasaki, S. and Nagasawa, S.Y., 2014. Branding Luxury Through Affective Value Case of Swiss Watch
Industry. In Industrial Applications of Affective Engineering (pp. 167-180). Springer, Cham.
1 out of 15


Your All-in-One AI-Powered Toolkit for Academic Success.
+13062052269
info@desklib.com
Available 24*7 on WhatsApp / Email
![[object Object]](/_next/static/media/star-bottom.7253800d.svg)
Unlock your academic potential
© 2024 | Zucol Services PVT LTD | All rights reserved.