North Sydney Market Analysis
VerifiedAdded on 2022/12/30
|18
|3491
|66
AI Summary
This report aims to explore the market and identify the most suitable group of customers for the coffee business in North Sydney. It includes findings on the age distribution, marital status, and income behavior of potential customers. The data was obtained from the Australian Bureau of Statistics (ABS) and analyzed using Microsoft Excel.
Contribute Materials
Your contribution can guide someone’s learning journey. Share your
documents today.

North Sydney market analysis
i
i
Secure Best Marks with AI Grader
Need help grading? Try our AI Grader for instant feedback on your assignments.
Executive summary
The main aim of this report was to employ marketing strategies to explore the market and
identify the most suitable group of customers the coffee business should on in North Sydney city.
In response to that therefore, this report developed two objectives to be met i.e. to determine the
categories of customers to be focused on by the coffee business and to examine the income
behavior of the focused categories of customers. Data visualization of the census data obtained
from ABS on community profile was done using Microsoft excel. From the results, the large
number of people in the population were of the age between 25 and 74 years. Most of the people
were married from the age of 25 to 64 years. Considering the population, the coffee business will
focus on all different types of families living within and around Sydney as its potential customers
since all the families were working and earning weekly income of at least $150.
ii
Table of Contents
Executive summary...................................................................................................................................ii
Introduction...............................................................................................................................................1
Objectives...............................................................................................................................................1
Questions................................................................................................................................................2
Literature review.......................................................................................................................................2
Methodology..............................................................................................................................................3
Report findings..........................................................................................................................................3
Determining the category of customers focused on by coffee business..............................................4
Examination of income behavior of focused categories of customers................................................7
Discussion...................................................................................................................................................9
Conclusion................................................................................................................................................10
References................................................................................................................................................11
Appendices...............................................................................................................................................13
iii
Introduction
Growth and development of each business depends on the availability of customers in the
market. Being that there is competition from other businesses offering or supplying the same
product in the market, customer approach is very vital and varies from business to business (Kim
et al, 2012). Customers exist in the market in different categories including potential customers,
new customers, impulsive customers, discount customers and loyal customers (Dijkman et al,
2015; Fan et al, 2015). Potential customers are those who have not become the customers yet but
the business strives to lure them by showing them value of the products they sell or supply and
identifying themselves whereas new customers are the first timers to buy from the business
enterprise who the business can guide to success and also provide them with their contact options
to contact whenever they need to be supplied with the products just to discuss a few categories of
customers (Stangl et al, 2017). Intense market research is therefore very essential in business
since it may help the business managers to get prepared to face the existing and arising
challenges in the future (Li, 2016). In response to that, business organizations nowadays make
good use of big data to explore the customer behaviors and market at large and trying to predict
the future through conducting predictive analysis. The main reason for this research was to
employ market approaches to explore and understand the market and identify the most
appropriate category of consumers in the market to be focused on by the coffee business in
greater Sydney. Understanding customers’ background is very essential since it help the business
to know what they expect in return from the market in various seasons throughout the year.
Objectives
1. To define the categories of consumers to be focused on by the coffee business
2. To examine the income behavior of the focused categories of customers
1
Secure Best Marks with AI Grader
Need help grading? Try our AI Grader for instant feedback on your assignments.
Questions
1. What category of customers should the business focus on?
2. What is the income behavior of the focused categories of customers?
Literature review
Coffee is one of the first moving and readily consumable goods that does well in Australia. Due
to that fact, the country has been experiencing robust growth in terms of additional coffee shops
in the market in different parts of the country (Baroh et al, 2014; Biswas, 2014). Reports
indicated that origin and the taste of coffee product have been the major concern of Australians
in the previous years (Smith et al, 2016). The question about the origin of coffee consumed in the
country led to developed strategy that ensured farming of certified green coffee beans by 2016
(Uman et al, 2016). Robust coffee culture has been seen in Australia for years and that has been
one major reason for the crowding of coffee shops within the country (Yang et al, 2012). Large
number of customers that comes from the love of coffee by country men has made competition
in the country to be so stiff in the industry leading to the industry’s growth by 2.2% (Sadeli et al,
2016). Coffee supplied in the market are in to categories including Arabica and Robusta. In
comparison between the two categories of coffee market in Australia, Arabica was found to be
more dominant in terms of shares in the market than Robusta. Coffee sold to the final consumers
are again categorized into instant coffee, ground coffee and whole bean coffee. Australians had
shown to like instant coffee the most because it has good aroma and flavor than those others
available in the marketplace (Meule, 2015). Coffee industry contributes to growth of economy of
Australia since it is a potential employer just like other industries in the country and therefore
source of revenue to the government.
2
Methodology
This report made use of secondary data that was collated from the website of Australian Bureau
of Statistics (ABS). The government body (ABS) conducted census on population and housing
through to general community profile in the year 2016. The community profile data used in the
preparation of this report covered greater Sydney which inquired the resident’s age, sex, marital
status and original places of birth among others. Secondary data is always preferred due to the
fact that they save time and are less expensive as compared to collecting primary (Johnston,
2017; Schlomer et al, 2014). Retrieving census data and using them in market analysis results to
generation of reliable regarding the population focused on by the business (Yarnold, 2015). Not
all the retrieved data is important in the market analysis but need to be taken through series of
examination to extract the useful data out of it that best suit subject under study. The researcher
employed data visualization for the representation of census data to understand the customers’
behaviors. Data was recorded in Microsoft excel which was the statistical tool used in the
manipulation of data and represent data in charts, figures and graphs for easy understanding.
Report findings
Data was manipulated towards meeting the two major objective of this report in this section. This
section therefore had two major subsections in line with the two objectives to be met as below;
3
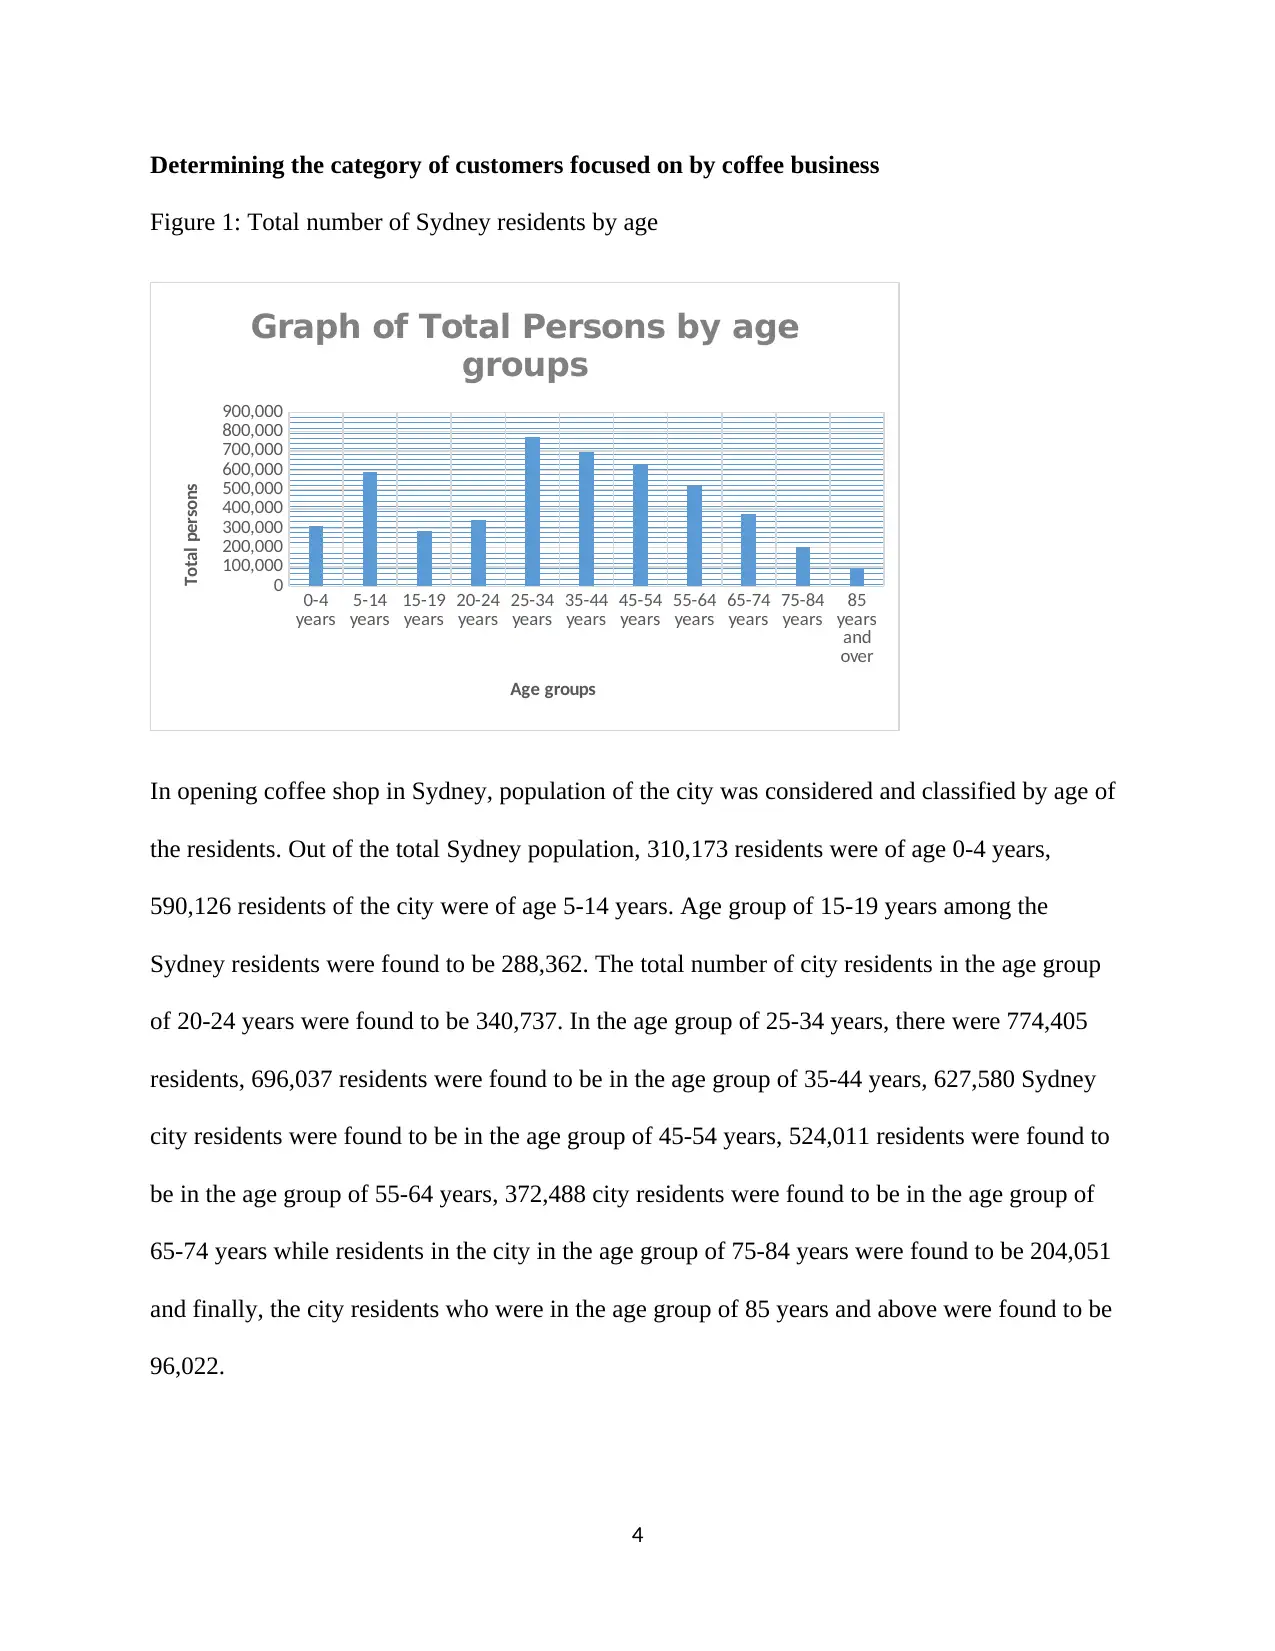
Determining the category of customers focused on by coffee business
Figure 1: Total number of Sydney residents by age
0-4
years 5-14
years 15-19
years 20-24
years 25-34
years 35-44
years 45-54
years 55-64
years 65-74
years 75-84
years 85
years
and
over
0
100,000
200,000
300,000
400,000
500,000
600,000
700,000
800,000
900,000
Graph of Total Persons by age
groups
Age groups
Total persons
In opening coffee shop in Sydney, population of the city was considered and classified by age of
the residents. Out of the total Sydney population, 310,173 residents were of age 0-4 years,
590,126 residents of the city were of age 5-14 years. Age group of 15-19 years among the
Sydney residents were found to be 288,362. The total number of city residents in the age group
of 20-24 years were found to be 340,737. In the age group of 25-34 years, there were 774,405
residents, 696,037 residents were found to be in the age group of 35-44 years, 627,580 Sydney
city residents were found to be in the age group of 45-54 years, 524,011 residents were found to
be in the age group of 55-64 years, 372,488 city residents were found to be in the age group of
65-74 years while residents in the city in the age group of 75-84 years were found to be 204,051
and finally, the city residents who were in the age group of 85 years and above were found to be
96,022.
4
Paraphrase This Document
Need a fresh take? Get an instant paraphrase of this document with our AI Paraphraser
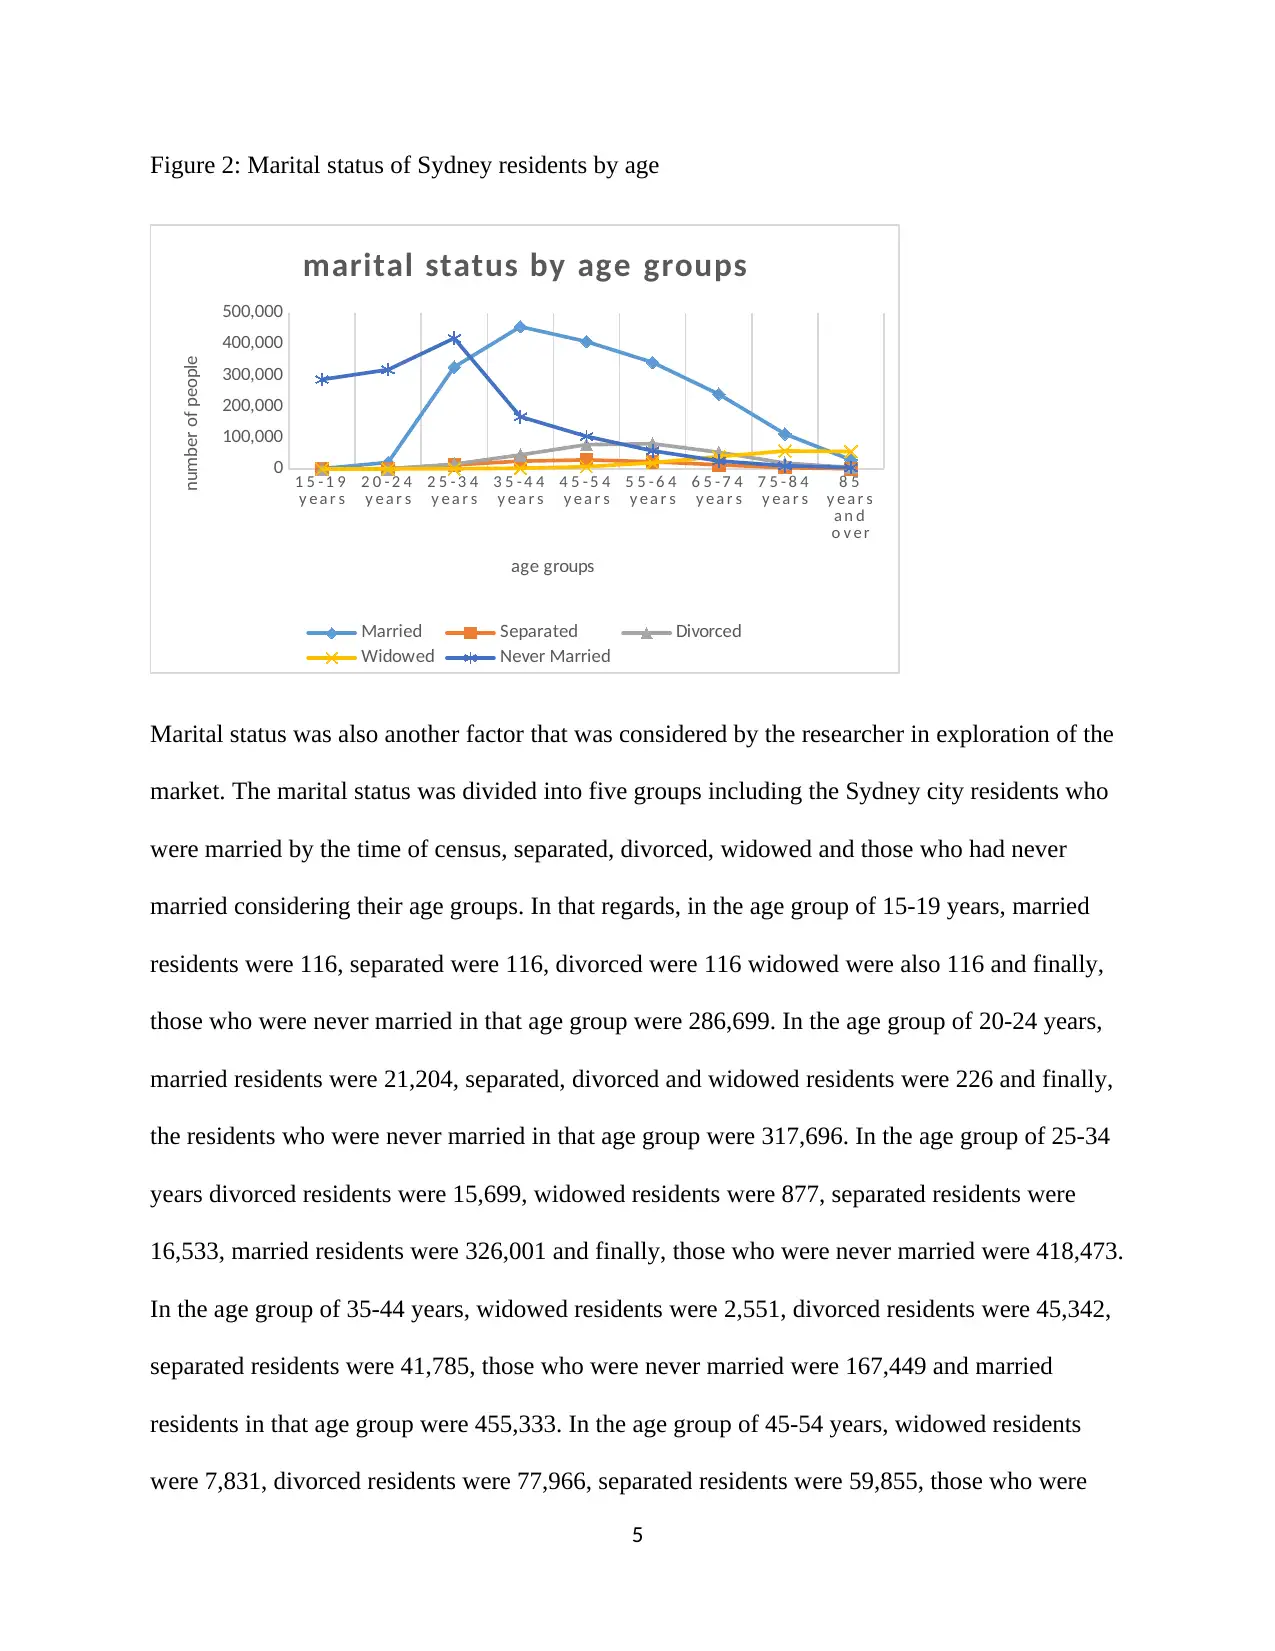
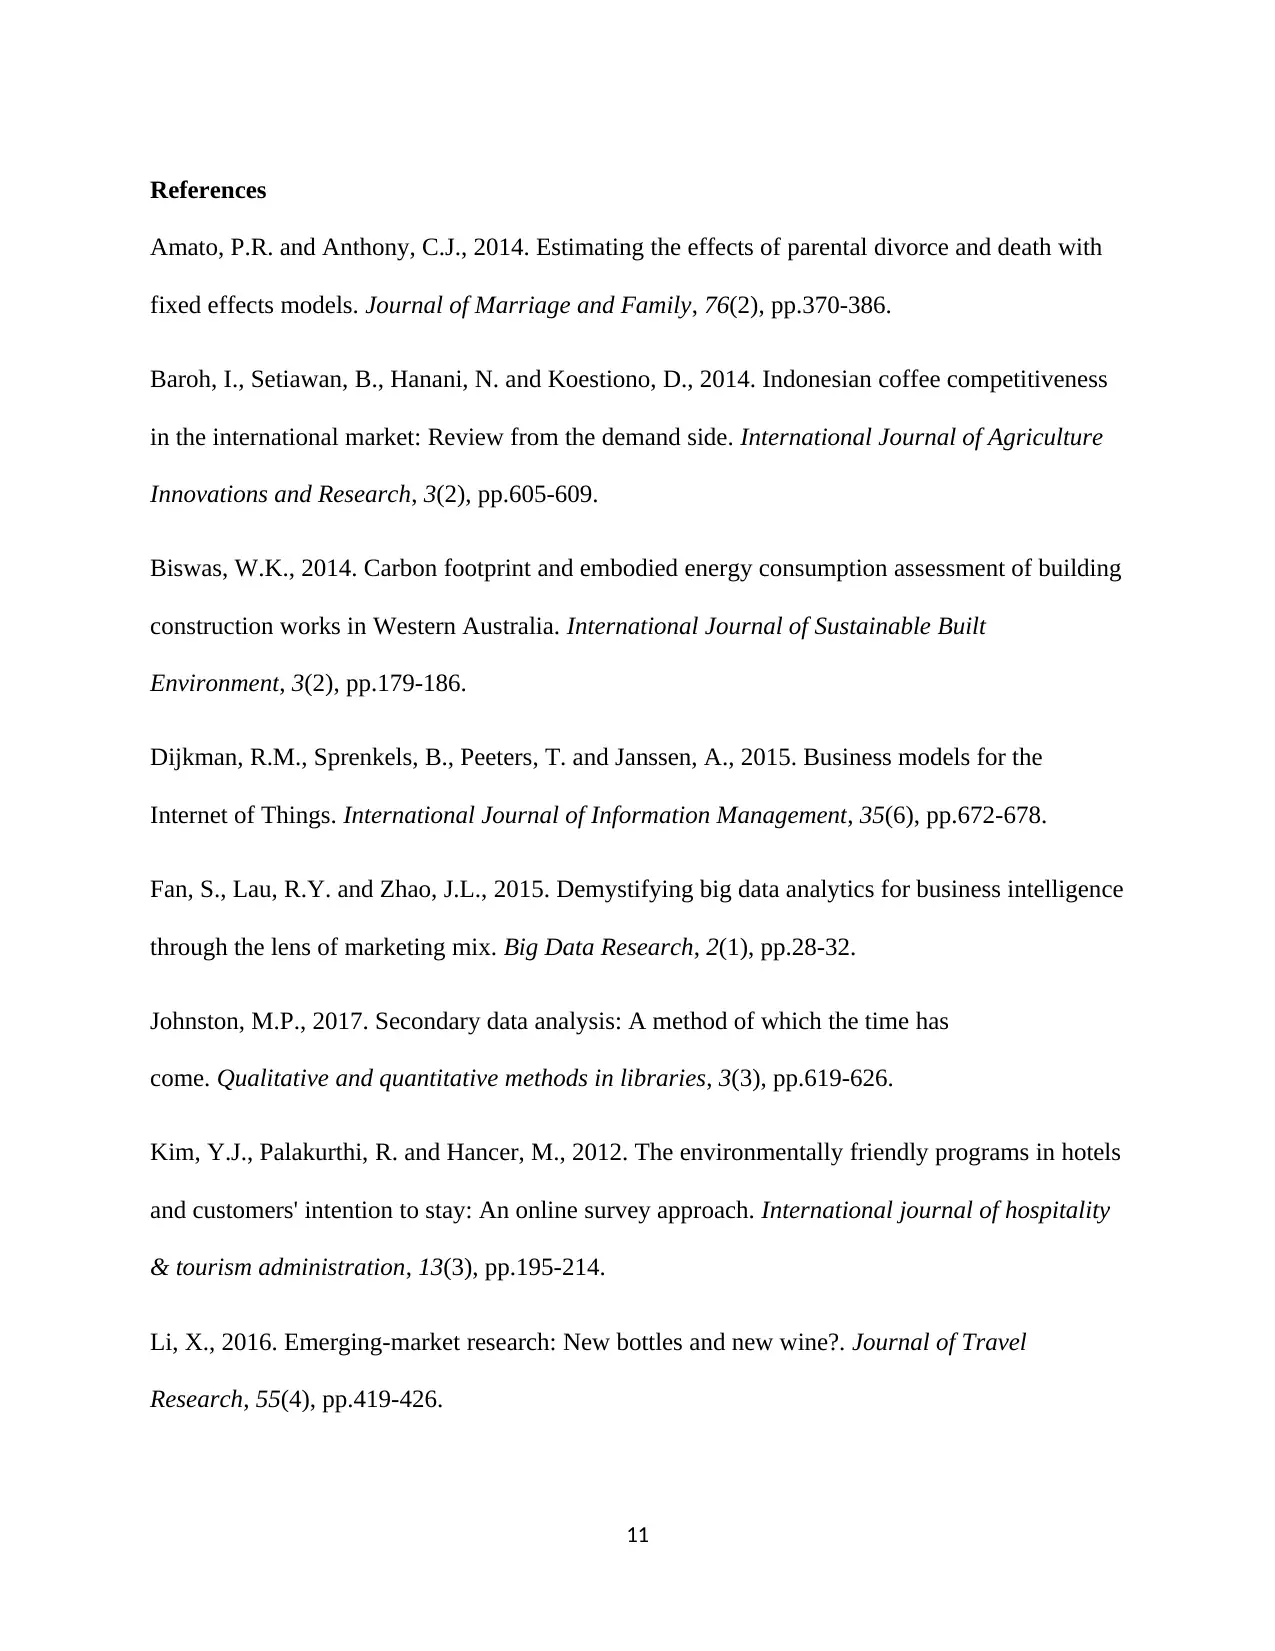
Figure 2: Marital status of Sydney residents by age
1 5 - 1 9
y e a r s
2 0 - 2 4
y e a r s
2 5 - 3 4
y e a r s
3 5 - 4 4
y e a r s
4 5 - 5 4
y e a r s
5 5 - 6 4
y e a r s
6 5 - 7 4
y e a r s
7 5 - 8 4
y e a r s
8 5
y e a r s
a n d
o v e r
0
100,000
200,000
300,000
400,000
500,000
marital status by age groups
Married Separated Divorced
Widowed Never Married
age groups
number of people
Marital status was also another factor that was considered by the researcher in exploration of the
market. The marital status was divided into five groups including the Sydney city residents who
were married by the time of census, separated, divorced, widowed and those who had never
married considering their age groups. In that regards, in the age group of 15-19 years, married
residents were 116, separated were 116, divorced were 116 widowed were also 116 and finally,
those who were never married in that age group were 286,699. In the age group of 20-24 years,
married residents were 21,204, separated, divorced and widowed residents were 226 and finally,
the residents who were never married in that age group were 317,696. In the age group of 25-34
years divorced residents were 15,699, widowed residents were 877, separated residents were
16,533, married residents were 326,001 and finally, those who were never married were 418,473.
In the age group of 35-44 years, widowed residents were 2,551, divorced residents were 45,342,
separated residents were 41,785, those who were never married were 167,449 and married
residents in that age group were 455,333. In the age group of 45-54 years, widowed residents
were 7,831, divorced residents were 77,966, separated residents were 59,855, those who were
5
never married were 104,602 and the married ones were 407,676. In the age group of 55-64 years,
the number of residents who were never married were 58,273, widowed were 20,381, separated
were 29,899, divorced were 81,055 and married residents were 341,052. In the age group of 65-
74 years, the number of residents who were never married were 25,917, those who were
separated were 23,524, widowed were 28,325, divorced were 53,715 and finally, married
residents in that age group were 239,643. In the age group of 75-84 years, the number of
residents who were never married were 10,328, divorced were 10,894, separated were 10,285,
widowed were 57,943 and the married ones were 112,462. The number of residents in the age
group of 85 years and above who were never married were 4,548, separated were 4,325, married
were 12,566 and widowed were 56,063.
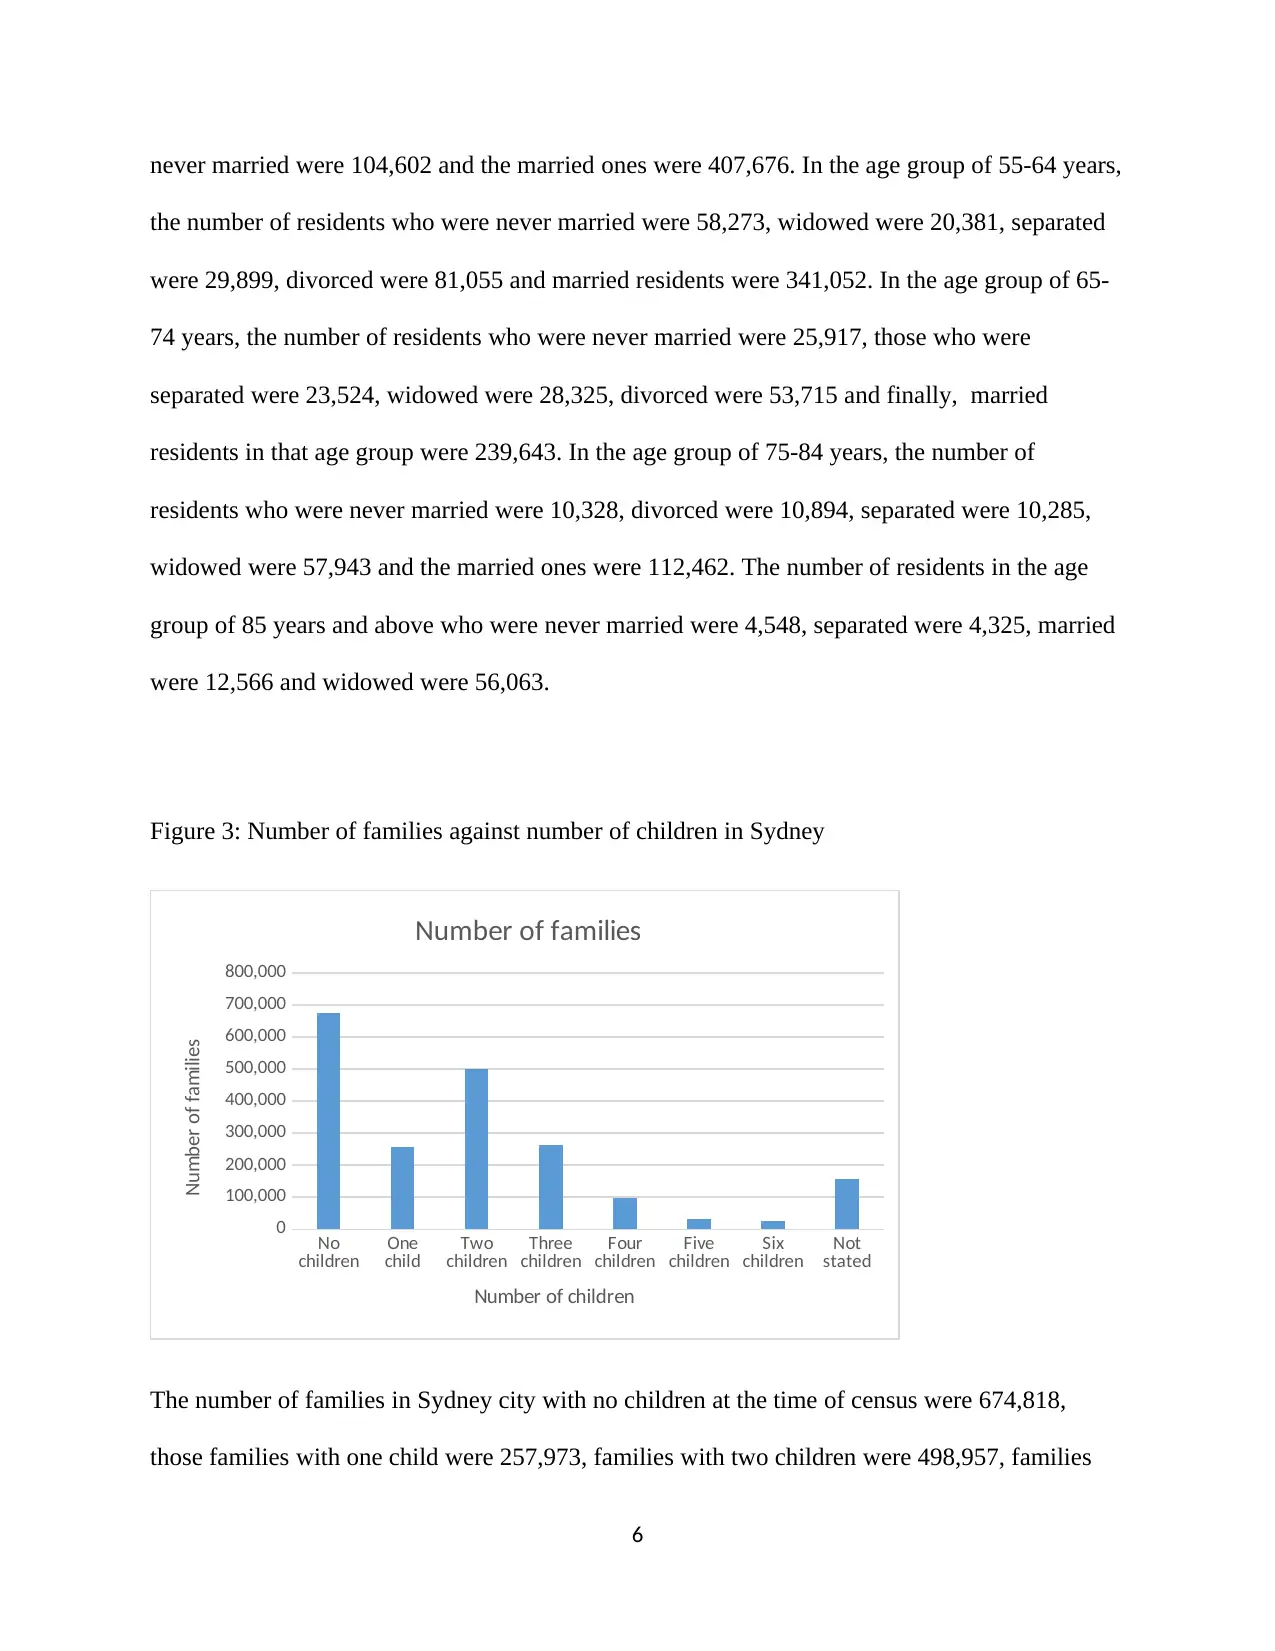
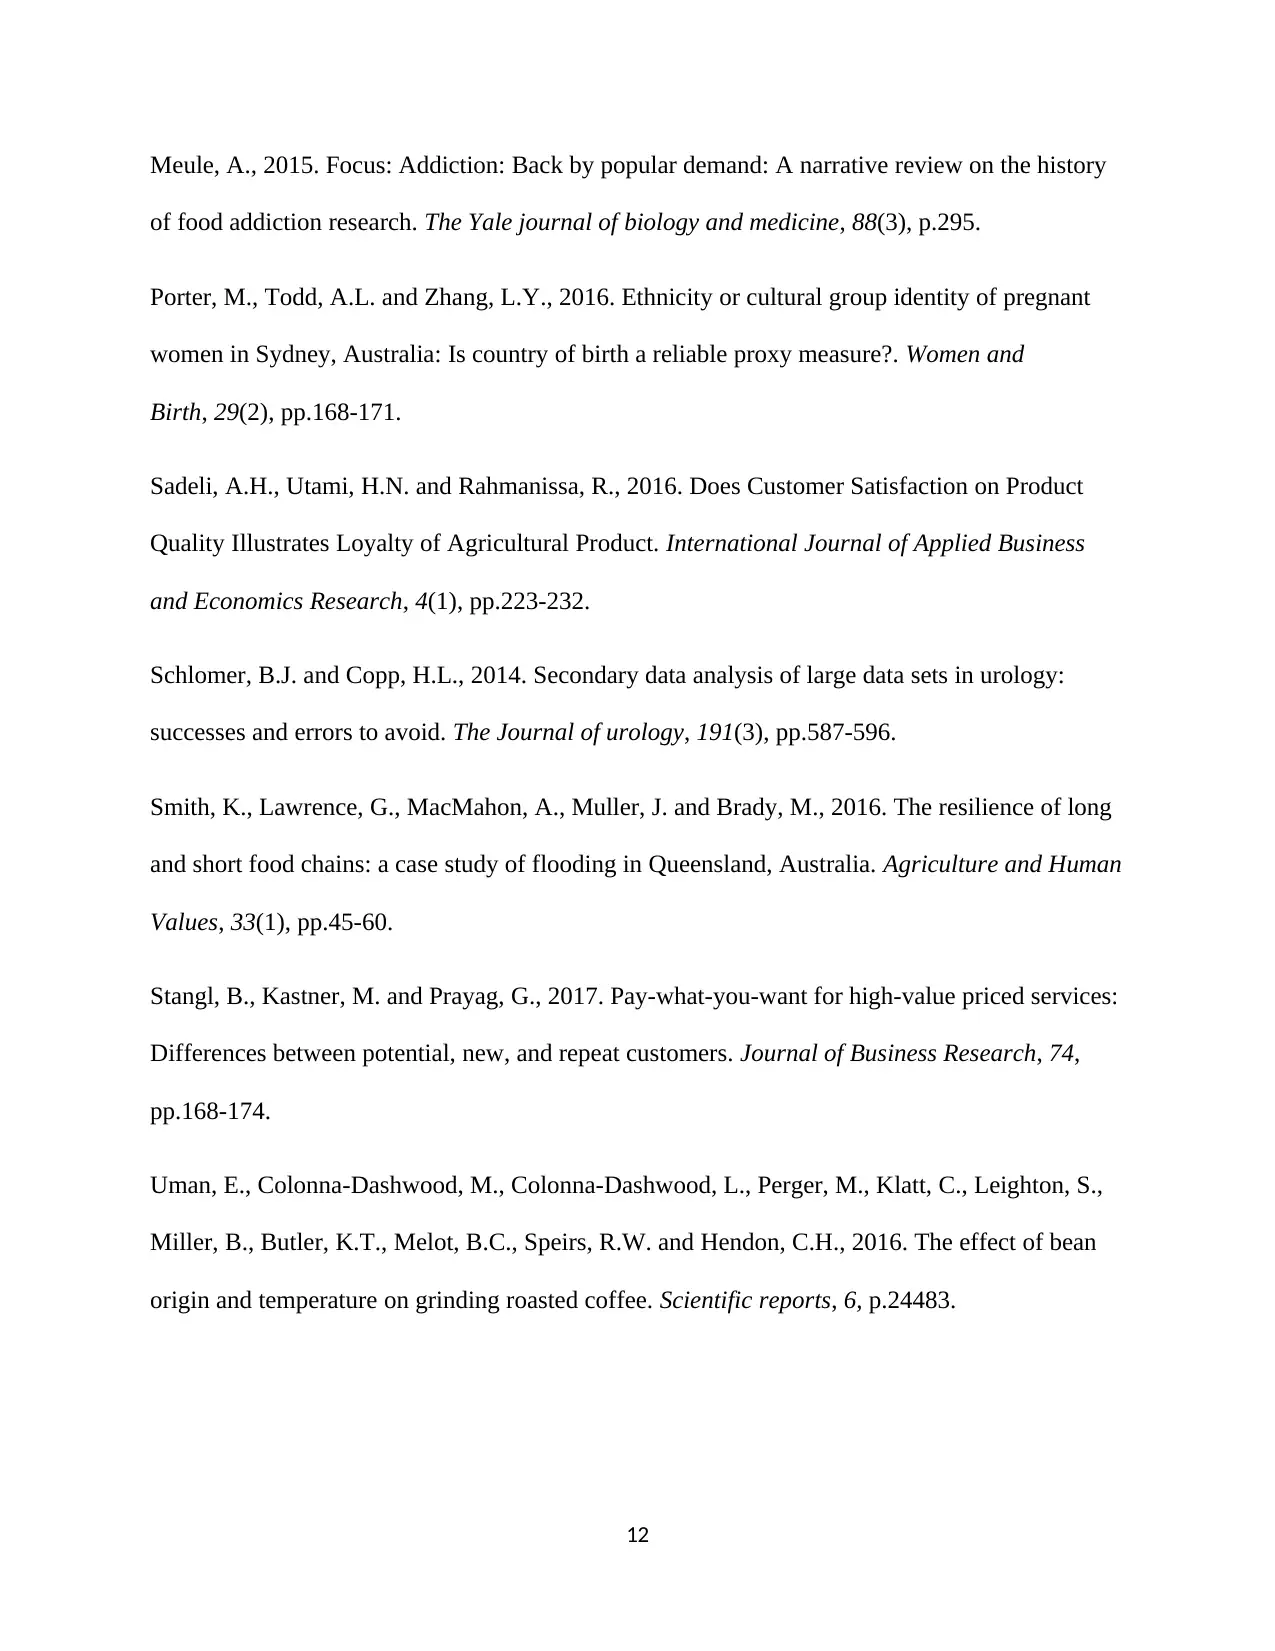
Figure 3: Number of families against number of children in Sydney
No
children One
child Two
children Three
children Four
children Five
children Six
children Not
stated
0
100,000
200,000
300,000
400,000
500,000
600,000
700,000
800,000
Number of families
Number of children
Number of families
The number of families in Sydney city with no children at the time of census were 674,818,
those families with one child were 257,973, families with two children were 498,957, families
6
the number of residents who were never married were 58,273, widowed were 20,381, separated
were 29,899, divorced were 81,055 and married residents were 341,052. In the age group of 65-
74 years, the number of residents who were never married were 25,917, those who were
separated were 23,524, widowed were 28,325, divorced were 53,715 and finally, married
residents in that age group were 239,643. In the age group of 75-84 years, the number of
residents who were never married were 10,328, divorced were 10,894, separated were 10,285,
widowed were 57,943 and the married ones were 112,462. The number of residents in the age
group of 85 years and above who were never married were 4,548, separated were 4,325, married
were 12,566 and widowed were 56,063.
Figure 3: Number of families against number of children in Sydney
No
children One
child Two
children Three
children Four
children Five
children Six
children Not
stated
0
100,000
200,000
300,000
400,000
500,000
600,000
700,000
800,000
Number of families
Number of children
Number of families
The number of families in Sydney city with no children at the time of census were 674,818,
those families with one child were 257,973, families with two children were 498,957, families
6
with three children were 262,085, those families in Sydney city with four children were 98,915,
families with five children in the city were 33,287, families with six children were found to be
26,436 and finally, the number of families that did not state the number of children they had
were 156,915.
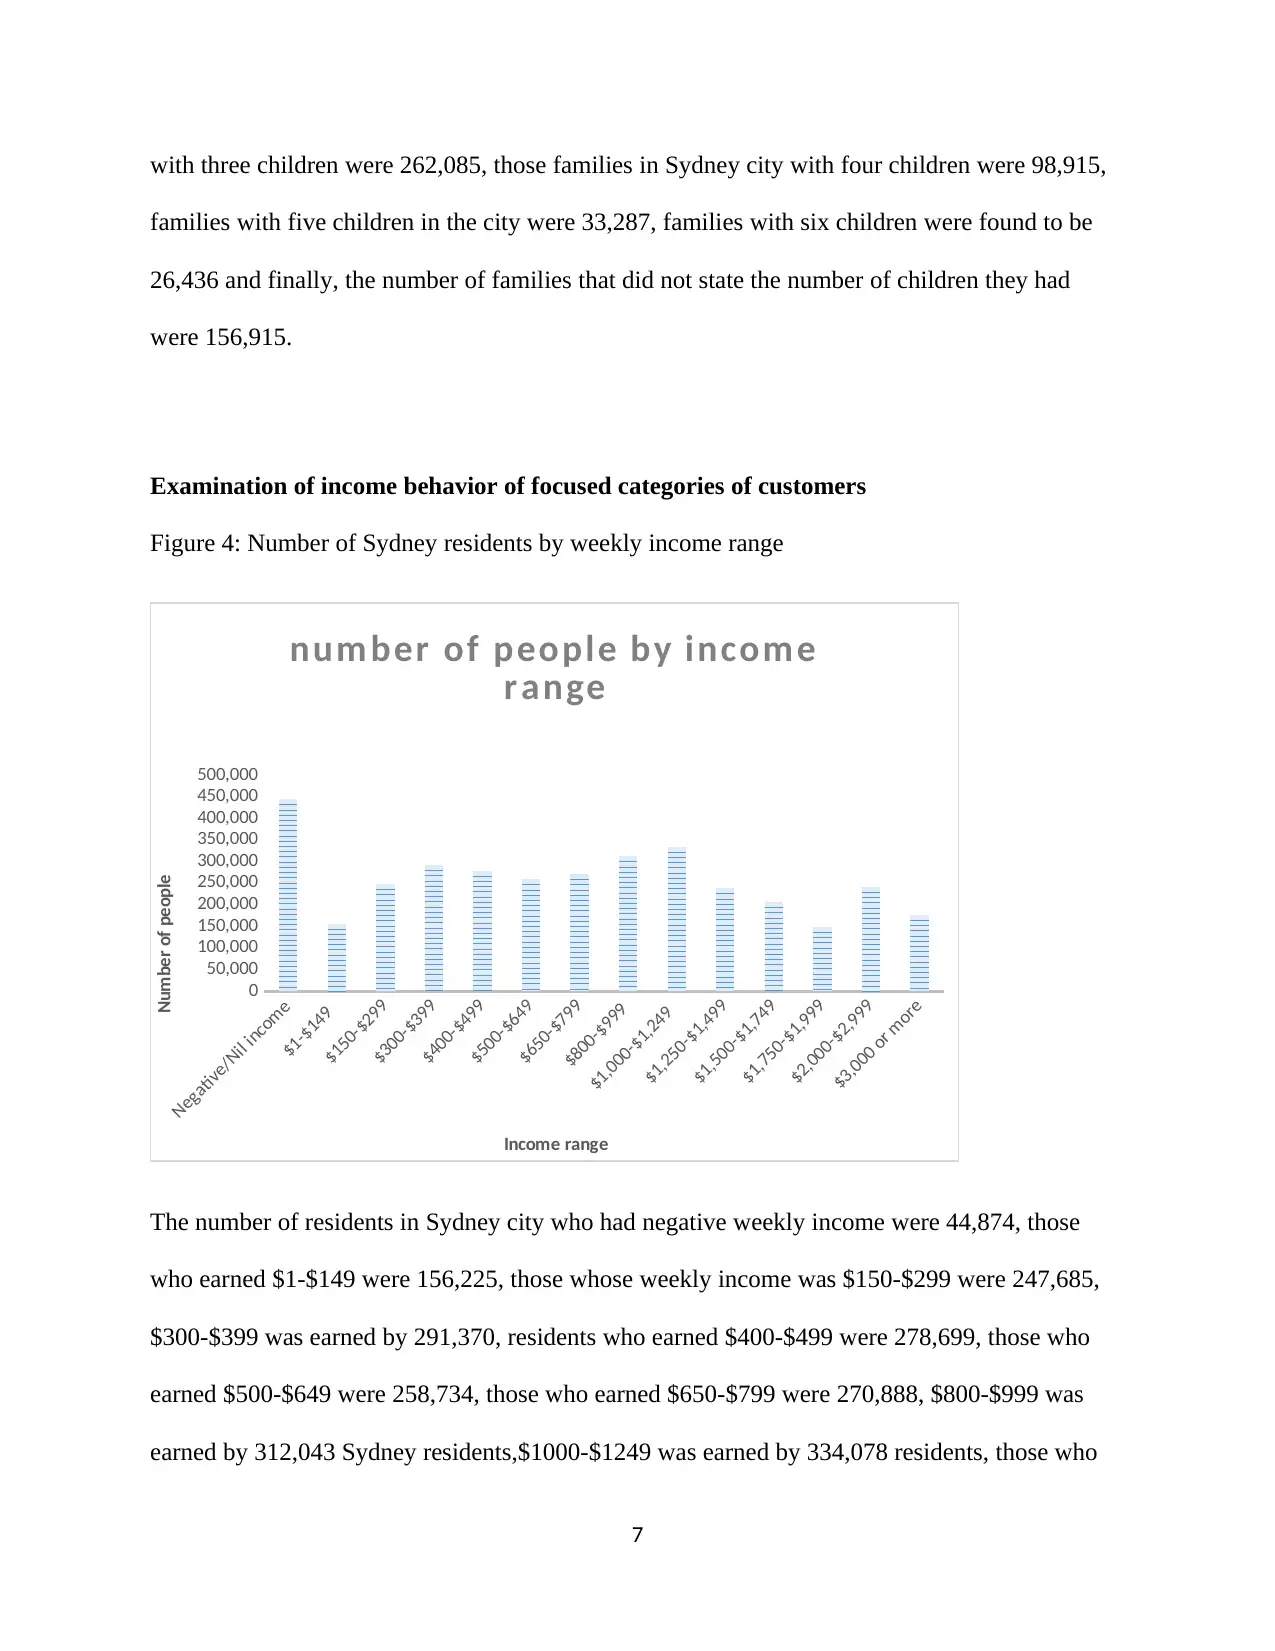
Examination of income behavior of focused categories of customers
Figure 4: Number of Sydney residents by weekly income range
Negative/Nil income
$1-$149
$150-$299
$300-$399
$400-$499
$500-$649
$650-$799
$800-$999
$1,000-$1,249
$1,250-$1,499
$1,500-$1,749
$1,750-$1,999
$2,000-$2,999
$3,000 or more
0
50,000
100,000
150,000
200,000
250,000
300,000
350,000
400,000
450,000
500,000
num ber of people by incom e
range
Income range
Number of people
The number of residents in Sydney city who had negative weekly income were 44,874, those
who earned $1-$149 were 156,225, those whose weekly income was $150-$299 were 247,685,
$300-$399 was earned by 291,370, residents who earned $400-$499 were 278,699, those who
earned $500-$649 were 258,734, those who earned $650-$799 were 270,888, $800-$999 was
earned by 312,043 Sydney residents,$1000-$1249 was earned by 334,078 residents, those who
7
families with five children in the city were 33,287, families with six children were found to be
26,436 and finally, the number of families that did not state the number of children they had
were 156,915.
Examination of income behavior of focused categories of customers
Figure 4: Number of Sydney residents by weekly income range
Negative/Nil income
$1-$149
$150-$299
$300-$399
$400-$499
$500-$649
$650-$799
$800-$999
$1,000-$1,249
$1,250-$1,499
$1,500-$1,749
$1,750-$1,999
$2,000-$2,999
$3,000 or more
0
50,000
100,000
150,000
200,000
250,000
300,000
350,000
400,000
450,000
500,000
num ber of people by incom e
range
Income range
Number of people
The number of residents in Sydney city who had negative weekly income were 44,874, those
who earned $1-$149 were 156,225, those whose weekly income was $150-$299 were 247,685,
$300-$399 was earned by 291,370, residents who earned $400-$499 were 278,699, those who
earned $500-$649 were 258,734, those who earned $650-$799 were 270,888, $800-$999 was
earned by 312,043 Sydney residents,$1000-$1249 was earned by 334,078 residents, those who
7
Secure Best Marks with AI Grader
Need help grading? Try our AI Grader for instant feedback on your assignments.
earned $1250-$1499 were 237,823, those who earned $1500-$1749 were 206,078, those who
earned $1750-$1999 were 148,798, those who earned $2000-$2999 were 241,007and finally
those Sydney residents who earned $3000 or more were 176,348.
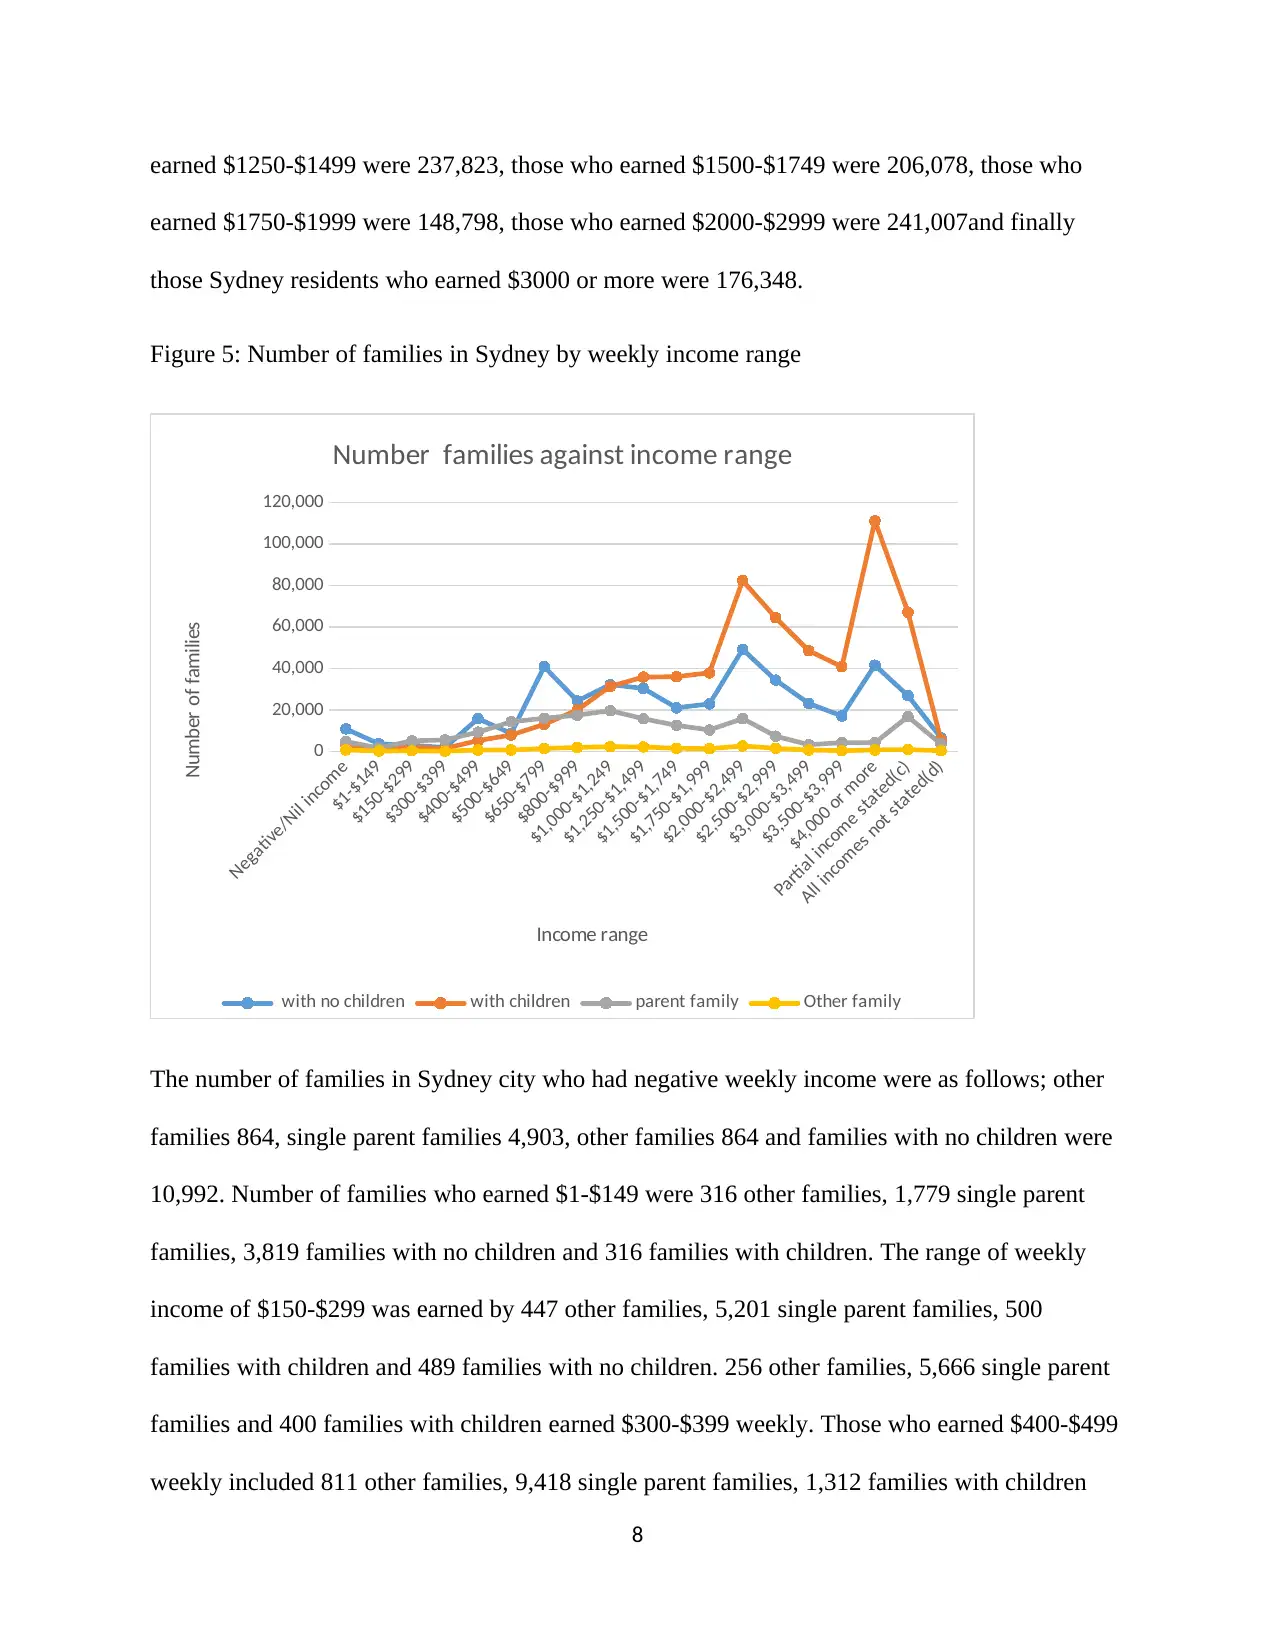
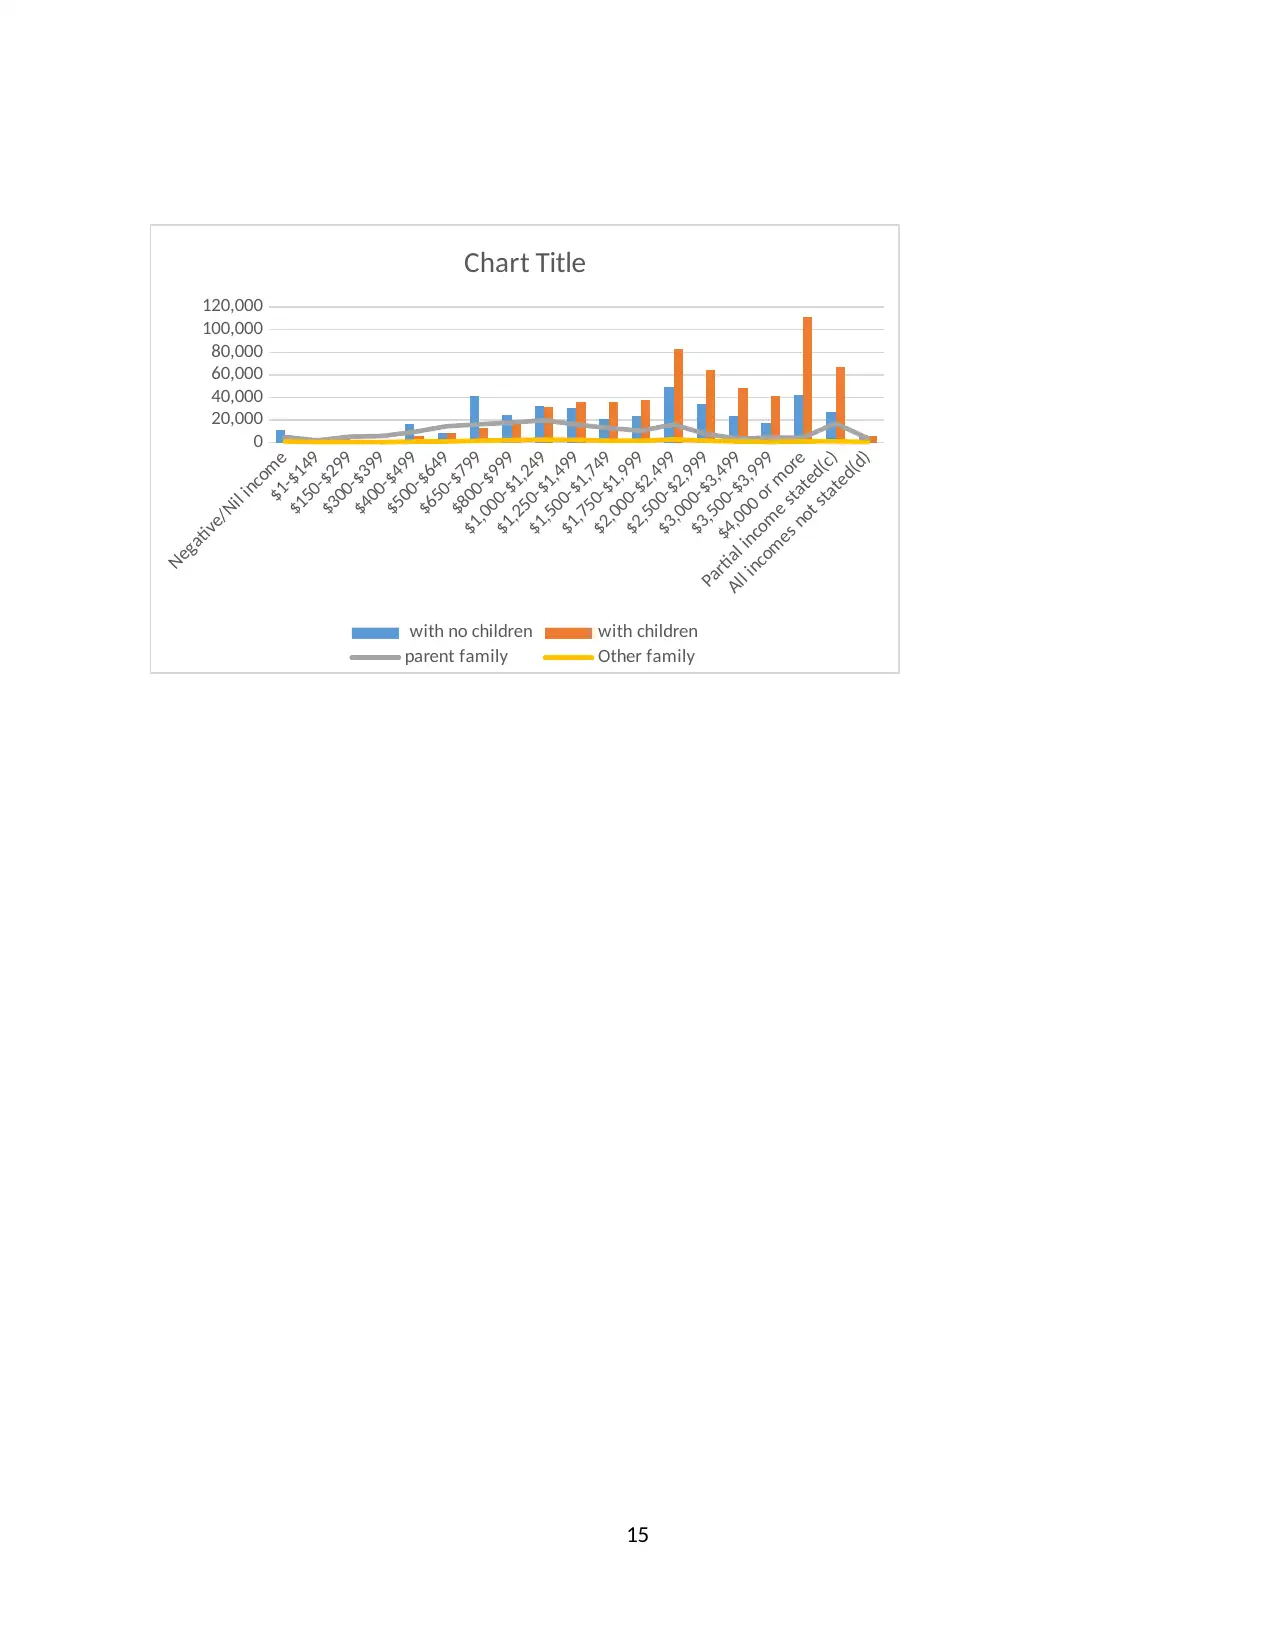
Figure 5: Number of families in Sydney by weekly income range
Negative/Nil income
$1-$149
$150-$299
$300-$399
$400-$499
$500-$649
$650-$799
$800-$999
$1,000-$1,249
$1,250-$1,499
$1,500-$1,749
$1,750-$1,999
$2,000-$2,499
$2,500-$2,999
$3,000-$3,499
$3,500-$3,999
$4,000 or more
Partial income stated(c)
All incomes not stated(d)
0
20,000
40,000
60,000
80,000
100,000
120,000
Number families against income range
with no children with children parent family Other family
Income range
Number of families
The number of families in Sydney city who had negative weekly income were as follows; other
families 864, single parent families 4,903, other families 864 and families with no children were
10,992. Number of families who earned $1-$149 were 316 other families, 1,779 single parent
families, 3,819 families with no children and 316 families with children. The range of weekly
income of $150-$299 was earned by 447 other families, 5,201 single parent families, 500
families with children and 489 families with no children. 256 other families, 5,666 single parent
families and 400 families with children earned $300-$399 weekly. Those who earned $400-$499
weekly included 811 other families, 9,418 single parent families, 1,312 families with children
8
earned $1750-$1999 were 148,798, those who earned $2000-$2999 were 241,007and finally
those Sydney residents who earned $3000 or more were 176,348.
Figure 5: Number of families in Sydney by weekly income range
Negative/Nil income
$1-$149
$150-$299
$300-$399
$400-$499
$500-$649
$650-$799
$800-$999
$1,000-$1,249
$1,250-$1,499
$1,500-$1,749
$1,750-$1,999
$2,000-$2,499
$2,500-$2,999
$3,000-$3,499
$3,500-$3,999
$4,000 or more
Partial income stated(c)
All incomes not stated(d)
0
20,000
40,000
60,000
80,000
100,000
120,000
Number families against income range
with no children with children parent family Other family
Income range
Number of families
The number of families in Sydney city who had negative weekly income were as follows; other
families 864, single parent families 4,903, other families 864 and families with no children were
10,992. Number of families who earned $1-$149 were 316 other families, 1,779 single parent
families, 3,819 families with no children and 316 families with children. The range of weekly
income of $150-$299 was earned by 447 other families, 5,201 single parent families, 500
families with children and 489 families with no children. 256 other families, 5,666 single parent
families and 400 families with children earned $300-$399 weekly. Those who earned $400-$499
weekly included 811 other families, 9,418 single parent families, 1,312 families with children
8
and 15,926 families with no children. $500-$649 was earned by 849 other families, 14,409 single
parent families, 8,047 families with children and 8,047 families that had no children. $1750-
$1999 was earned by 1500 other families, 10,428 single parent families, 23,052 families that had
no children and 37,973 families that had children. 111,231 families that had children, 41,712
families that had no children, 4,310 single parent families and 872 other families earned $4000
or more weekly.
Discussion
Majority of the residents were in the age range between 25 and 74 years. Being that the working
age ranged from 15 years and above, the number of potential customers was then seen to have
been high in North Sydney. The range of 25 to 34 years had the highest number of residents who
had never been married while the age range of between 35 and 44 years represented the highest
number of residents who were married as confirmed by the previous report (Porter et al, 2016).
The number of divorces increased with the age of the residents in the North Sydney with the
highest number recorded in the age range of 45 to 74 years and widowed increasing to the peak
at 85 years and over (Amato and Anthony, 2014). The increased number of divorces may have the
effect of reducing the number of potential customers around the city since they may end up
getting to different places far from the city. Even though a substantial number of families in the
city had no children, the largest proportion of the families in the city had between one to five
children. Increased number of families with children indicated the increased potential customers
and the new customers who would be buying supplied products in large quantities. Bulk buying
of products from the business results to increased sales thus optimum profits. Maximizing the
profit in the business is an indication of business expansion and growth thus adding value to the
9
development of the industry. The analysis therefore revealed the focused group to be entire
Sydney population.
The weekly income of the entire population was examined where the results revealed that not
large number of Sydney population earned nil income weekly. A large proportion of the
population earned at least $150 weekly. Being that they formed the targeted group of the coffee
business, their weekly income rate showed that they would manage to shop for coffee from the
coffee shop provided that other factors are kept constant. The income behavior of families in
Sydney also showed a good trend with large families earning at least $650 weekly.
Conclusion
To conclude from this report, the focused groups of customers was all types of families from
single parent families, families that had no children, families that had children, families that had
no children and other families since they all showed trend of weekly income. The weekly income
of the customers was attractive enough as the largest fraction of the Sydney population were
working and earning some weekly cash in return as indicated in the results.
10
Paraphrase This Document
Need a fresh take? Get an instant paraphrase of this document with our AI Paraphraser
References
Amato, P.R. and Anthony, C.J., 2014. Estimating the effects of parental divorce and death with
fixed effects models. Journal of Marriage and Family, 76(2), pp.370-386.
Baroh, I., Setiawan, B., Hanani, N. and Koestiono, D., 2014. Indonesian coffee competitiveness
in the international market: Review from the demand side. International Journal of Agriculture
Innovations and Research, 3(2), pp.605-609.
Biswas, W.K., 2014. Carbon footprint and embodied energy consumption assessment of building
construction works in Western Australia. International Journal of Sustainable Built
Environment, 3(2), pp.179-186.
Dijkman, R.M., Sprenkels, B., Peeters, T. and Janssen, A., 2015. Business models for the
Internet of Things. International Journal of Information Management, 35(6), pp.672-678.
Fan, S., Lau, R.Y. and Zhao, J.L., 2015. Demystifying big data analytics for business intelligence
through the lens of marketing mix. Big Data Research, 2(1), pp.28-32.
Johnston, M.P., 2017. Secondary data analysis: A method of which the time has
come. Qualitative and quantitative methods in libraries, 3(3), pp.619-626.
Kim, Y.J., Palakurthi, R. and Hancer, M., 2012. The environmentally friendly programs in hotels
and customers' intention to stay: An online survey approach. International journal of hospitality
& tourism administration, 13(3), pp.195-214.
Li, X., 2016. Emerging-market research: New bottles and new wine?. Journal of Travel
Research, 55(4), pp.419-426.
11
Meule, A., 2015. Focus: Addiction: Back by popular demand: A narrative review on the history
of food addiction research. The Yale journal of biology and medicine, 88(3), p.295.
Porter, M., Todd, A.L. and Zhang, L.Y., 2016. Ethnicity or cultural group identity of pregnant
women in Sydney, Australia: Is country of birth a reliable proxy measure?. Women and
Birth, 29(2), pp.168-171.
Sadeli, A.H., Utami, H.N. and Rahmanissa, R., 2016. Does Customer Satisfaction on Product
Quality Illustrates Loyalty of Agricultural Product. International Journal of Applied Business
and Economics Research, 4(1), pp.223-232.
Schlomer, B.J. and Copp, H.L., 2014. Secondary data analysis of large data sets in urology:
successes and errors to avoid. The Journal of urology, 191(3), pp.587-596.
Smith, K., Lawrence, G., MacMahon, A., Muller, J. and Brady, M., 2016. The resilience of long
and short food chains: a case study of flooding in Queensland, Australia. Agriculture and Human
Values, 33(1), pp.45-60.
Stangl, B., Kastner, M. and Prayag, G., 2017. Pay-what-you-want for high-value priced services:
Differences between potential, new, and repeat customers. Journal of Business Research, 74,
pp.168-174.
Uman, E., Colonna-Dashwood, M., Colonna-Dashwood, L., Perger, M., Klatt, C., Leighton, S.,
Miller, B., Butler, K.T., Melot, B.C., Speirs, R.W. and Hendon, C.H., 2016. The effect of bean
origin and temperature on grinding roasted coffee. Scientific reports, 6, p.24483.
12
Yang, S.H., Hu, W., Mupandawana, M. and Liu, Y., 2012. Consumer willingness to pay for fair
trade coffee: a Chinese case study. Journal of Agricultural and Applied Economics, 44(1), pp.21-
34.
Yarnold, P.R., 2015. Estimating inter-rater reliability using pooled data induces paradoxical
confounding: An example involving Emergency Severity Index triage ratings. Optimal Data
Analysis, 4, pp.21-23.
13
Secure Best Marks with AI Grader
Need help grading? Try our AI Grader for instant feedback on your assignments.
Appendices
15-19
years 20-24
years 25-34
years 35-44
years 45-54
years 55-64
years 65-74
years 75-84
years 85 years
and over
0
50,000
100,000
150,000
200,000
250,000
300,000
350,000
400,000
450,000
500,000
Marital status
Married Separated Divorced
Widowed Never Married
15-
19
years
20-
24
years
25-
29
years
30-
34
years
35-
39
years
40-
44
years
45-
49
years
50-
54
years
55-
59
years
60-
64
years
65-
69
years
70-
74
years
75-
79
years
80-
84
years
85
years
and
over
0
20,000
40,000
60,000
80,000
100,000
120,000
140,000
160,000
Number of families with children
against age groups
No children One child Two children Three children
Four children Five children Six children Not stated
14
Negative/Nil income
$1-$149
$150-$299
$300-$399
$400-$499
$500-$649
$650-$799
$800-$999
$1,000-$1,249
$1,250-$1,499
$1,500-$1,749
$1,750-$1,999
$2,000-$2,499
$2,500-$2,999
$3,000-$3,499
$3,500-$3,999
$4,000 or more
Partial income stated(c)
All incomes not stated(d)
0
20,000
40,000
60,000
80,000
100,000
120,000
Chart Title
with no children with children
parent family Other family
15
1 out of 18
Related Documents


Your All-in-One AI-Powered Toolkit for Academic Success.
+13062052269
info@desklib.com
Available 24*7 on WhatsApp / Email
![[object Object]](/_next/static/media/star-bottom.7253800d.svg)
Unlock your academic potential
© 2024 | Zucol Services PVT LTD | All rights reserved.