Numeracy and Data Analysis Report

Verified

Added on  2020/12/29

|9
|1343
|483
Report
AI Summary
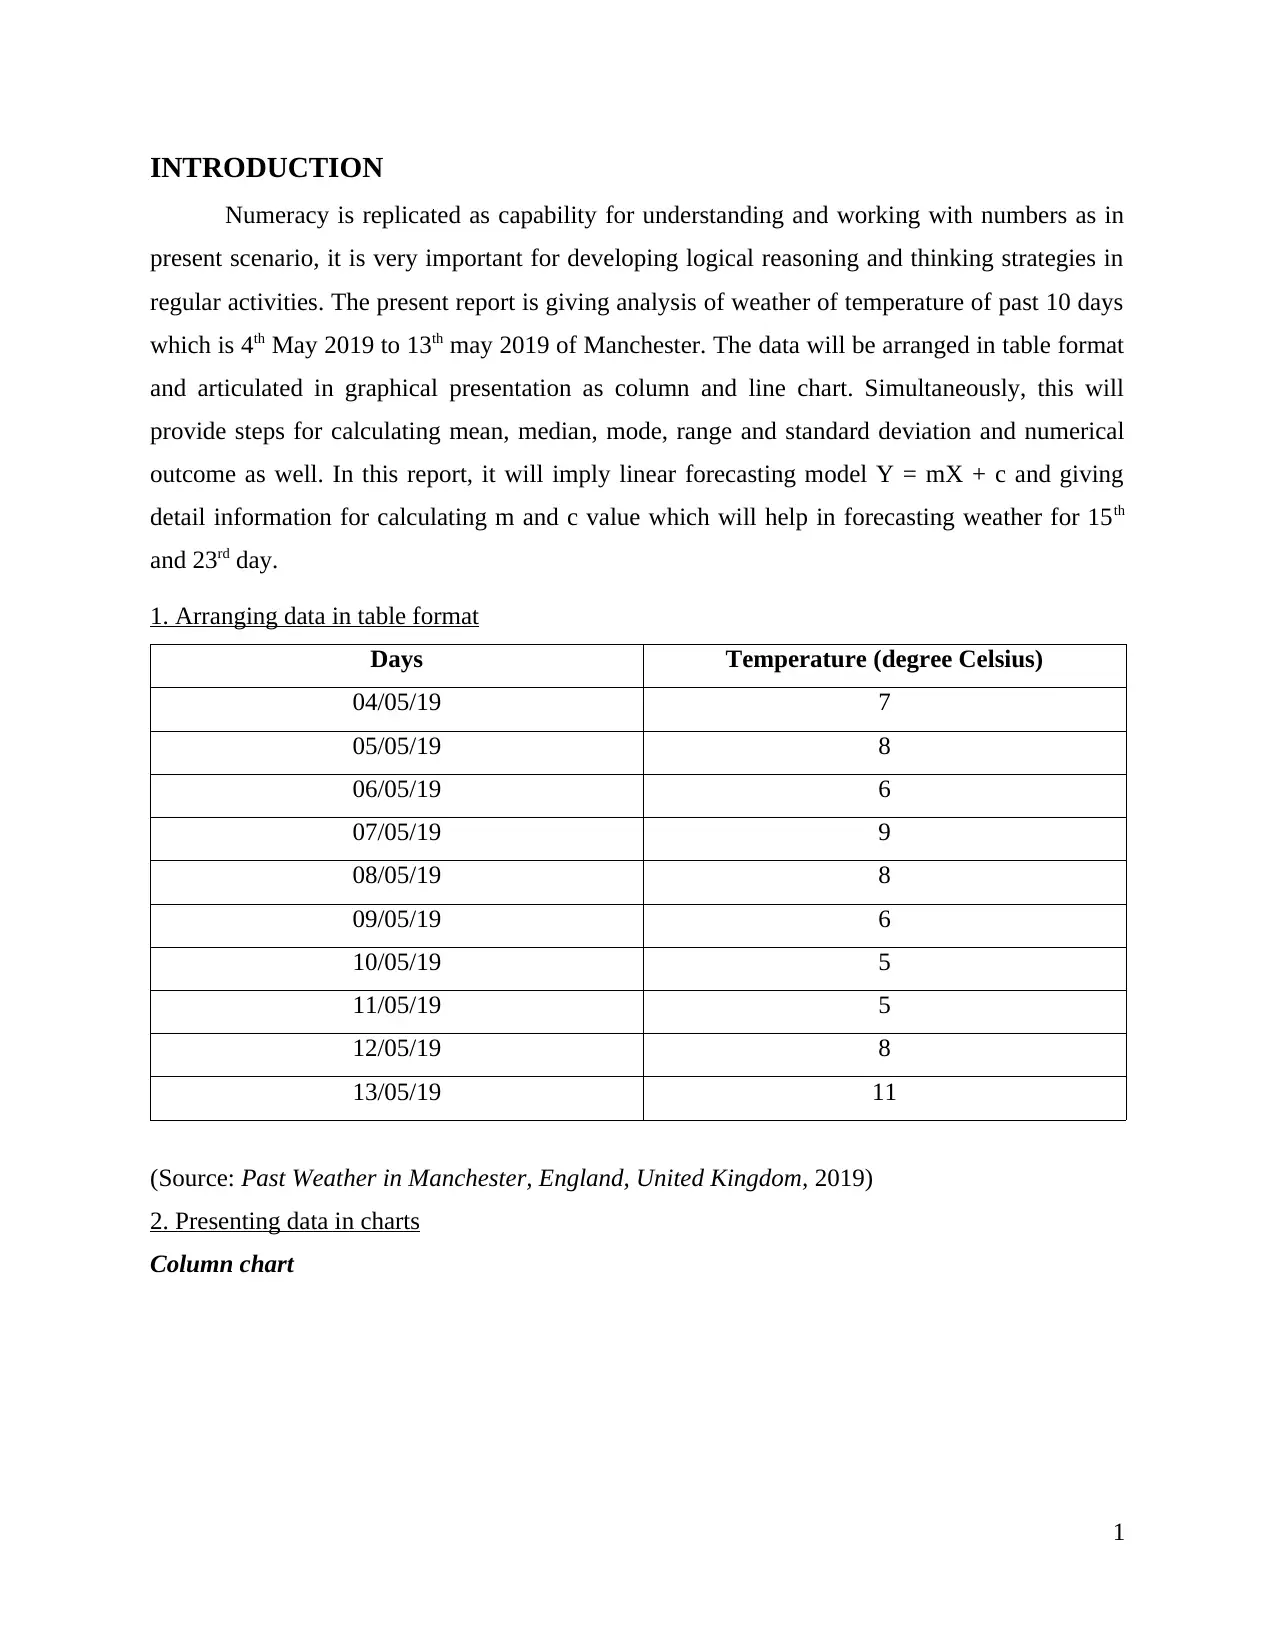
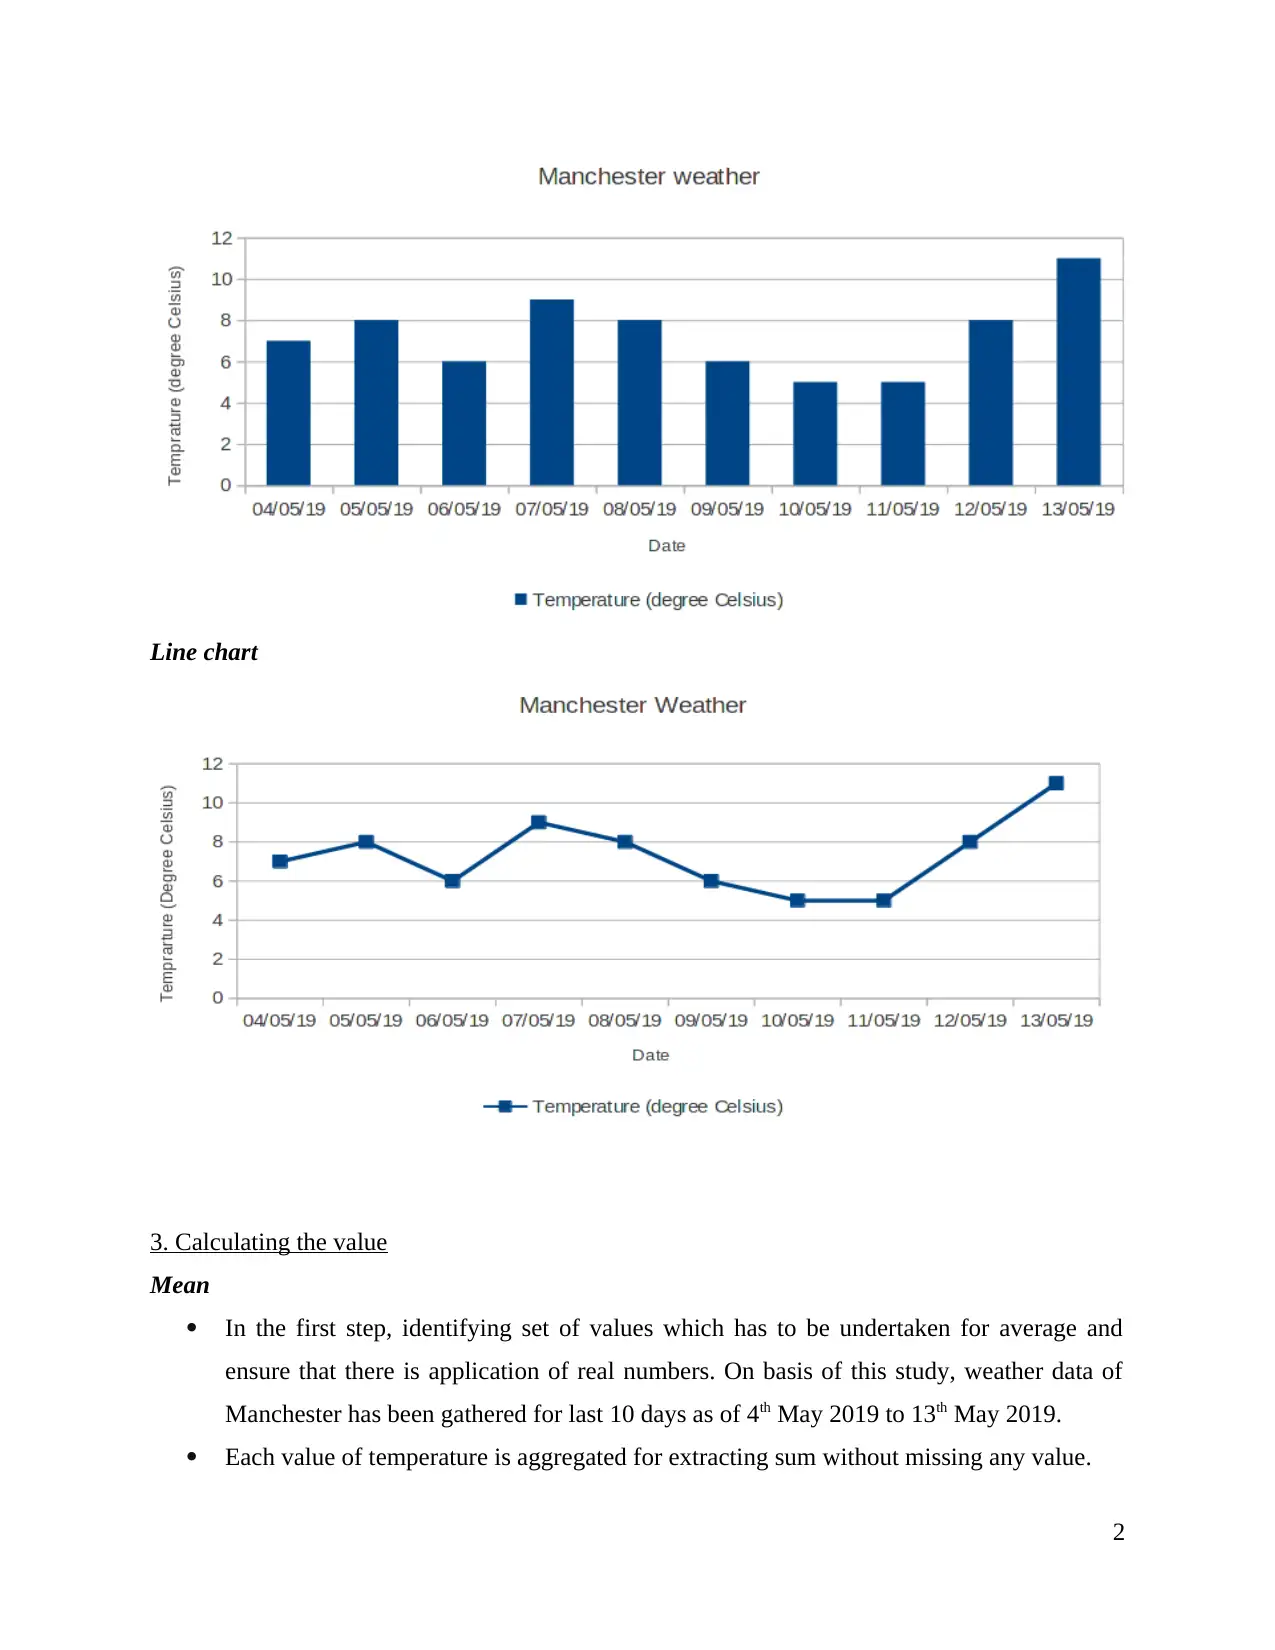
This report analyzes Manchester's weather data from May 4th to 13th, 2019, using descriptive statistics and a linear forecasting model to predict future temperatures.
tabler-icon-diamond-filled.svg

Contribute Materials

Your contribution can guide someone’s learning journey. Share your documents today.
Document Page
NUMERACY AND DATA
ANALYSIS
tabler-icon-diamond-filled.svg

Secure Best Marks with AI Grader

Need help grading? Try our AI Grader for instant feedback on your assignments.
Document Page
TABLE OF CONTENTS
INTRODUCTION...........................................................................................................................1
1. Arranging data in table format................................................................................................1
2. Presenting data in charts.........................................................................................................1
3. Calculating the value...............................................................................................................2
4. Using linear forecast model....................................................................................................4
Steps to calculate m value...........................................................................................................5
Steps to calculate c value............................................................................................................5
Forecast for day 15 and day 23...................................................................................................5
CONCLUSION................................................................................................................................5
REFERENCES................................................................................................................................7
Document Page
INTRODUCTION
Numeracy is replicated as capability for understanding and working with numbers as in
present scenario, it is very important for developing logical reasoning and thinking strategies in
regular activities. The present report is giving analysis of weather of temperature of past 10 days
which is 4th May 2019 to 13th may 2019 of Manchester. The data will be arranged in table format
and articulated in graphical presentation as column and line chart. Simultaneously, this will
provide steps for calculating mean, median, mode, range and standard deviation and numerical
outcome as well. In this report, it will imply linear forecasting model Y = mX + c and giving
detail information for calculating m and c value which will help in forecasting weather for 15th
and 23rd day.
1. Arranging data in table format
Days Temperature (degree Celsius)
04/05/19 7
05/05/19 8
06/05/19 6
07/05/19 9
08/05/19 8
09/05/19 6
10/05/19 5
11/05/19 5
12/05/19 8
13/05/19 11
(Source: Past Weather in Manchester, England, United Kingdom, 2019)
2. Presenting data in charts
Column chart
1
Document Page
Line chart
3. Calculating the value
Mean
In the first step, identifying set of values which has to be undertaken for average and
ensure that there is application of real numbers. On basis of this study, weather data of
Manchester has been gathered for last 10 days as of 4th May 2019 to 13th May 2019.
Each value of temperature is aggregated for extracting sum without missing any value.
2
tabler-icon-diamond-filled.svg

Secure Best Marks with AI Grader

Need help grading? Try our AI Grader for instant feedback on your assignments.
Document Page
The sum of set has been divided through number of the values as it is outcome as mean of
temperature.
Median
The initial step is to identify that data set is of even or odd numbers as in this it comprises
10 observations which are even set of numbers.
Further, sorting set of numbers through least to highest as it is even data set in which it
has exact two numbers in the middle.
The sum has been undertaken for middle two numbers and then divide by sum of two as
it format will be sum of 4 and 5 number is divided by 2 in this aspect. Thus, median of sequence with even data is not required to be a particular number of
sequence itself.
Mode
The beginning of this is done through writing numbers in particular data set within list of
numerical values.
The numbers must be ordered in ascending aspect (Kuys and et.al., 2019).
The important step is counting of numbers which are repeated or in simple terms, count
the number of times that every number is set is appeared.
Determining values which occur at often. The mode of data set must not be confused with median or mean as this is very important
for understanding differences in these topic.
Range
The first step is to list elements in ascending order to calculate particular range of
temperature dataset of Manchester.
It must determine the lowest and highest number as 1st and last number of above
ascending list. Subtracting the smallest number in temperature dataset from the largest and its outcome
is the range of the data set.
Standard deviation
This is continuous process after extracting mean of temperature data set.
It should extract variance of this sample as it shows that how far data is clustered
throughout the mean ans used for comparing distribution of the data set.
3
Document Page
The mean has been excluded with temperature of every day as it will provide figure that
how every data point differs through the mean.
The outcome of above step is squared which leads to every figure as positive.
Further, aggregate of squared numbers has been undertaken (McCarthy and et.al., 2019).
The aggregate of square numbers has been divided by n - 1 where n is number of
observations as here it is 10 – 1 as 9 which leads to variance outcome. To reach standard deviation, square root of variance has been undertaken for final result
as standard deviation.
Outcome
Particulars Amount
Mean 7.3
Median 7.5
Mode 8
Minimum 5
Maximum 11
Range 6
Standard deviation 1.89
The above table is showing descriptive statistics of temperature of past 10 days of
Weather whose average is 7.3 and mid value as 7.5 as it is measure of central tendency. The
modal value which is repeated majorly is 8 within range of 6 extracted from maximum and
minimum value. Thus, its standard deviation is 1.89 as spread of data is our sample.
4. Using linear forecast model
Days Days (x) Temperature (Y) XY X^2
04/05/19 1 7 7 1
05/05/19 2 8 16 4
06/05/19 3 6 18 9
07/05/19 4 9 36 16
08/05/19 5 8 40 25
09/05/19 6 6 36 36
4
Document Page
10/05/19 7 5 35 49
11/05/19 8 5 40 64
12/05/19 9 8 72 81
13/05/19 10 11 110 100
Total 55 73 410 385
Steps to calculate m value
Particulars Details
m NΣxy – Σx Σy / NΣ x^2 – (Σx)^2
(10 * 410) – (55 * 73) / (10 * 385) – (55)^2
(4100 – 4015)/ (3850 – 3025)
0.10
Steps to calculate c value
c Σy - m Σx / N
(73 – (0.10 * 55))/10
6.73
Forecast for day 15 and day 23
Forecast of 15th day
Y = mX + C
Y .10 (X) + 6.73
X 15
Y .10 (15) + 6.73
8.28
Forecast of 23rd day
Y = mX + C
Y .10 (23) + 6.73
5
tabler-icon-diamond-filled.svg

Paraphrase This Document

Need a fresh take? Get an instant paraphrase of this document with our AI Paraphraser
Document Page
X 23
Y .10 (23) + 6.73
9.10
CONCLUSION
On basis of above report, it has been concluded that numbers are very important for
analysing various things as it has shown weather analysis of Manchester with different aspect. It
has shown with help of undertaking tabular and graphical presentation which leads the positive
context of skills. Apart from this, it has undertaken support with help of descriptive statistics as
with average and many more parameters. However, it has reflected forecast of 15th and 23rd day
with use of linear model as 8.28 and 9.10 degree Celsius respectively.
6
Document Page
REFERENCES
Books and Journals
Kuys, S. S. and et.al., 2019. Steps, duration and intensity of usual walking practice during
subacute rehabilitation after stroke: an observational study. Brazilian journal of physical
therapy. 23(1). pp.56-61.
McCarthy, R. V. and et.al., 2019. What Do Descriptive Statistics Tell Us. In Applying Predictive
Analytics (pp. 57-87). Springer, Cham.
Online
Past Weather in Manchester, England, United Kingdom. 2019. [Online]. Available through
<https://www.timeanddate.com/weather/uk/manchester/historic>.
7
chevron_up_icon
1 out of 9
circle_padding
hide_on_mobile
zoom_out_icon
[object Object]

Your All-in-One AI-Powered Toolkit for Academic Success.

Available 24*7 on WhatsApp / Email

[object Object]