logo

Numeracy and Data Analysis

9 Pages1367 Words49 Views
   

Added on  2023-01-19

About This Document

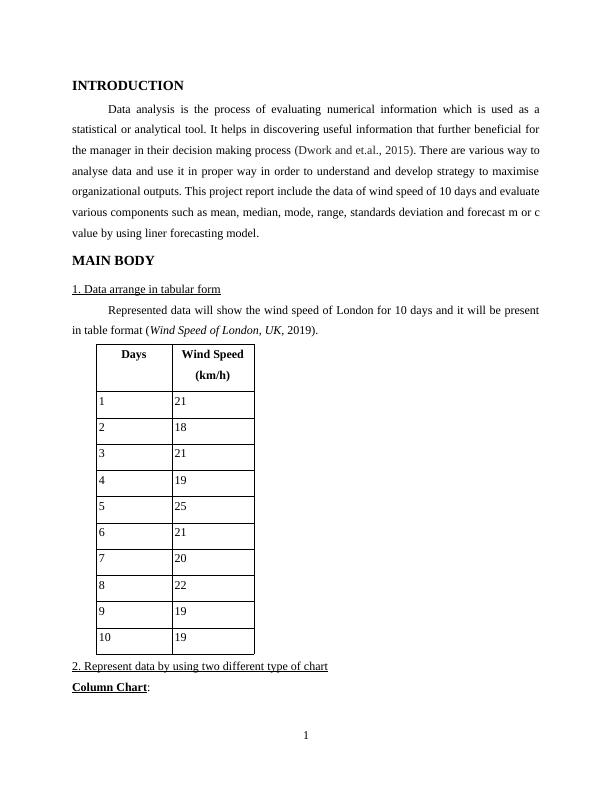
This project report includes data analysis of wind speed in London for 10 days. It covers topics such as arranging data in tabular form, representing data using different charts, calculating mean, median, mode, range, and standard deviation, and using linear forecasting model to evaluate m or c value.

Numeracy and Data Analysis

   Added on 2023-01-19

ShareRelated Documents
Numeracy and Data
Analysis
Numeracy and Data Analysis_1
Table of Contents
INTRODUCTION...........................................................................................................................1
MAIN BODY...................................................................................................................................1
1. Data arrange in tabular form....................................................................................................1
2. Represent data by using two different type of chart................................................................1
3. Calculate following values.......................................................................................................3
4. Use liner forecasting model and evaluate m or c value...........................................................5
CONCLUSION................................................................................................................................6
REFERENCES................................................................................................................................7
Numeracy and Data Analysis_2
INTRODUCTION
Data analysis is the process of evaluating numerical information which is used as a
statistical or analytical tool. It helps in discovering useful information that further beneficial for
the manager in their decision making process (Dwork and et.al., 2015). There are various way to
analyse data and use it in proper way in order to understand and develop strategy to maximise
organizational outputs. This project report include the data of wind speed of 10 days and evaluate
various components such as mean, median, mode, range, standards deviation and forecast m or c
value by using liner forecasting model.
MAIN BODY
1. Data arrange in tabular form
Represented data will show the wind speed of London for 10 days and it will be present
in table format (Wind Speed of London, UK, 2019).
Days Wind Speed
(km/h)
1 21
2 18
3 21
4 19
5 25
6 21
7 20
8 22
9 19
10 19
2. Represent data by using two different type of chart
Column Chart:
1
Numeracy and Data Analysis_3

End of preview

Want to access all the pages? Upload your documents or become a member.

Related Documents
Data Analysis – Assignment
|9
|1436
|43

(Solved) Assignment on Data Analysis
|9
|1425
|42

Numeracy and Data Analysis - Sample Assignment
|8
|1467
|32

Data Analysis Techniques: Assignment
|11
|1571
|57

Data Analysis Techniques Assignment
|11
|1611
|54

Data Analysis and Forecasting : Assignment
|10
|1446
|142