Numeracy and Data Analysis: Statistical Tools, Linear Forecasting Model

Verified

Added on  2023/06/17

|10
|1355
|410
AI Summary
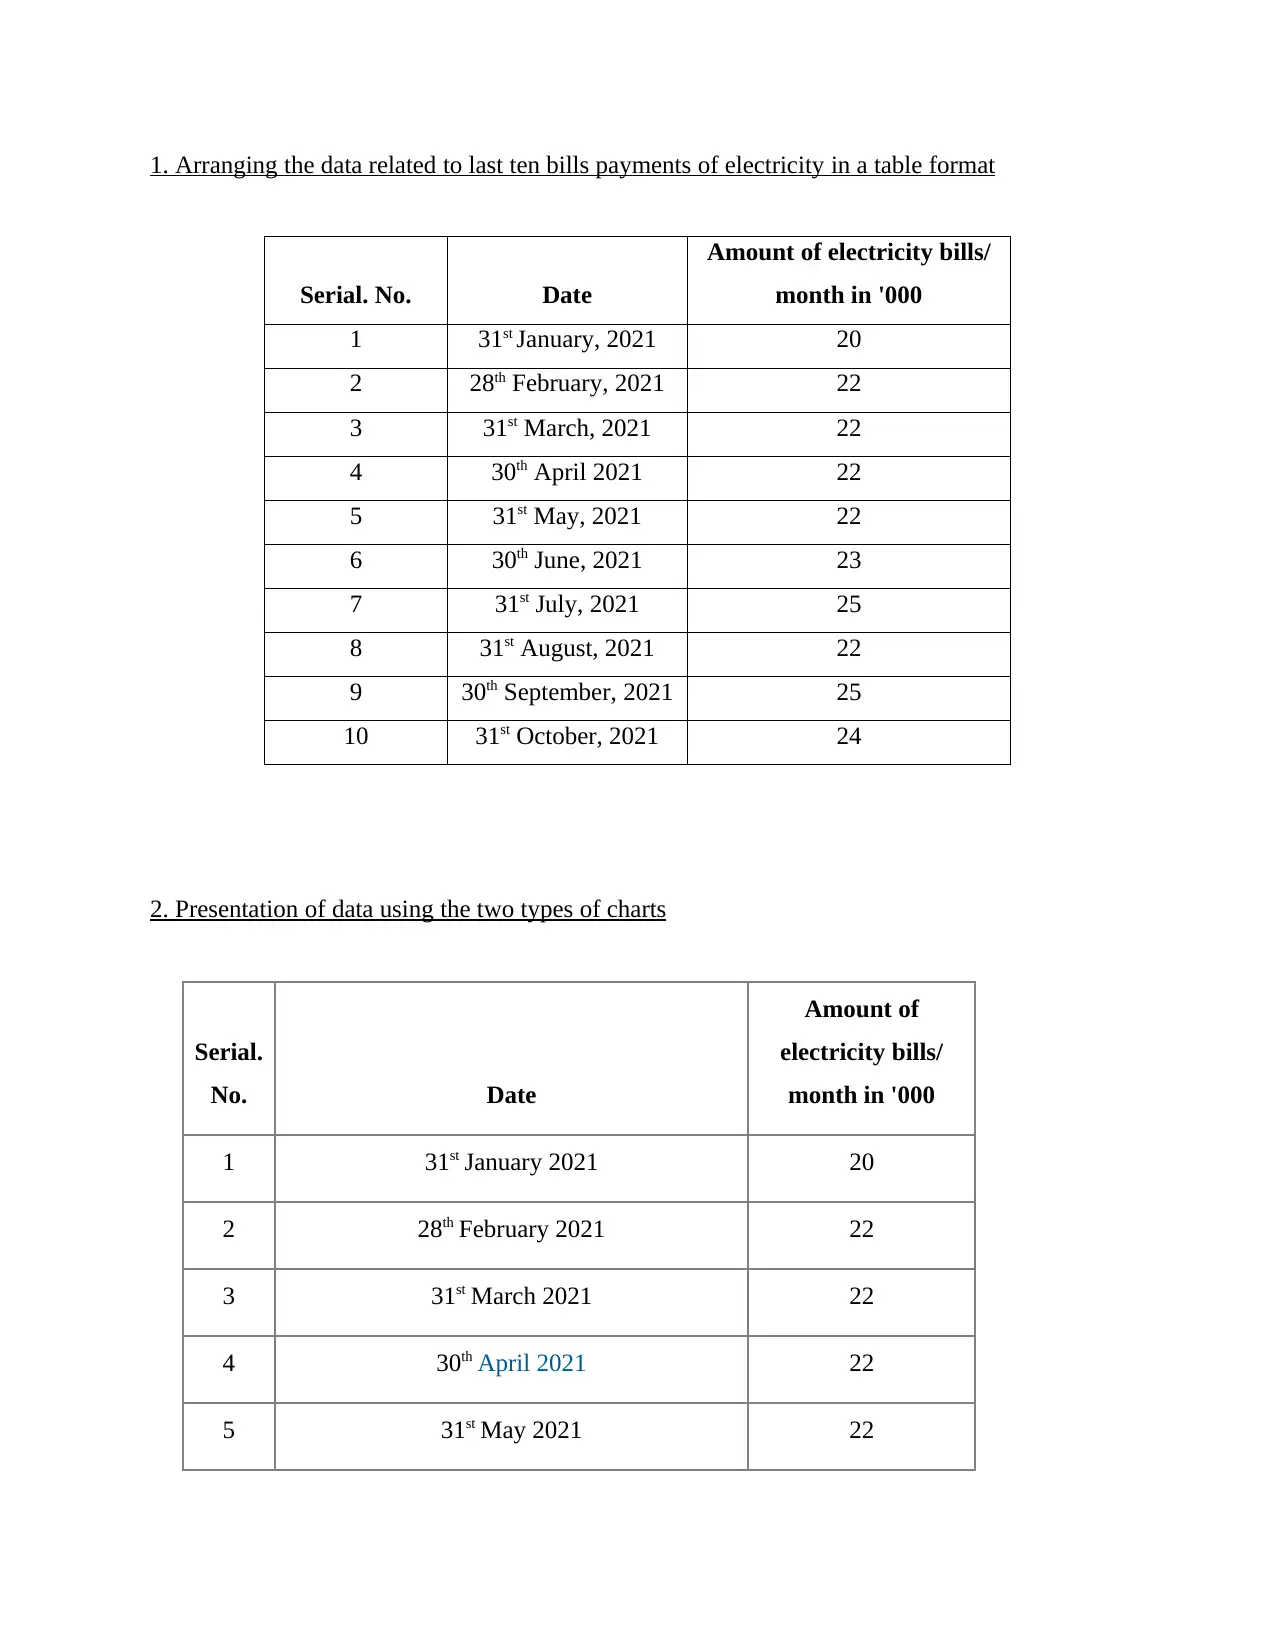
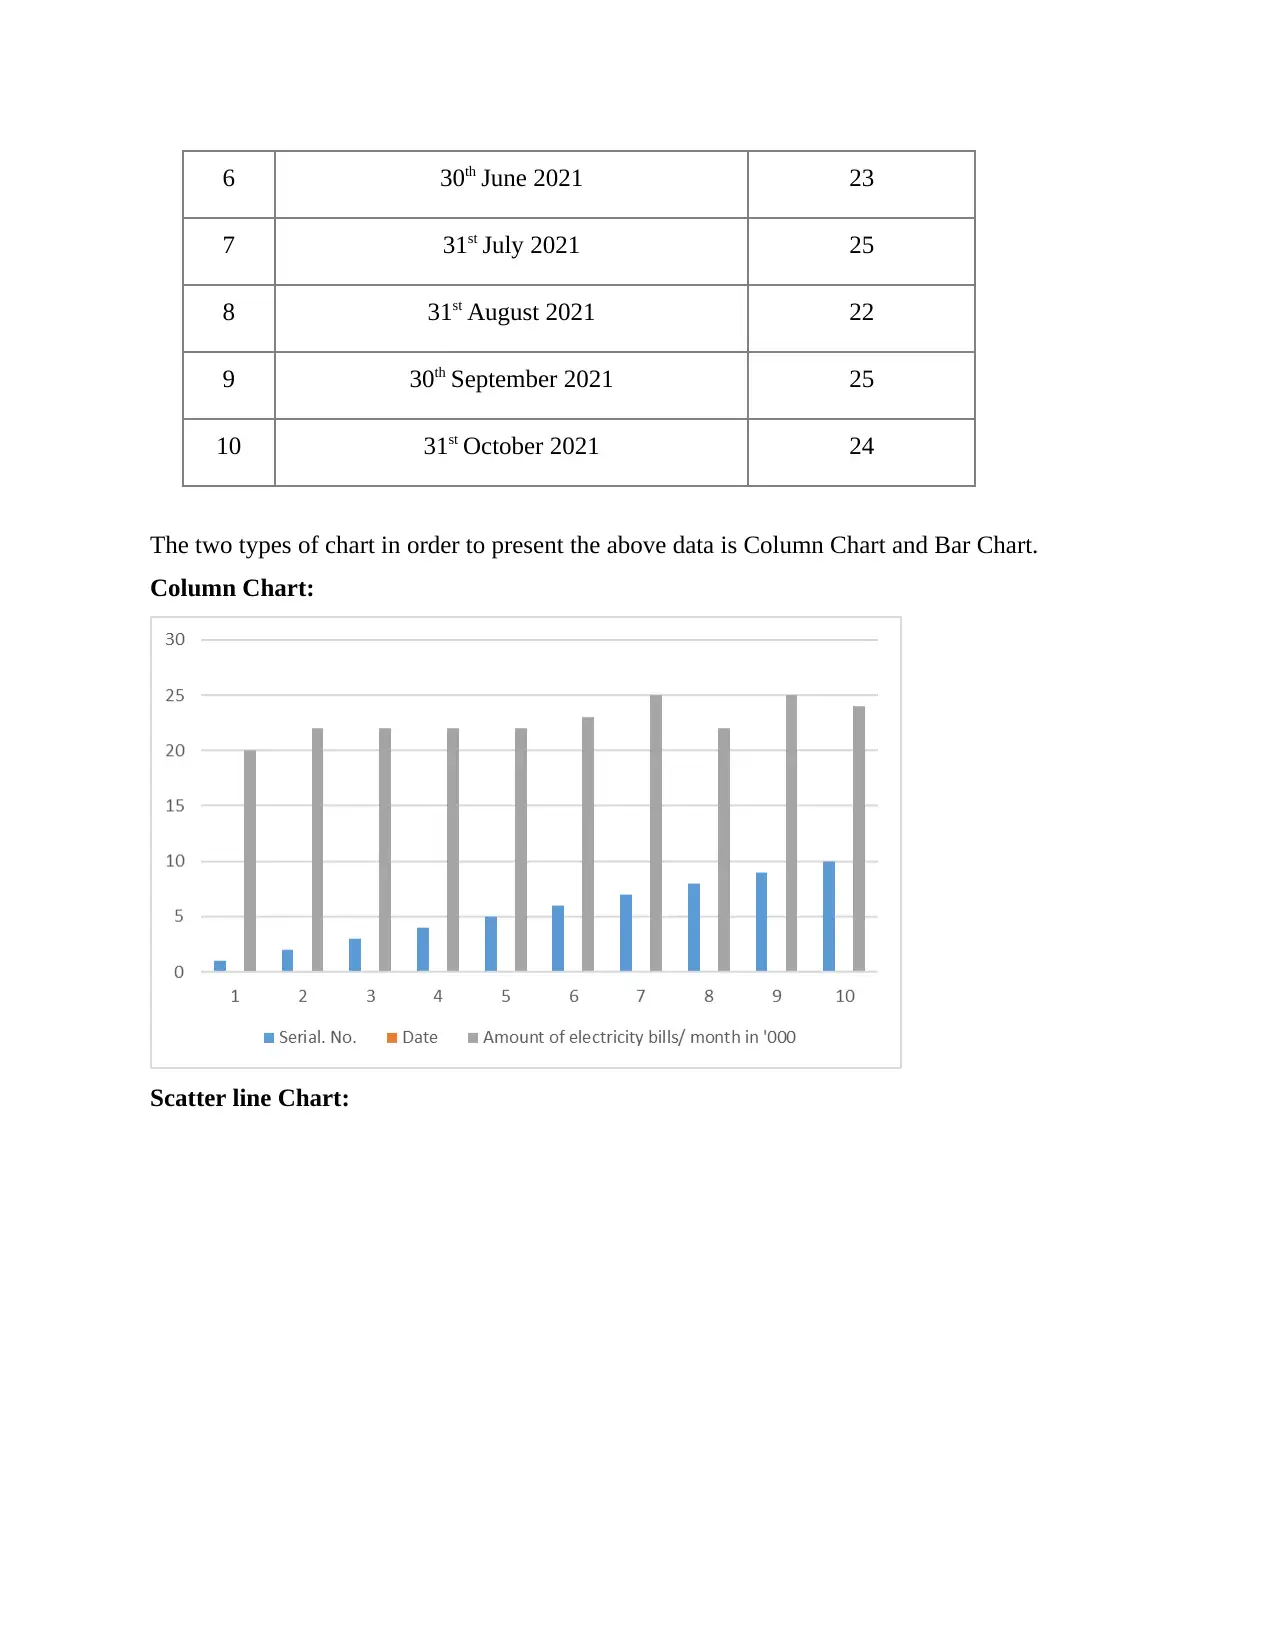
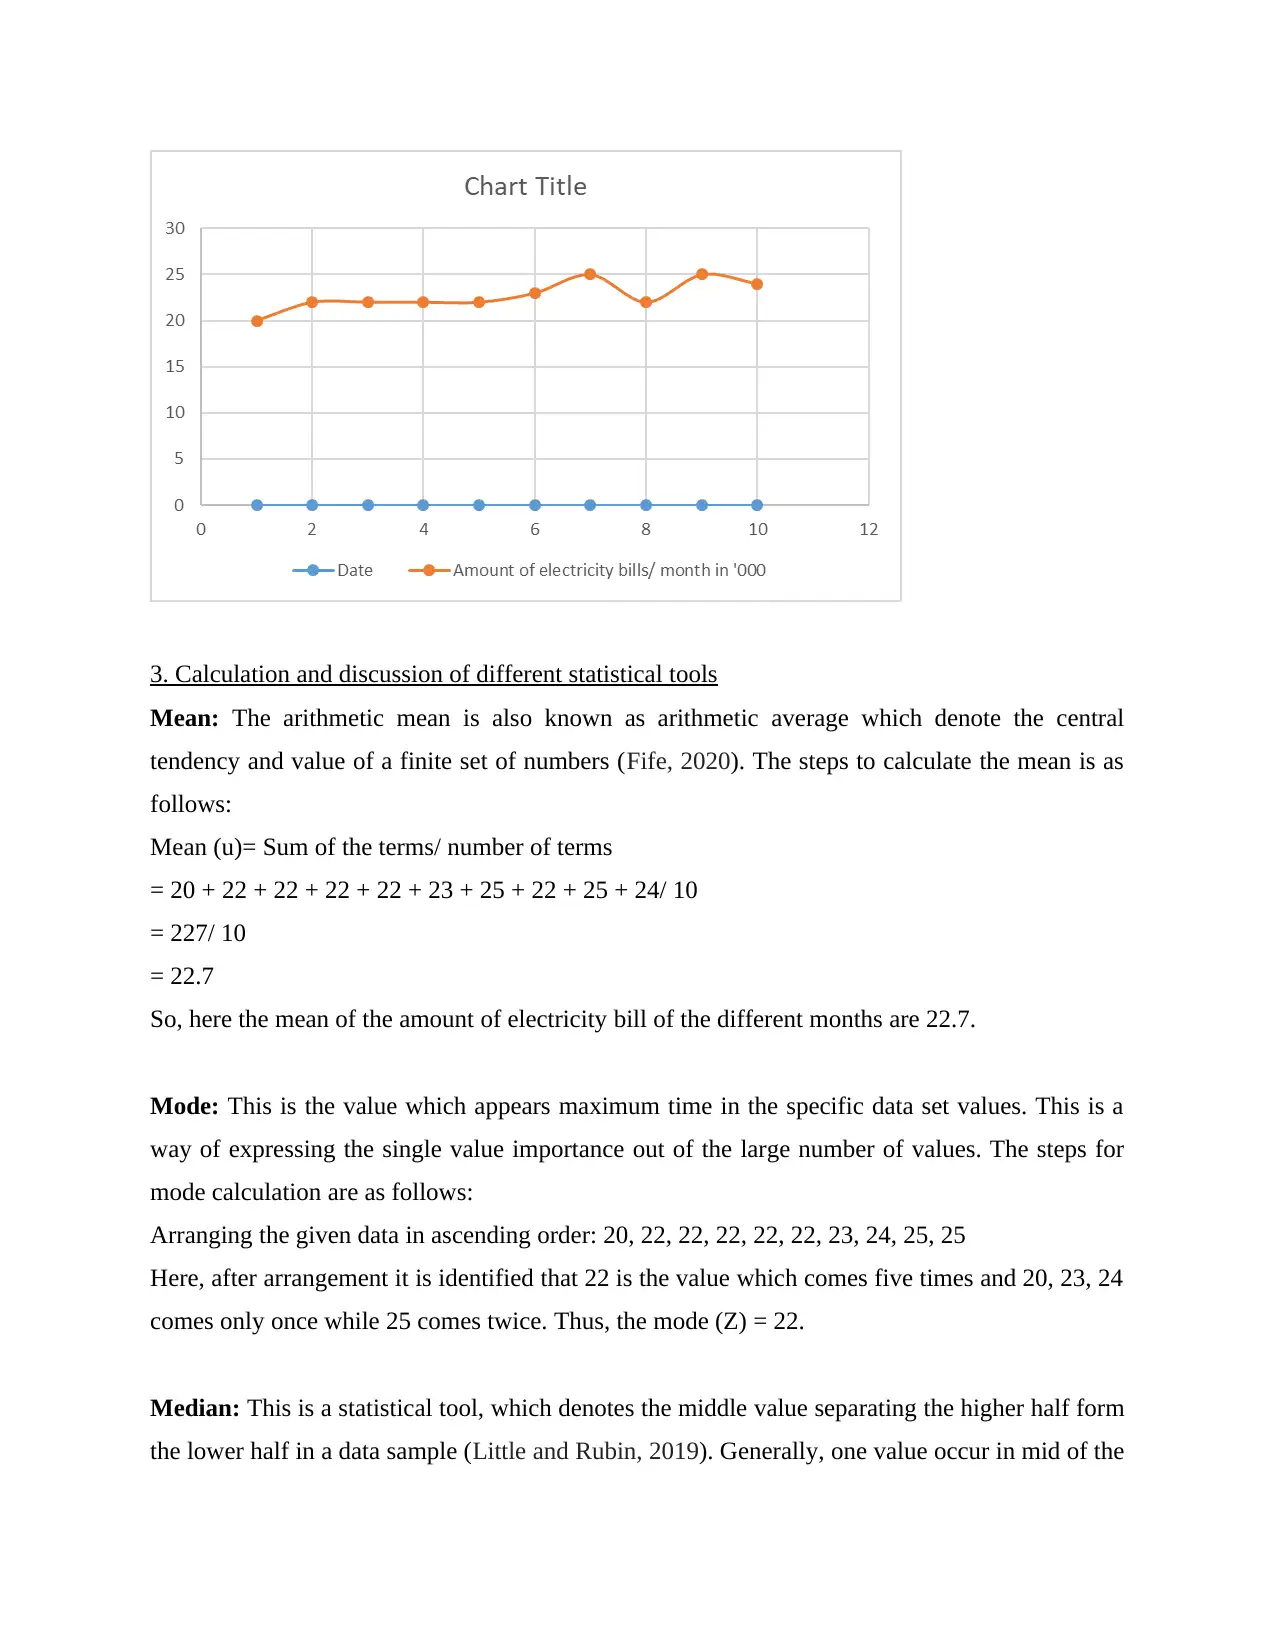
Learn about statistical tools and linear forecasting model in Numeracy and Data Analysis. Arranging data in table format, presentation using charts, calculation of mean, mode, median, range, and standard deviation.
tabler-icon-diamond-filled.svg

Contribute Materials

Your contribution can guide someone’s learning journey. Share your documents today.
Document Page
Numeracy and Data Analysis
tabler-icon-diamond-filled.svg

Secure Best Marks with AI Grader

Need help grading? Try our AI Grader for instant feedback on your assignments.
Document Page
Table of Contents
1. Arranging the data related to last ten bills payments of electricity in a table format..............4
2. Presentation of data using the two types of charts...................................................................4
3. Calculation and discussion of different statistical tools...........................................................6
4. Linear forecasting model.........................................................................................................8
REFERENCES................................................................................................................................1
Document Page
1. Arranging the data related to last ten bills payments of electricity in a table format
Serial. No. Date
Amount of electricity bills/
month in '000
1 31st January, 2021 20
2 28th February, 2021 22
3 31st March, 2021 22
4 30th April 2021 22
5 31st May, 2021 22
6 30th June, 2021 23
7 31st July, 2021 25
8 31st August, 2021 22
9 30th September, 2021 25
10 31st October, 2021 24
2. Presentation of data using the two types of charts
Serial.
No. Date
Amount of
electricity bills/
month in '000
1 31st January 2021 20
2 28th February 2021 22
3 31st March 2021 22
4 30th April 2021 22
5 31st May 2021 22
Document Page
6 30th June 2021 23
7 31st July 2021 25
8 31st August 2021 22
9 30th September 2021 25
10 31st October 2021 24
The two types of chart in order to present the above data is Column Chart and Bar Chart.
Column Chart:
Scatter line Chart:
tabler-icon-diamond-filled.svg

Secure Best Marks with AI Grader

Need help grading? Try our AI Grader for instant feedback on your assignments.
Document Page
3. Calculation and discussion of different statistical tools
Mean: The arithmetic mean is also known as arithmetic average which denote the central
tendency and value of a finite set of numbers (Fife, 2020). The steps to calculate the mean is as
follows:
Mean (u)= Sum of the terms/ number of terms
= 20 + 22 + 22 + 22 + 22 + 23 + 25 + 22 + 25 + 24/ 10
= 227/ 10
= 22.7
So, here the mean of the amount of electricity bill of the different months are 22.7.
Mode: This is the value which appears maximum time in the specific data set values. This is a
way of expressing the single value importance out of the large number of values. The steps for
mode calculation are as follows:
Arranging the given data in ascending order: 20, 22, 22, 22, 22, 22, 23, 24, 25, 25
Here, after arrangement it is identified that 22 is the value which comes five times and 20, 23, 24
comes only once while 25 comes twice. Thus, the mode (Z) = 22.
Median: This is a statistical tool, which denotes the middle value separating the higher half form
the lower half in a data sample (Little and Rubin, 2019). Generally, one value occur in mid of the
Document Page
sample data is considered as median but in case when more than one value is occurred in mid
them the formula is used = Sum of middle value/ number of term.
In the given data set, the middle value is two i.e., 22 and 23 so the median is = 22 + 23/ 2 = 22.5
which exist in between the 22 value and 23 value.
Range: This is a value which arises because of the difference between the upper limit and lower
limit on a particular scale (Crowder and et.al., 2017). The formula of Range is as follows:
Range = Upper Value – Lower Value = 25 – 20 = 5.
So, the range of present dataset i.e., bill payment is 5.
Standard deviation: This statistical tool is helpful in measuring how much the values in a series
of data are deviating from the average of the data series (Ranganathan Pramesh and Aggarwal,
2017). It is symbolizes as σ. It is the square root of average derived through squaring differences
of individual value from mean. The steps for calculating standard deviation are as follows:
Finding out the mean of the numbers in the given series of data.
Subtracting each numbers from the average or mean of the series and squaring out the
results obtained.
Then finding out the average of the squared differences and also the square root of the
result obtained at this step.
The formula for calculating standard deviation is as follows:
σ =
Serial. No. Date
Amount of electricity bills/
month in '000 x X – Mean (x-mean)2
1 31st January, 2021 20 -2.7 7.29
2
28th February,
2021 22 -0.7 0.49
3 31st March, 2021 22 -0.7 0.49
Document Page
4 30th April 2021 22 -0.7 0.49
5 31st May, 2021 22 -0.7 0.49
6 30th June, 2021 23 0.3 0.09
7 31st July, 2021 25 2.3 5.29
8 31st August, 2021 22 -0.7 0.49
9
30th September,
2021 25 2.3 5.29
10
31st October,
2021 24 1.3 1.69
Mean 22.7 22.1
σ = √ 22.1 / 10 = 1.4866
4. Linear forecasting model
Y = mx + c
Serial. No.
X Date
Amount of electricity bills/ month in '000
Y xy x2
1
31st January,
2021 20 20 1
2
28th February,
2021 22 44 4
3 31st March, 2021 22 66 9
4 30th April 2021 22 88 16
5 31st May, 2021 22 110 25
6 30th June, 2021 23 138 36
7 31st July, 2021 25 175 49
8 31st August, 2021 22 176 64
9
30th September,
2021 25 225 81
10 31st October, 24 240 100
tabler-icon-diamond-filled.svg

Paraphrase This Document

Need a fresh take? Get an instant paraphrase of this document with our AI Paraphraser
Document Page
2021
55 227 1282 385
i) Calculating the value of m
m =
m = (10 * 1282) – (55 * 227) / (10 * 385) – (55)2
m = 12820 – 12485 / 3850 – 3025
m = 335 / 825 = 0.41
ii) Calculating the value of c
c =
c = 227 – (0.41 * 55) / 10
c = 227 – 22.55 / 10
c = 20.445
iii)
In order to forecast the bill payment (expenses) for the 12th and 14th day, the equation y = mx + c
is need to be used.
Expected bill payment on 12th day = y = mx + c
Here, m = 0.41
x = 12
c = 20.445
y = 0.41 (12) + 20.445
= 4.92 + 20.445
= 25.365
Expected bill payment on 14th month will be as follows:
x = 14
y = mx +c
y = 0.41 * 14 + 20.445
y = 5.74 + 20.445 = 26.185
Document Page
Document Page
REFERENCES
Books and journals
Ranganathan, P., Pramesh, C. S. and Aggarwal, R., 2017. Common pitfalls in statistical analysis:
logistic regression. Perspectives in clinical research, 8(3), p.148.
Crowder, M. J., and et.al., 2017. Statistical analysis of reliability data. Routledge.
Little, R. J. and Rubin, D. B., 2019. Statistical analysis with missing data (Vol. 793). John Wiley
& Sons.
Fife, D., 2020. The eight steps of data analysis: A graphical framework to promote sound
statistical analysis. Perspectives on Psychological Science, 15(4), pp.1054-1075.
Aggarwal, R. and Ranganathan, P., 2017. Common pitfalls in statistical analysis: Linear
regression analysis. Perspectives in clinical research, 8(2), p.100.
Han, Y. and Lahiri, P., 2019. Statistical analysis with linked data. International Statistical
Review, 87, pp.S139-S157.
1
chevron_up_icon
1 out of 10
circle_padding
hide_on_mobile
zoom_out_icon
[object Object]

Your All-in-One AI-Powered Toolkit for Academic Success.

Available 24*7 on WhatsApp / Email

[object Object]