Efficient Portfolio Management: Impact on Investors and Financial Market
VerifiedAdded on 2023/04/22
|18
|2516
|198
AI Summary
This report analyzes the impact of efficient portfolio management on investors and the financial market. It discusses the concept of efficient frontier, Harry Markowitz and William Sharpe models, and the use of trend lines and separation property in portfolio construction. The report also evaluates the performance of optimal portfolios using Sharpe ratio and compares the Markowitz and Sharpe models.
Contribute Materials
Your contribution can guide someone’s learning journey. Share your
documents today.

Finance portfolio management
1
1
Secure Best Marks with AI Grader
Need help grading? Try our AI Grader for instant feedback on your assignments.

Introduction
The efficient portfolio offers various benefits to the investors and also the financial market.
Selection of optimal portfolio offers the maximum return to the investors and also helps them to
diversify or set off the risk with other security return. This report will represent that how optimal
portfolio impact positively to the investors and also states that how efficient portfolio frontier
provides an expected return. This report also states that Harry Markowitz and William Sharpe
model helps to the investor in measuring the performance of optimal portfolio and also helps in
creating the optimal portfolio for the future growth and development of an investor in various
manners.
2

Analysis of an efficient portfolio in Australia
A selection of an efficient portfolio provides a source of income to the investors. The process of
selection a portfolio may be divided into two parts. The first part commences with experience
and observation and completes with beliefs about the future performances of available securities.
The second part commences with the appropriate beliefs about future performances and
completes with the optimal selection of portfolio. The investors can use various techniques of
portfolio selection to measure the expected returns and level of risk (Pavlou, Doumpos, &
Zopounidis, 2018).
Efficient Frontier
The efficient frontier is the set of ideal or optimal portfolios which provides maximum expected
return to the investors with defined level of risk. This concept is basically introduced by “Harry
Markowitz” and it is easily to understand. Efficient frontier is a graphical representation of all
optimal securities. It is basically shows the risk and returns trade- off of a portfolio and help to
the investors in imagine the efficient portfolios (Chandra, 2017).
Harry Markowitz’s modern portfolio theory described efficient frontier in an appropriate manner.
Efficient portfolio frontier is related to the Markowitz’s portfolio theory which are discussed
below and represented in a diagram.
3

Figure 1: Efficient Frontier
By Author, 2019
The above graph shows all the results of various portfolio combinations of risky assets. In the
graph standard deviation is lie on the X-axis and return is lie on the Y-axis.
Tangency Portfolio is the point where the portfolio of only risk- free securities meets the
combination of risky securities.
The Capital allocation line or straight line shows a portfolio of all the risk-free securities and
risky securities, which is generally a government bond.
Lower section of the hyperbole of portfolio will have poor return and ultimately maximum risk
to the investors. Portfolios to the right will have maximum returns but also maximum risk.
Markowitz Portfolio Concept is the base idea of the “Ways to Wealth Concept”
Efficient portfolio importance for the last two decades in Australia
An efficient portfolio helps to the investors to earn more return from the market. The purpose of
efficient frontier is to maximize returns while minimizing volatility. A risk-opposed investor’s
aim is to find out the combination of investment which harvests the maximum return with little
bit risk which is affordable by him. The efficient frontier plot portfolio that gives the identical
4
Secure Best Marks with AI Grader
Need help grading? Try our AI Grader for instant feedback on your assignments.

risk- returns trade-off. The last two decades in Australia, the investors use the efficient portfolio
frontier to find out each investment returns and the level of risk associated with them (Clarke, De
Silva, & Thorley, 2016).
For example:
Mr. A has two securities, Security A and Security B, for investment. The following table
shows Mr. A expectation for expected return and standard deviation:
Securities Expected return (Er) Standard Deviation
A 12% 6%
B 8% 4%
The correlation coefficient between returns on both assets is estimated to be 0.6
Following table represents Mr. A portfolio’s standard deviation and expected return at different
mix of A and B
Security A Weight Security B Weight Portfolio Standard
Deviation
Portfolio Standard
Deviation
100% 0% 6% 12%
80% 20% 4.87% 11.20%
60% 40% 3.94% 10.4%
5
40% 60% 3.39% 9.60%
20% 80% 3.42% 8.80%
0% 100% 4% 8%
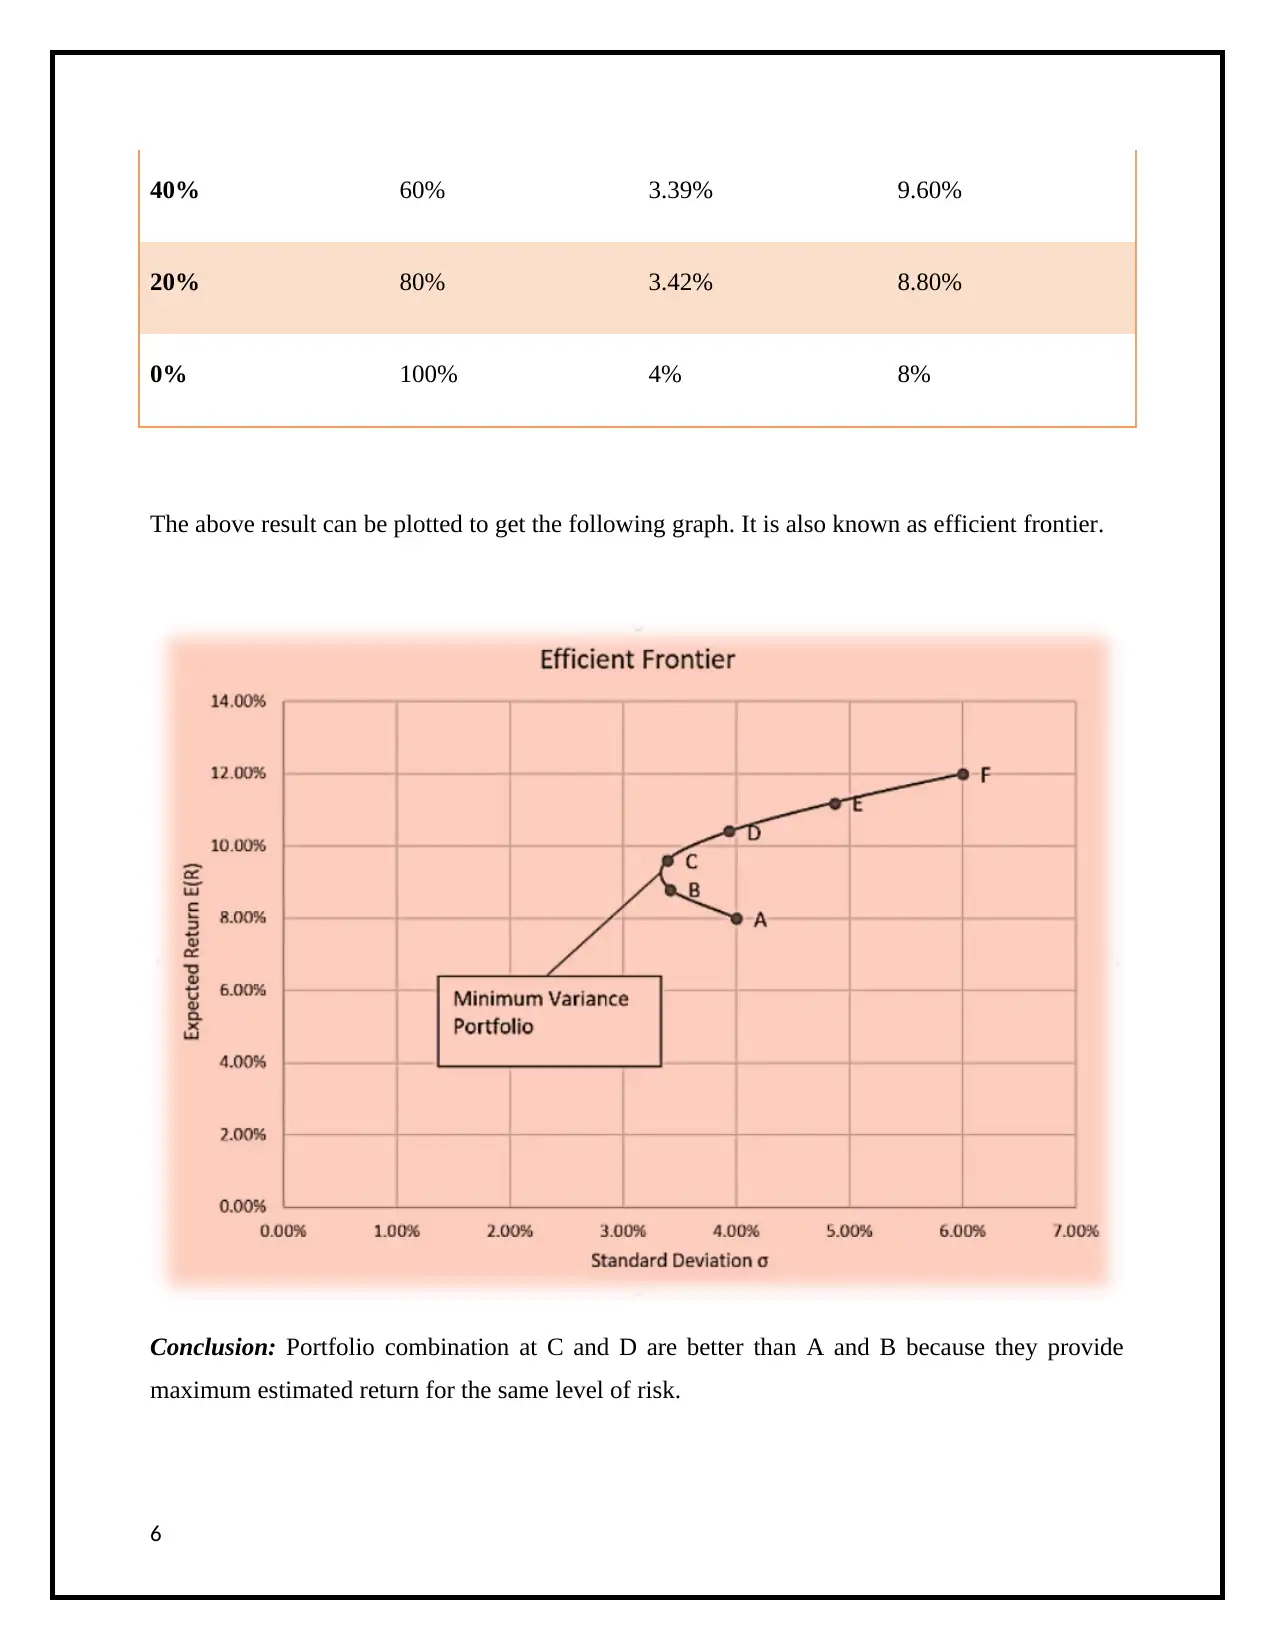
The above result can be plotted to get the following graph. It is also known as efficient frontier.
Conclusion: Portfolio combination at C and D are better than A and B because they provide
maximum estimated return for the same level of risk.
6
20% 80% 3.42% 8.80%
0% 100% 4% 8%
The above result can be plotted to get the following graph. It is also known as efficient frontier.
Conclusion: Portfolio combination at C and D are better than A and B because they provide
maximum estimated return for the same level of risk.
6

With the help of this the investor can know level of risk associate with the investment and also
find out the highest level of return from the investment.
Trend line
In a technical analysis, a trend lines are important tool for both trend identification and
confirmation in the capital market. Trend analysis is a straight line that joins two or more price
point and then spreads into the upcoming period to act as a support line and resistance (Edwards,
Magee, & Bassetti, 2018).
7
Paraphrase This Document
Need a fresh take? Get an instant paraphrase of this document with our AI Paraphraser

Uptrend market is selected for the creation of portfolio:
Figure 2: Uptrend Line
By Author, 2018
This trend line shows a positive slope in the graph to the investors and is formed by connecting
two or more low points. It is also support and shows that net- demand is growing up even as the
rise price. The uptrend line is also considered as compact and integral. A growing price
associated with rising demand is very bullish and indicates a strong fortitude on the part of the
purchasers.
8

Daily Data of Equity for the period January 2015-December 2018.
2015
2016
9
2015
2016
9

2017
2018
10
2018
10
Secure Best Marks with AI Grader
Need help grading? Try our AI Grader for instant feedback on your assignments.

11

Construction of portfolio (four stocks)
Aristocrat Leisure Limited
Type of Company: Consumer Discretionary
Manufactures, designs, develops and markets a different variety of products and services
comprising electronic gaming machines, casino, digital social games and management systems.
CSL Limited
Type of Company: Health Care
Expansion, marketing and manufacturing of pharmaceutical and investigative products, human
plasma fractions and cell culture media.
WOW (WOOLWORTHS GROUP LIMITED)
Type of Company: Consumer Staples
General merchandise, food and specialty retailing through chain store operations.
WES (WESFARMERS LIMITED)
Type of Company: Consumer Discretionary
Expanded industrial with benefits comprising operations of retail covering general merchandise,
supermarkets and specialty divisions stores, liquor and fuel outlets and office supplies and home
12

improvement; gas processing, coal mining and distribution; insurance; fertilizers and chemicals;
and safety product and industrial distribution.
Analysis and Evaluation
The efficient frontier represents all the dominant portfolios in risk or return space. Efficient limit
is the combination of best or ideal portfolios that gives the maximum estimated return to the
investors for a defined level of risk. The portfolio of securities that shown underneath to the
efficient frontier are sub- ideal because they do not give expected profit to the investors whereas
portfolios that lie to the efficient limit are ideal or optimal to the investors and also provides
expected or more returns to the investors (Heaton, Polson, & Witte, 2016).
For example: The risk-free rate is 6% p.a. which include 3 months T-bill rate as a risk free rate
and the expected return on the stock market is 10% with a standard deviation of 20%. The ABC
LTD. common stock’s returns are 40% correlated with the stock market return and has a standard
deviation of 80%. What is the expected return for ABC LTD stock?
Ans. E (Ri) = Rf + βi (Rm – Rf)
If βi = COVi,M / M2
βi = 0.40/0.80
= 0.50
Rf = 6%/12*3 = 1.5%
Note: Beta is less than one means that the stock is less volatile than the market as a whole or
vice-versa.
E(Ri) = 1.5% + 0.50 ( 10%- 6%)
= 2*4
13
Paraphrase This Document
Need a fresh take? Get an instant paraphrase of this document with our AI Paraphraser

= 8%
Application of Separation property to the portfolio
A separation property is an important part of modern portfolio theory that provides a portfolio
manager to detach the satisfaction process into two distinct portions:
The first portion of separation property is the determination of the “optimal risky portfolio”
whereas the second portion is modifying the use of that portfolio to the risk-aversive wants of
each individual user (Lorig & Sircar, 2016).
Sharpe performance measure of the optimal portfolio
Sharpe ratio helps to the investor to measure the performance of optimal portfolio. Sharper ratio
is the portion of risk- adjusted return of a portfolio. A portfolio which has a highest Sharpe ratio
is considered as good and optimal to the investors (Dhrymes, 2017).
Sharpe ratio is calculated by following formula:
= {R (p) – R (f)} /s (p)
Where R (p): Portfolio Return
S (p): Standard deviation of the portfolio
R (f): Risk free rate of return
The Sharpe ratio is a measure of return that is always used to compare the investment
performance managers by constructing an adjustment for risk.
If the risk-free rate is changed by +1% and -1% then the Sharpe fluctuate and the estimated rate
of return and level of risk associated is also changed.
If the risk-free rate of return is +1% then the security performed better in the financial market
whereas if the risk-free rate of return is -1% then the security performed worse in the market.
Risk premium or reward of Sharpe Ratio to the variability of risk or return as measured by the
standard deviation of return (Padma & Rambabu, 2017).
14

The use of the Markowitz portfolio model in the construction of the optimal portfolio
compared with the single index model.
William Sharpe simplifies the Markowitz Model by decreasing the data in a substantive manner.
Sharpe has improved the method of Markowitz but he also introduced some inputs in his model.
Harry Markowitz suggested that the investors were mainly focused on assessing the risk and
return of individual securities when construction of an optimal portfolio. Markowitz offers an
approach that is called diversification, where the portfolio construction is made after evaluation
of the overall risk portfolio. The diversification idea of Harry Markowitz is subject to fact that
with increasing number of assets or securities in the optimal portfolios, the risk can be diversified
or set- off with the other assets or securities by an investor (Way, et. al., 2019). It is a simple
method for the investors and provides an idea to use diversification technique to diversify the
level of risk with other securities. Expected return and risk as used by investors are measured by
the first two probability moments i.e., expected variance and value of the security. This model
also said that there is no transaction cost or taxes on the security or asset which are purchased by
the investors to form an optimal portfolio to earn return. The financial or capital markets are
frictionless and not give any harm to the investors (Chandra, 2017).
But the Sharpe model is just opposite to the Markowitz model because it measure portfolio
performance by giving risk premium per unit of total risk which is calculated by the portfolio
standard deviation of return (Kellner & Utz, 2019).
15

Conclusion
This report concluded that the efficient portfolio provides an expected or more return to the
investors from the financial market. By using the various models, an investor can create an
optimal portfolio for increasing the wealth and investment. In this report the efficient portfolio
frontier provides an optimal or ideal level of return or more return to the investors. Harry
Markowitz and William Sharpe is best model which provides an idea to the investors while
creating an optimal portfolio for their future growth and development. The Sharpe model helps
to the investors to check the performance level of the ideal or optimal portfolio by comparing the
past trend of the financial market.
16
Secure Best Marks with AI Grader
Need help grading? Try our AI Grader for instant feedback on your assignments.

References
Chandra, P. (2017). Investment analysis and portfolio management. McGraw-Hill Education,
2017.
Clarke, R., De Silva, H., & Thorley, S. (2016). Fundamentals of Efficient Factor Investing.
Dhrymes, P. J. (2017). Portfolio theory: origins, Markowitz and CAPM based selection.
In Portfolio Construction, Measurement, and Efficiency (pp. 39-48). Springer, Cham.
Edwards, R. D., Magee, J., & Bassetti, W. C. (2018). Technical analysis of stock trends. CRC
press. (corrected May 2017). Financial Analysts Journal, 72(6), 9-26.
Heaton, J. B., Polson, N. G., & Witte, J. H. (2016). Deep portfolio theory. arXiv preprint
arXiv:1605.07230.
Kellner, F., & Utz, S. (2019). Sustainability in supplier selection and order allocation: combining
integer variables with Markowitz portfolio theory. Journal of Cleaner Production, 214,
462-474.
Lorig, M., & Sircar, R. (2016). Portfolio optimization under local-stochastic volatility:
Coefficient taylor series approximations and implied Sharpe ratio. SIAM Journal on
Financial Mathematics, 7(1), 418-447.
Padma, A., & Rambabu, G. (2017). Optimal Portfolio Construction by Using Sharpe Single
Index Model. Sumedha Journal of Management, 6(4), 57-65.
Pavlou, A., Doumpos, M., & Zopounidis, C. (2018). The Robustness of Portfolio Optimization
Models: An Empirical Comparative Analysis. In Perspectives, Trends, and Applications
in Corporate Finance and Accounting (pp. 210-229). IGI Global.
Way, R., Lafond, F., Lillo, F., Panchenko, V., & Farmer, J. D. (2019). Wright meets Markowitz:
How standard portfolio theory changes when assets are technologies following
experience curves. Journal of Economic Dynamics and Control.
17

18
1 out of 18
Related Documents


Your All-in-One AI-Powered Toolkit for Academic Success.
+13062052269
info@desklib.com
Available 24*7 on WhatsApp / Email
![[object Object]](/_next/static/media/star-bottom.7253800d.svg)
Unlock your academic potential
© 2024 | Zucol Services PVT LTD | All rights reserved.