Quality Assessment Tool for Quantitative Studies
Added on 2022-10-13
9 Pages2804 Words347 Views
OPTION 1: Individual submission (begin with this template and use it to submit your draft)
Structured 3,500 word essay maximum
excluding the words of these
questions and your list of references. Expand the explanation boxes as
required. This template contains approximately 1515 words.
Due dates:
Substantial individual draft: 28 Sep, 2019 by 23:59
Final submission: 24 Oct, 2019 by 23:59
You must use this worksheet to complete the assessment and
submit it through Turnitin.
Pair number
Name and
student
number
Amandeep Mehla;
10598812
Second
reviewer, name
and student
number
Date draft
submitted
through
TurnitIn.
Word count (not
including the words for
the form and the
references):
Date of
exchange
individual work
and discussion
with partner
Study assessed as described in:
Ybarra, M. L., Holtrop, J. S., Prescott, T. L., Rahbar, M. H., & Strong, D. (2013).
Pilot RCT results of stop my smoking USA: a text messaging–based smoking
cessation program for young adults. nicotine & tobacco research, 15(8), 1388-
1399.
https://doi-org.ezp01.library.qut.edu.au/10.1093/ntr/nts339
Remember, you are assessing the study which is described, and not this single
publication. You will need to check and identify if additional information about
this study is available. If so then you can incorporate the information into the
responses. Please be aware that sometimes the information may conflict. Place
your answers inside the boxes.
QUALITY ASSESSMENT TOOL FOR QUANTITATIVE STUDIES
Please complete these the questions presented as structured
paragraphs as you would in an essay. Clearly mark your
selection or cross-out the choice not applicable. Do not use
highlighting or colour change as this is not recognised in
Turnitin. Demonstrate your knowledge of epidemiological
principles within each section and support your statements.
Part 1: (Initially undertaken on your own)
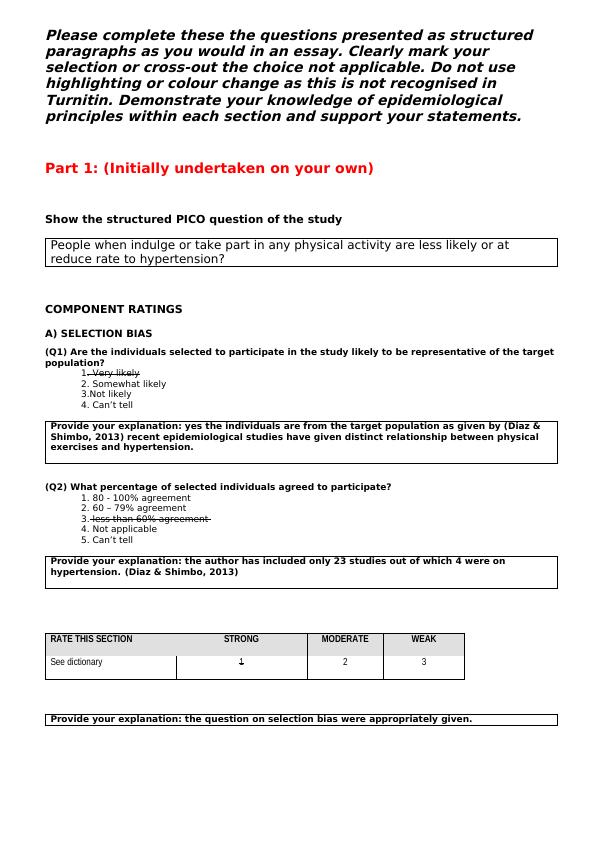
Show the structured PICO question of the study
People when indulge or take part in any physical activity are less likely or at
reduce rate to hypertension?
COMPONENT RATINGS
A) SELECTION BIAS
(Q1) Are the individuals selected to participate in the study likely to be representative of the target
population?
1. Very likely
2. Somewhat likely
3.Not likely
4. Can’t tell
Provide your explanation: yes the individuals are from the target population as given by (Diaz &
Shimbo, 2013) recent epidemiological studies have given distinct relationship between physical
exercises and hypertension.
(Q2) What percentage of selected individuals agreed to participate?
1. 80 - 100% agreement
2. 60 – 79% agreement
3. less than 60% agreement
4. Not applicable
5. Can’t tell
Provide your explanation: the author has included only 23 studies out of which 4 were on
hypertension. (Diaz & Shimbo, 2013)
RATE THIS SECTION STRONG MODERATE WEAK
See dictionary 1 2 3
Provide your explanation: the question on selection bias were appropriately given.
paragraphs as you would in an essay. Clearly mark your
selection or cross-out the choice not applicable. Do not use
highlighting or colour change as this is not recognised in
Turnitin. Demonstrate your knowledge of epidemiological
principles within each section and support your statements.
Part 1: (Initially undertaken on your own)
Show the structured PICO question of the study
People when indulge or take part in any physical activity are less likely or at
reduce rate to hypertension?
COMPONENT RATINGS
A) SELECTION BIAS
(Q1) Are the individuals selected to participate in the study likely to be representative of the target
population?
1. Very likely
2. Somewhat likely
3.Not likely
4. Can’t tell
Provide your explanation: yes the individuals are from the target population as given by (Diaz &
Shimbo, 2013) recent epidemiological studies have given distinct relationship between physical
exercises and hypertension.
(Q2) What percentage of selected individuals agreed to participate?
1. 80 - 100% agreement
2. 60 – 79% agreement
3. less than 60% agreement
4. Not applicable
5. Can’t tell
Provide your explanation: the author has included only 23 studies out of which 4 were on
hypertension. (Diaz & Shimbo, 2013)
RATE THIS SECTION STRONG MODERATE WEAK
See dictionary 1 2 3
Provide your explanation: the question on selection bias were appropriately given.
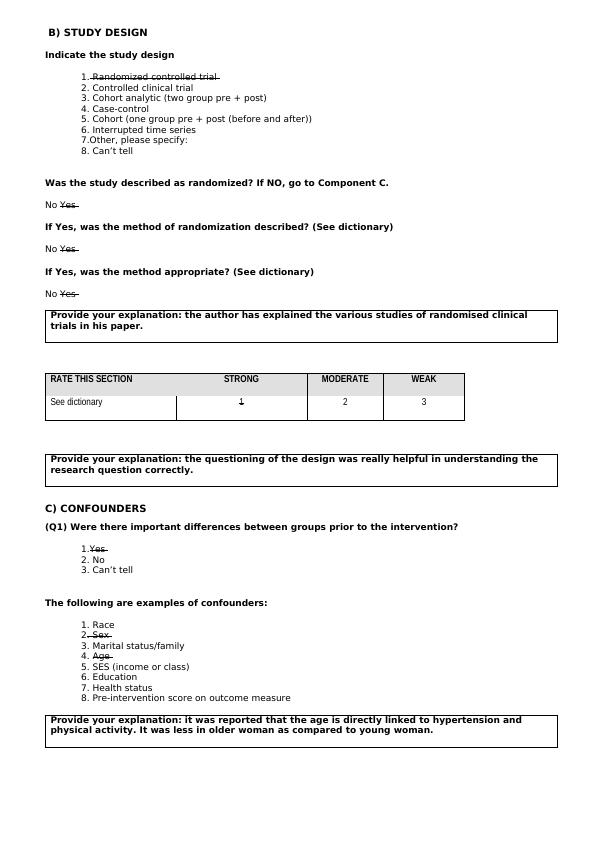
B) STUDY DESIGN
Indicate the study design
1. Randomized controlled trial
2. Controlled clinical trial
3. Cohort analytic (two group pre + post)
4. Case-control
5. Cohort (one group pre + post (before and after))
6. Interrupted time series
7.Other, please specify:
8. Can’t tell
Was the study described as randomized? If NO, go to Component C.
No Yes
If Yes, was the method of randomization described? (See dictionary)
No Yes
If Yes, was the method appropriate? (See dictionary)
No Yes
Provide your explanation: the author has explained the various studies of randomised clinical
trials in his paper.
RATE THIS SECTION STRONG MODERATE WEAK
See dictionary 1 2 3
Provide your explanation: the questioning of the design was really helpful in understanding the
research question correctly.
C) CONFOUNDERS
(Q1) Were there important differences between groups prior to the intervention?
1.Yes
2. No
3. Can’t tell
The following are examples of confounders:
1. Race
2. Sex
3. Marital status/family
4. Age
5. SES (income or class)
6. Education
7. Health status
8. Pre-intervention score on outcome measure
Provide your explanation: it was reported that the age is directly linked to hypertension and
physical activity. It was less in older woman as compared to young woman.
End of preview
Want to access all the pages? Upload your documents or become a member.
Related Documents
Quality Assessment Tools for Qualitativelg...
|12
|5554
|34
Quality Assessment Tool for Quantitative Studieslg...
|12
|5584
|40
Quality Assessment of a Quantitative Study on Contingency Management for Smoking Cessationlg...
|11
|5244
|87
An Assessment Template for a 3,500-word Essaylg...
|14
|5998
|299
Preventing weight-related problems in adolescent girls through physical education and motivational interviewlg...
|12
|6095
|284
An Assessment Template for a 3500 Word Essaylg...
|13
|6054
|341