Changing in the Concept Of Overtime And Its Application Influencing The Productivity And Performance Of Human Resources In Developing Country: A Case Study of India
VerifiedAdded on 2023/06/05
|27
|7369
|323
AI Summary
This paper analyzes the relationships between different components of working time and results, in terms of productivity and company performance. It categorizes “reasonable” work time action plans into two distinct categories that can effectively affect company performance. The paper finds that productivity does not really improve when hours are extended, and that in many businesses it is clear that limited hours are associated with higher hourly rates. The main aim of the paper is to examine the changes in the concept of overtime and its impact on productivity and performance of human resources in developing country by putting special focus on case study of India.
Contribute Materials
Your contribution can guide someone’s learning journey. Share your
documents today.
Running Head: PRODUCTIVITY AND PERFORMANCE
Changing in the Concept Of Overtime And Its Application Influencing The Productivity And
Performance Of Human Resources In Developing Country: A Case Study of India
[Name of the Writer]
[Name of the Institution]
Changing in the Concept Of Overtime And Its Application Influencing The Productivity And
Performance Of Human Resources In Developing Country: A Case Study of India
[Name of the Writer]
[Name of the Institution]
Secure Best Marks with AI Grader
Need help grading? Try our AI Grader for instant feedback on your assignments.
Productivity and Performance ii
ABSTRACT
This paper includes all recent research that analyses the relationships between different
components of working time and results, in terms of productivity and company performance.
These perspectives mean both what the length of working hours means for unit production as
well as the variety of "reasonable" or imaginary working time scenarios (ie soft time, tight
working weeks, average hours, working time / time accounts). Bank, etc.) affect the performance
of the company. First, in terms of the number (hours) of working hours, the paper finds that
productivity does not really improve when hours are extended, and that in many businesses it is
clear that limited hours are associated with higher hourly rates. Second, in terms of performance
planning, this paper categorizes “reasonable” work time action plans into two distinct categories
that can effectively affect company performance. For example, both temporary maps and tight
work weeks have an impact on productivity, employee job satisfaction, and job satisfaction;
Similarly, the long run also has a significant impact on the lack of work. In fact, a better balance
between serious rehearsals and fun for activities, such as letting workers adapt in terms of
planning to get the job done, is basically related to high productivity. There is also significant
evidence that employers who provide employees with adaptation of working hours may work on
finding new employees and retaining existing employees, reducing the cost of investing the
business.
Productivity and Performance iii
Table of Contents
ABSTRACT..................................................................................................................................................................II
INTRODUCTION.........................................................................................................................................................1
BACKGROUND OF THE RESEARCH..............................................................................................................................1
AIM OF THE RESEARCH...............................................................................................................................................1
OBJECTIVES OF THE RESEARCH..................................................................................................................................1
PROBLEM STATEMENT................................................................................................................................................2
RESEARCH QUESTION.................................................................................................................................................3
Primary RQ............................................................................................................................................................3
Secondary RQs.......................................................................................................................................................3
RATIONALE OF THE STUDY.........................................................................................................................................4
LITERATURE REVIEW............................................................................................................................................5
HEALTH AND RELATIONAL ISSUES.............................................................................................................................5
SAFETY ISSUES............................................................................................................................................................6
PRODUCTIVITY ISSUES................................................................................................................................................6
HUMAN RESOURCES RELATED ISSUES.......................................................................................................................6
DURATION OF WORKING HOURS EFFECT ON PRODUCTIVITY AND FIRM’S PERFORMANCE.....................................7
RESEARCH METHODOLOGY................................................................................................................................9
RESEARCH DESIGN......................................................................................................................................................9
RESEARCH APPROACH................................................................................................................................................9
RESEARCH POSITIVISM.............................................................................................................................................10
RESEARCH INSTRUMENT...........................................................................................................................................10
Survey..................................................................................................................................................................10
SAMPLE AND POPULATION........................................................................................................................................11
ETHICAL CONSIDERATION........................................................................................................................................11
LIMITATIONS.............................................................................................................................................................12
DATA ANALYSIS......................................................................................................................................................13
ANTICIPATED RESULTS.............................................................................................................................................13
Employment Working And Average Minutes.......................................................................................................13
Average Work Time On Weekends......................................................................................................................14
CONCLUSION...........................................................................................................................................................16
REFERENCE LIST....................................................................................................................................................17
APPENDICES.............................................................................................................................................................20
Productivity and Performance 1
INTRODUCTION
Background of the Research
Working time is generally the centre of an individual’s social life, and the specific
measurement of working time is not only an important factor in ensuring financial growth, but
also an important variable in identifying changes in the existing social system and productivity
improvements. With the advent of smart frameworks and productivity, the era of Industry 4.0 has
changed the way people produce and the way of life, and traditional manufacturing has begun to
embrace the Internet of Things (in the hope of connecting people, machines, materials anytime,
anywhere) or Big Data for change. wise Analysis, it illuminates new features that transform
reality. Because of competition and failure, this fact of change raises higher expectations for
administrative practice, but also highlights the importance of explaining regulated working time
patterns (Lasisi, et.al., 2020).
Aim of the Research
The main aim of the paper is to examine the changes in the concept of overtime and its
impact on productivity and performance of human resources in developing country by putting
special focus on case study of India.
Objectives of the Research
The objectives of the research are:
To investigate the impact of overtime that is being forced by employers on employee
motivation and productivity in India.
To study the impact of overtime on employee health and well-being and their satisfaction
with the job or life, without getting any raise in their current pay, and thus [result in] a
long-run suppression of labour costs, to the extent that it saves the relatively more hidden
costs associated with job dissatisfaction and human capital investment in Indian
companies.
To examine the impact on productivity, human resource and firm performance, as well as
the need for an awareness of this dimension when considering employers’ and workers’
preferences regarding working time in India.
Secure Best Marks with AI Grader
Need help grading? Try our AI Grader for instant feedback on your assignments.
Productivity and Performance 2
To evaluate the employers who offer work schedule flexibility to their employees to
improve the recruitment of new staff and the retention of existing staff, resulting in cost
savings to the enterprise at India.
To observe the patterns of Indian employees after working long hours which lead to
higher levels of sickness absence and low productivity due to exhaustion.
Problem Statement
The actual use of extra time requires an understanding of the expected negative impact on
employees; overuse is not as strong if it leads to employee burnout, unnecessary turnover, or
reduced employee involvement. Increased overtime reduces an employee’s ability to take
adequate rest, which can lead to employee health problems as well as welfare and quality
problems at work. Delay in overtime can lead to work that relies on overtime, shortages and low
productivity. While too long can be average, long hours can be detrimental.
When people consider oversight in an association, they usually do so from a financial
perspective. It is expected to consider issues such as the amount of time we spend on overtime,
the comparison of costs and the recruitment of additional staff, the way in which unplanned
absence affects the number of employees. While these are fundamental questions, there is one
more thing we need to consider: the impact of overtime on employee productivity.
Various recent studies have shown that extra time really has the opposite effect on
employees and the nature of the work that is done. It is not hard to believe that, considering that
an employee works 80 hours, a useful job may work as much as a 40-hour employee. Still, for
many people, it does not work that way. Hope to understand that employees are not robots.
Employees are vulnerable to weakness, burnout and stress. An employee’s body can deteriorate,
their emotional health can deteriorate, and their productivity can collapse.
This applies not only to the effects of one week or so, but also to long periods of
collection in the long run. The survey found that an employee who works 60 hours a week for
long periods of time is not really like an employee who works 40 hours a week during the same
period.
Research Question
Primary RQ
Productivity and Performance 3
How are changes in the concept of overtime and its application influencing the
productivity and performance of Human Resources in developing country like India?
Secondary RQs
What are the positive features of overtime on employee productivity and firm’s
performance?
What are the factors that has led an employee towards overtime?
What are the problems due to excessive overtime and what are the measures required to
be taken by human resources?
Rationale of the Study
Employers can use more time to satisfy employees, and surprisingly, more time can pass
through temporary peaks in job demand. HR experts can help employers regularly use this "extra
tool", monitor its use, and investigate short- and long-term employee responses to their needs. To
avoid more problems, managers in general and individuals should pay attention to extra hours.
They also need to track absences to make it easier to understand why there are no employees and
whether unfortunate deficiencies follow or go from one year to the next. The manager must have
a reasonable understanding of the responsibilities of the office to understand whether it is
ongoing or changeable, why it is changing and estimating for the remaining years. Finally,
managers need to research the association’s policies further so that they are attractive and
provide adequate insurance for employees.
Productivity and Performance 4
LITERATURE REVIEW
There are significant theoretical and methodological challenges in assessing the impact of
long-term work on governance performance. However, in general, on the basis of evidence, it is
impractical to state explicitly whether working longer hours can help, hinder, or neutralize and
have major effects. There is some new evidence that a long reduction may be related to an
increase in business or productivity. In any case, it is difficult to separate the effect of the
reduction of working hours in its original form, because the reduction of extended working hours
is often accompanied by various events, such as changes in work associations, speculation of
new capital, and so on. To be more likely to understand this, it is useful to look at some areas
where over time is seen to have an increasingly negative impact on our staff, human resources
and associations (Durdyev, Ismail & Kandymov, 2018).
Health and Relational Issues
Because the effects on employees have been calculated over time in the study, the most
obvious are the effects on physical and mental health. Studies in this area confirm that excessive
weight over time has detrimental physical and psychological effects (Katou, 2017). In particular,
excessive time was associated with back or joint pain, high blood pressure, increased anxiety,
heavy alcohol consumption, unhealthy weight gain, heavy work and family conflicts, high rates
of separation, anxiety and mood swings. there (Durdyev, Ismail and Kandymov, 2018).
Paraphrase This Document
Need a fresh take? Get an instant paraphrase of this document with our AI Paraphraser
Productivity and Performance 5
Safety Issues
It is clear that working long hours is associated with an increased risk of work.
Consideration and correction weaken over time. This leads to an increase in errors and incidents
that endanger employees, customers or patients (Kampkötter et al., 2016).
Productivity Issues
The effect of extended time on production is well documented. A study suggested that
when middle-class workers work 60 hours a day, productivity drops by as much as 25%. Another
study found that when employees spent more than 50 hours, productivity was low. Furthermore,
it is not just the middle class or information workers who are affected. In one cohort of
production, it was found that a 10% increase over time led to a 24% decrease in hourly
production (Radant, Colomo, & Stantchev, 2016).
Human Resources Related Issues
The elements mentioned above add to the latter problem: the lack and increase of returns.
When they get tired, most employees reach the place where they need to be in between. Whether
it is the result of illness, injury, or exhaustion, absence often raises involvement issues.
Employers try to find transfers, which can continue the cycle of different employees (Radant,
Colomo, & Stantchev, 2016).
All of these, health problems, safety issues, production problems, and absenteeism,
damage employee morale, which often leads to employee dismissal. A study on relocation
workers found that 31% of organisations that work with employees for more than 10 hours in a
seven-day period are unsure. In contrast, only 13% of workers work more than 10 hours per
week (Ko and Choi, 2019).
Excessive rates have been found to intimidate employees, reduce job satisfaction and
increase the likelihood of turnover. In fact, organisations with high turnover rates may be
organisations with high turnover rates. Although this may indicate a causal relationship, it does
indicate a relationship between overtime and rotation (Naoum, 2016).
For some organisations, extra time is a chore and sometimes a worthwhile job. However,
the overall picture of the increased impact on our association and our employees must be taken
into account (Darmawan, et.al., 2020). Consider the impact of their working hours on their
Productivity and Performance 6
health, safety, productivity and safety. Beware of the potential for over-the-counter self-
promotional templates that have a negative impact on your organisation. Most importantly, learn
how to measure employee and productivity spirit so that you recognize where changes need to be
made to your association (Nguyen, 2016).
Duration Of Working Hours Effect On Productivity And Firm’s Performance
Extending the hours of each employee may increase the productivity level of each
employee, but does it really increase labour productivity? In the United States, in some
industries, longer working hours may be associated with higher productivity, but they are less
likely to be associated with lower productivity during the period 2000-2005. The results of
hourly production are rarely seen directly. However, Durdyev, Ismail, and Kandymov, (2018)
concluded that when working hours are extended, productivity does not need to increase.
Moreover, a 10% increase over time leads to an average decrease of 2.4% in output as measured
by hourly output (Darmawan et al., 2020).
Indeed, in many, if not most, industries in the United States, shorter working hours are
actually associated with higher production rates. In the second half of the 1990s, output growth
in industries related to the production, distribution and use of IT products produced a rapidly
well-documented increase in output, as working hours increased modestly. In 2000-05, the
recovery was accelerated by the collapse of production in 2001, which accounted for more than
60% of manufacturing growth. In contrast, the reduction in working hours was longer and
shorter, which affected 80 percent of the research industry. In some cases, this can return with a
reduction in the number of hours each employee works (Radant, Colomo & Stantchev, 2016).
Production growth in 2000-2005 was lower than in 1995-2000, but did not stop at all. This is
because both work and working hours are slowly falling behind. Production grew rapidly in the
1990s because production grew much faster than working hours. However, in the period 2000-
05, the reduction of working hours was a major factor in improving productivity, especially in
the information sector (Ishizaka, Pereira, 2016). Thus, the small increase in hours worked after
the year 2000 seems to be related to other similar increases in production. Strong productivity
growth was a major contributor to productivity growth in the 1990s. In contrast, between 2000-
05, the reduction in labour played a major role in contributing to the productive gains seen in

Productivity and Performance 7
many sectors. It can therefore be concluded that relatively short working hours may lead to
increased hourly productivity (Mahmood, Raewf & Hamadany, 2019).
many sectors. It can therefore be concluded that relatively short working hours may lead to
increased hourly productivity (Mahmood, Raewf & Hamadany, 2019).
Secure Best Marks with AI Grader
Need help grading? Try our AI Grader for instant feedback on your assignments.
Productivity and Performance 8
RESEARCH METHODOLOGY
Research Design
The research design can help logically and systematically incorporate the different
essential elements of the study because it refers to its overall strategy (Gonsalves et.al., 2020).
Therefore, it ensures the expert that the problem of the research can be effectively and coherently
addressed. It also contains the strategic planning for the data collection process, assessment, and
critical analysis. There are two different types of research design that include; primary research
design and secondary research design. The primary research design of the study is considerably
established on the new aims and objectives of the topic of the study that have not been assessed
initially. Primary research design is critically assessed with the help and support of collected
primary data or information and is analysed on the primary outcomes with the integration of
quantitative strategies and approaches critically explained and assessed. In addition, in primary
research design, the researcher is directly involved in the process of data collection. It can also be
stated that the researcher collects the sample of the data directly from the participants of the
research despite relying on already available data concerning the context of the research
(Cresswell et.al., 2021).
Research Approach
It has been identified that there are three types of research approaches, quantitative,
qualitative and mixed research methods. A quantitative research method is an approach that can
help to dissect the collected primary data with appropriate insights and mathematical methods
(Cresswell et.al., 2021). It is the relevant method of data collection and its assessment in
numerical form. The outcomes acquired from this approach can be used to determine patterns
and averages, assess the relationships between dependent and independent variables and make
assumptions (Cresswell et.al., 2021).
Research Positivism
Furthermore, from the analysis, the quantitative research approach has emerged from the
positivist research paradigm. Positivism puts significant value on control, objectivity, rationality
and prediction. Positivism research philosophy has been employed due to this specific reason. It
Productivity and Performance 9
contains the study of hypotheses or research questions that determine the concept’s classification
and prevalence, evaluate the relationships between variables and evaluate the effectiveness of
intervention (Cresswell et.al., 2021).
Research Instrument
Some of the research tools examples are discussion, questionnaires, surveys and more.
The questionnaire is one of the types of research instruments. Mostly, researchers use
questionnaires for data collection purposes. The questionnaire contains different questions, also
known as items, related to the research’s aim and objectives. It helps to gather research
participants’ different perspectives about the research topic (Cresswell et.al., 2021).
Survey
In this research, close-ended (survey) questionnaires have been distributed to the
participants of the research. The questionnaire was based on the Likert Scale and designed
accordingly. The questionnaire was used to collect data from 100 relevant research participants.
One of the reasons to use this research instrument is that it facilitated the research participants to
easily comprehend the questionnaire and quickly respond to the questions. Close-ended
questionnaires also facilitated the researcher to attain quantitative data which can be measurable
(Cresswell et.al., 2021).
Sample and Population
In research, the sample is the group of Indian people that are selected from the larger
population for the purpose of research. The sample is required to be representative of the specific
population in order to assure that the outcomes from the sample can be easily generalised by the
research to the population (Gonsalves et.al., 2020). The sample is the collection of the
participants of the research who are the main element and can significantly contribute to get the
outcomes of the research. Survey questionnaire will be distributed among 125 people who are
working with diverse organisations at India.
Ethical Consideration
Productivity and Performance 10
The researcher ensured that the study was designed as well as undertaken to the legal
compliance, ethical propriety, high standards and integrity (Cresswell et.al., 2021). The
participants of the study were informed by the researcher about the aim, objectives, methods and
intended employment of the study. It was also ensured that in the survey process, the participants
voluntarily contributed. The data which was acquired were kept confidential, and the anonymity
of the respondents was also respected (Cresswell et.al., 2021). The researcher ensured that the
information provided by the research would not be further employed in any other study.
Limitations
Limitations of the research are such elements that the experts have not been able to cover
in the study due to some factors. Limitations in research can be connected to the sample size,
financial resources, study timing, methodologies, data collection tool, availability of the
respondents and others. One of the main limitations of this particular research was the lockdown
and some rules and regulations imposed by the governments due to Covid-19 (Cresswell et.al.,
2021).
Paraphrase This Document
Need a fresh take? Get an instant paraphrase of this document with our AI Paraphraser
Productivity and Performance 11
DATA ANALYSIS
The most commonly employed analysis methods of quantitative data analysis is
descriptive analysis. This technique helps the researchers to analyse the collected data
systematically. Data analysis plays a significant role in the quantitative research approach, and
its importance cannot be ignored. Research’s data analysis contains the acquired data and later
process the collected data with relevant tools and strategies, such as statistical approaches,
graphs, different patterns and pie charts. Descriptive analysis has been used to analyse the
acquired quantitative data. The data was assessed through pie charts.
Anticipated Results
Employment Working And Average Minutes
Because direct measurement of “effort” is difficult, attempts to measure work effort
usually rely on estimating working hours. The clearest data on work cycles within a week comes
from surveys that use journal compilation strategies to collect data on how people have expended
their energy. The United Kingdom Time Study, conducted in 2000, asked people to perform a
proxy experiment to record their exercise in 10 minutes in two days (Radant, Colomo &
Stantchev, 2016). The same pattern applies to weekly periods, allowing us to use this data to
progressively analyse the extent to which individuals participate in wage labour (Ishizaka,
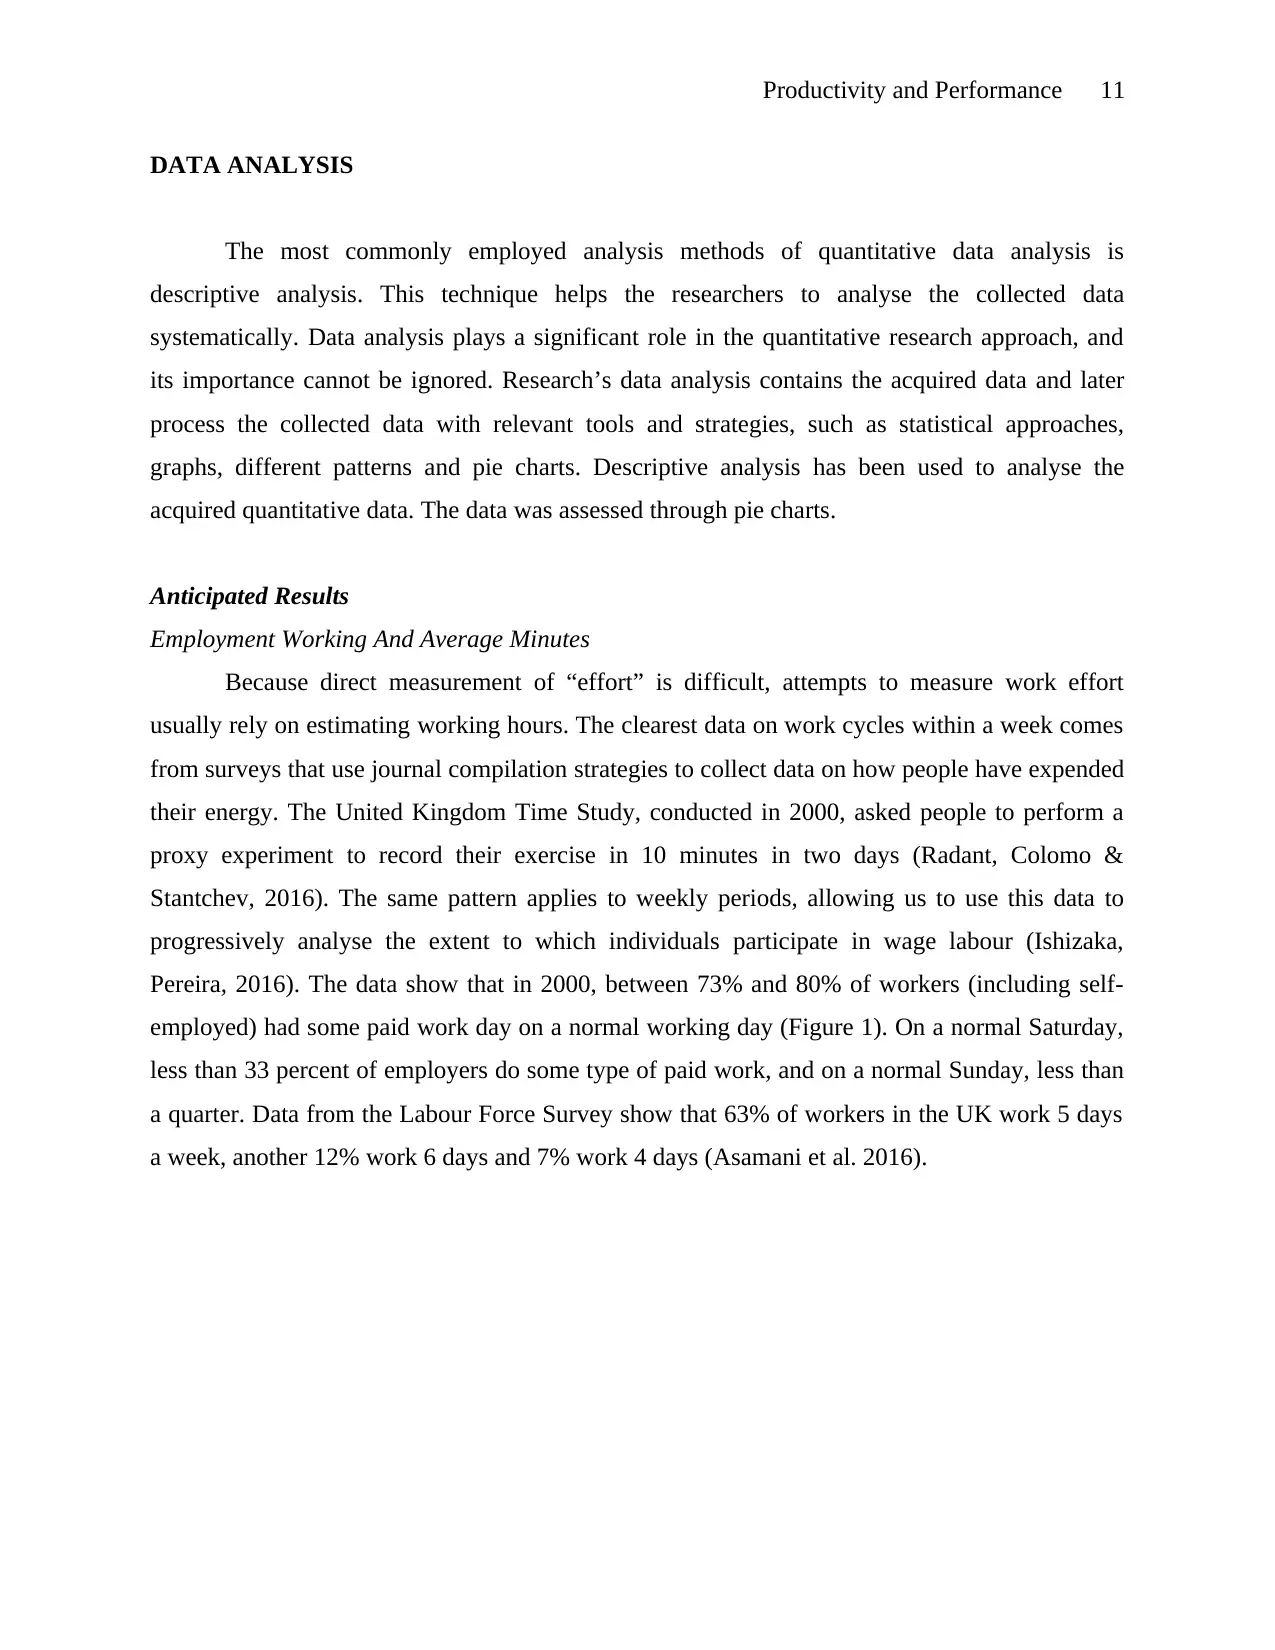
Pereira, 2016). The data show that in 2000, between 73% and 80% of workers (including self-
employed) had some paid work day on a normal working day (Figure 1). On a normal Saturday,
less than 33 percent of employers do some type of paid work, and on a normal Sunday, less than
a quarter. Data from the Labour Force Survey show that 63% of workers in the UK work 5 days
a week, another 12% work 6 days and 7% work 4 days (Asamani et al. 2016).
DATA ANALYSIS
The most commonly employed analysis methods of quantitative data analysis is
descriptive analysis. This technique helps the researchers to analyse the collected data
systematically. Data analysis plays a significant role in the quantitative research approach, and
its importance cannot be ignored. Research’s data analysis contains the acquired data and later
process the collected data with relevant tools and strategies, such as statistical approaches,
graphs, different patterns and pie charts. Descriptive analysis has been used to analyse the
acquired quantitative data. The data was assessed through pie charts.
Anticipated Results
Employment Working And Average Minutes
Because direct measurement of “effort” is difficult, attempts to measure work effort
usually rely on estimating working hours. The clearest data on work cycles within a week comes
from surveys that use journal compilation strategies to collect data on how people have expended
their energy. The United Kingdom Time Study, conducted in 2000, asked people to perform a
proxy experiment to record their exercise in 10 minutes in two days (Radant, Colomo &
Stantchev, 2016). The same pattern applies to weekly periods, allowing us to use this data to
progressively analyse the extent to which individuals participate in wage labour (Ishizaka,
Pereira, 2016). The data show that in 2000, between 73% and 80% of workers (including self-
employed) had some paid work day on a normal working day (Figure 1). On a normal Saturday,
less than 33 percent of employers do some type of paid work, and on a normal Sunday, less than
a quarter. Data from the Labour Force Survey show that 63% of workers in the UK work 5 days
a week, another 12% work 6 days and 7% work 4 days (Asamani et al. 2016).
Productivity and Performance 12
The Time Use Survey 2000 further revealed that the normal number of hours everyone
worked on Tuesdays, Wednesdays and Thursdays was around 360 hp (6 hours), down from 342
hp on Monday and 317 hp on Friday. Overall, in the middle of the week. Normal working hours
per person dropped to 116 on Saturday and only 71. On Sunday, the last option data, which often
contains a large number of zeros, came from people who do not work on weekends: Labour
Force Survey data shows that 45 % of men and 27% of women never work weekends (Naoum,
2016).
Average Work Time On Weekends
Regular working hours on Saturdays and Sundays also show the importance of regular
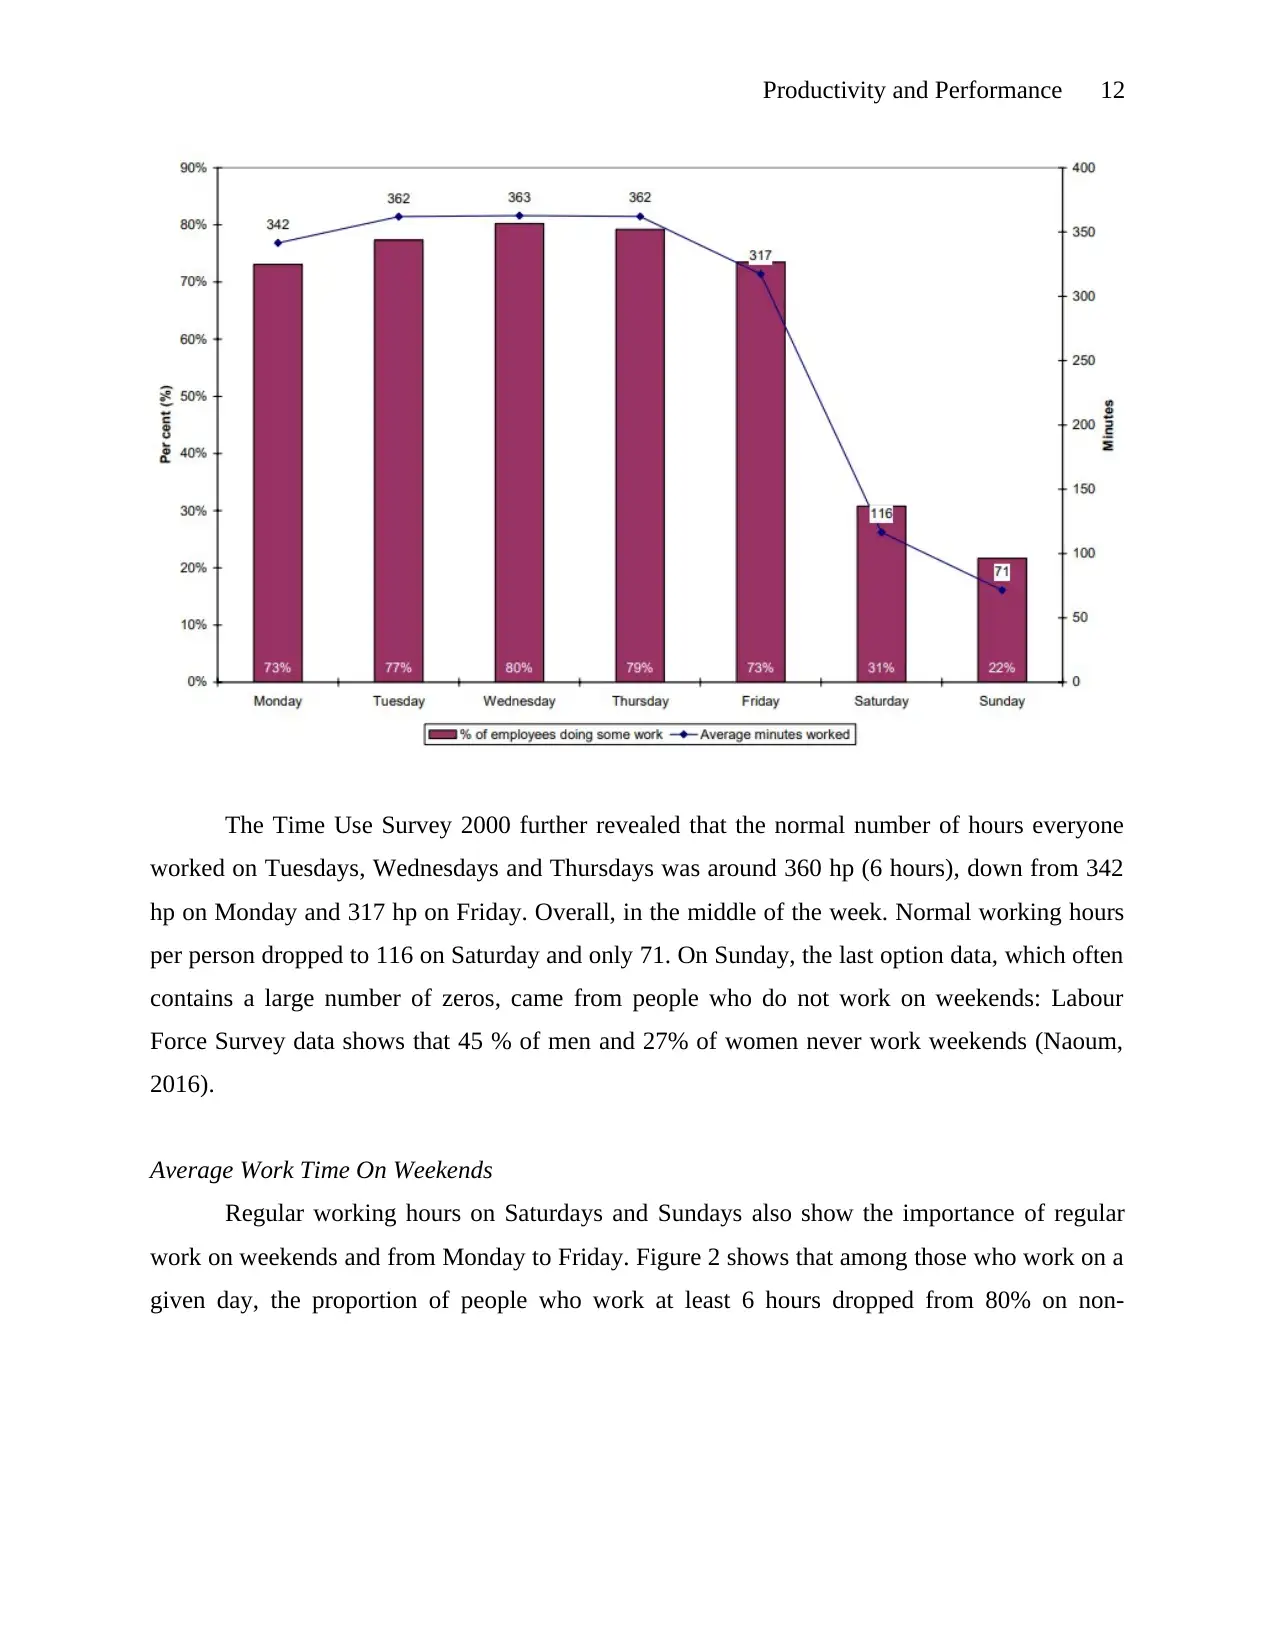
work on weekends and from Monday to Friday. Figure 2 shows that among those who work on a
given day, the proportion of people who work at least 6 hours dropped from 80% on non-
The Time Use Survey 2000 further revealed that the normal number of hours everyone
worked on Tuesdays, Wednesdays and Thursdays was around 360 hp (6 hours), down from 342
hp on Monday and 317 hp on Friday. Overall, in the middle of the week. Normal working hours
per person dropped to 116 on Saturday and only 71. On Sunday, the last option data, which often
contains a large number of zeros, came from people who do not work on weekends: Labour
Force Survey data shows that 45 % of men and 27% of women never work weekends (Naoum,
2016).
Average Work Time On Weekends
Regular working hours on Saturdays and Sundays also show the importance of regular
work on weekends and from Monday to Friday. Figure 2 shows that among those who work on a
given day, the proportion of people who work at least 6 hours dropped from 80% on non-
Productivity and Performance 13
weekends to about 50% on Saturdays and Sundays (Ko and Choi, 2019). .
By comparing the normal workload and payload given per day, one can work 7 days a
week. Traditional long working hours from Monday to Friday account for six to six hours of all
working hours offered in the UK on a public weekend. Of the five days, Tuesday was the largest
part of working hours (18.8%) and Friday the lowest (16.8%). The share of hours offered on
Saturdays was very low, remaining at 5.9%, while Sunday recorded a low of 3.8% (Kampkötter
et al., 2016).
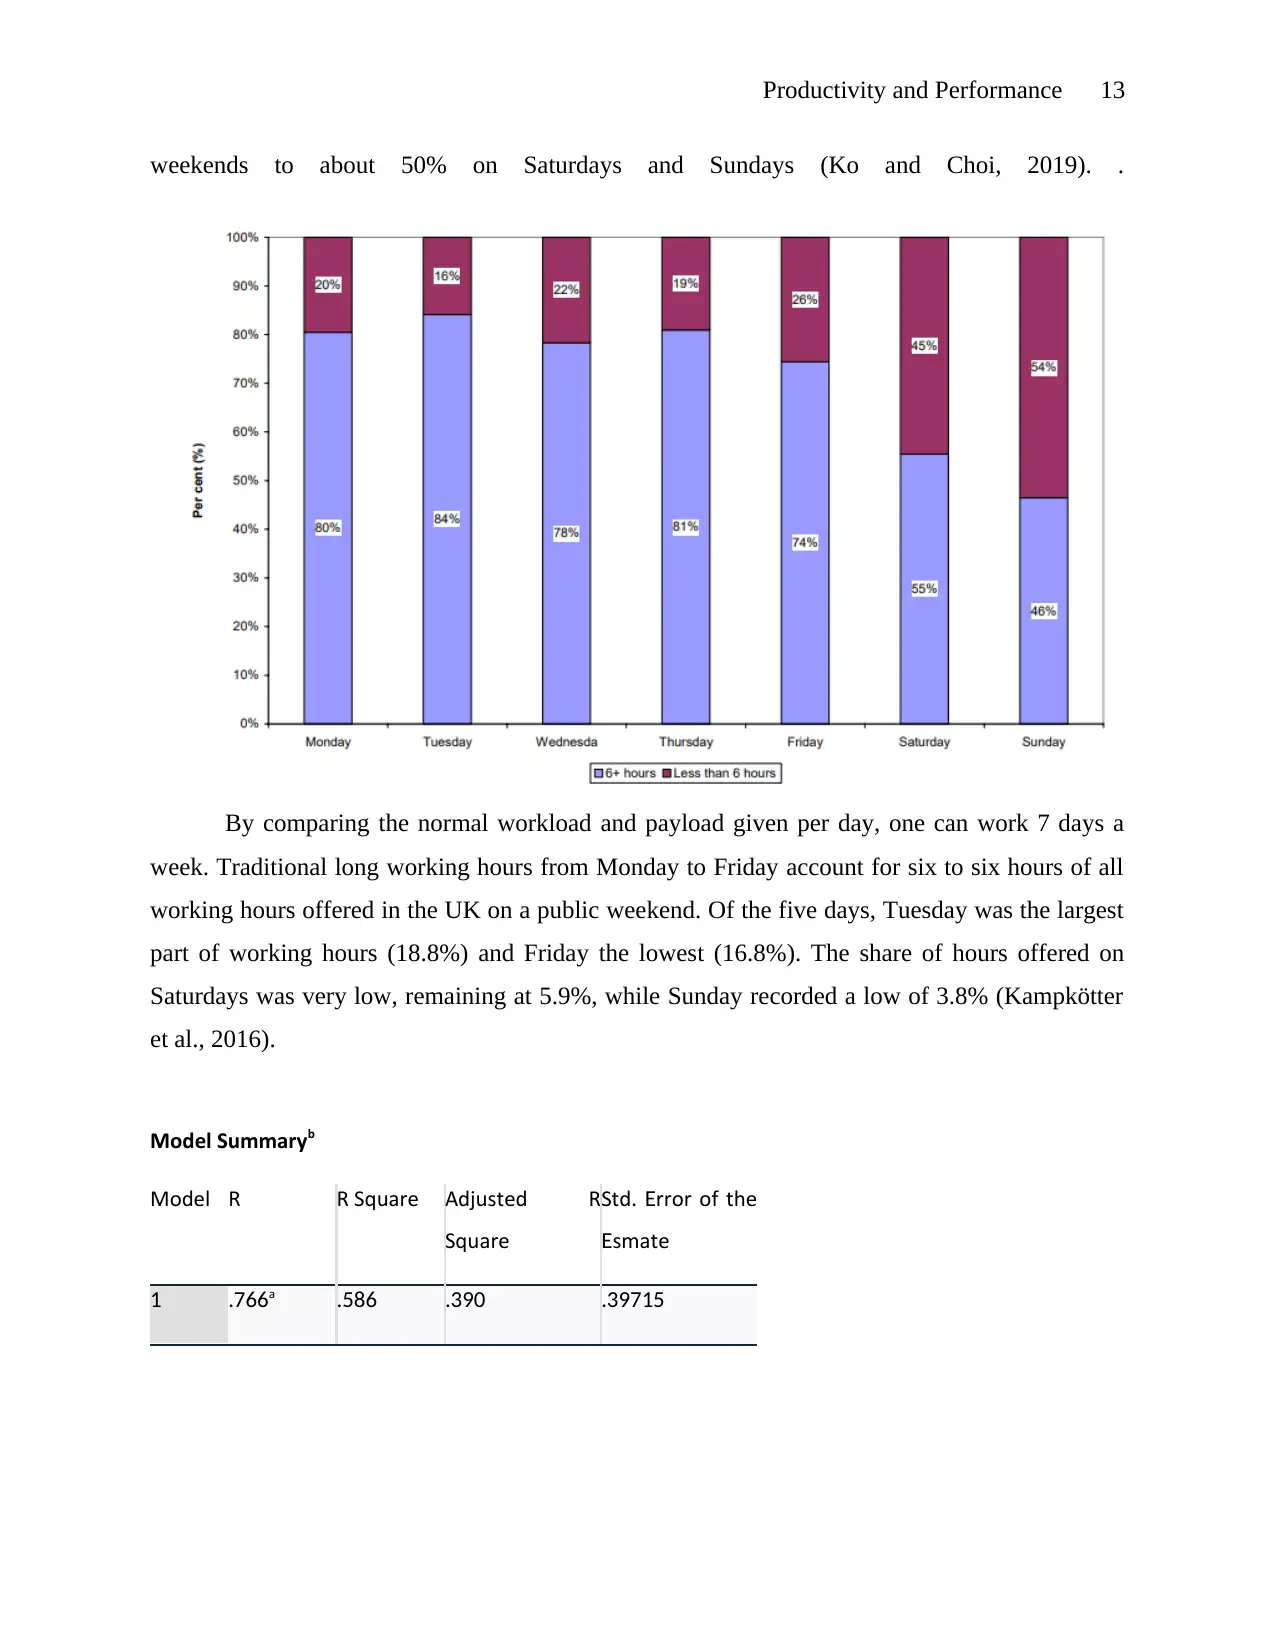
Model Summaryb
Model R R Square Adjusted R
Square
Std rror of the. E
stimateE
1 .766a .586 .390 .39715
weekends to about 50% on Saturdays and Sundays (Ko and Choi, 2019). .
By comparing the normal workload and payload given per day, one can work 7 days a
week. Traditional long working hours from Monday to Friday account for six to six hours of all
working hours offered in the UK on a public weekend. Of the five days, Tuesday was the largest
part of working hours (18.8%) and Friday the lowest (16.8%). The share of hours offered on
Saturdays was very low, remaining at 5.9%, while Sunday recorded a low of 3.8% (Kampkötter
et al., 2016).
Model Summaryb
Model R R Square Adjusted R
Square
Std rror of the. E
stimateE
1 .766a .586 .390 .39715
Secure Best Marks with AI Grader
Need help grading? Try our AI Grader for instant feedback on your assignments.
Productivity and Performance 14
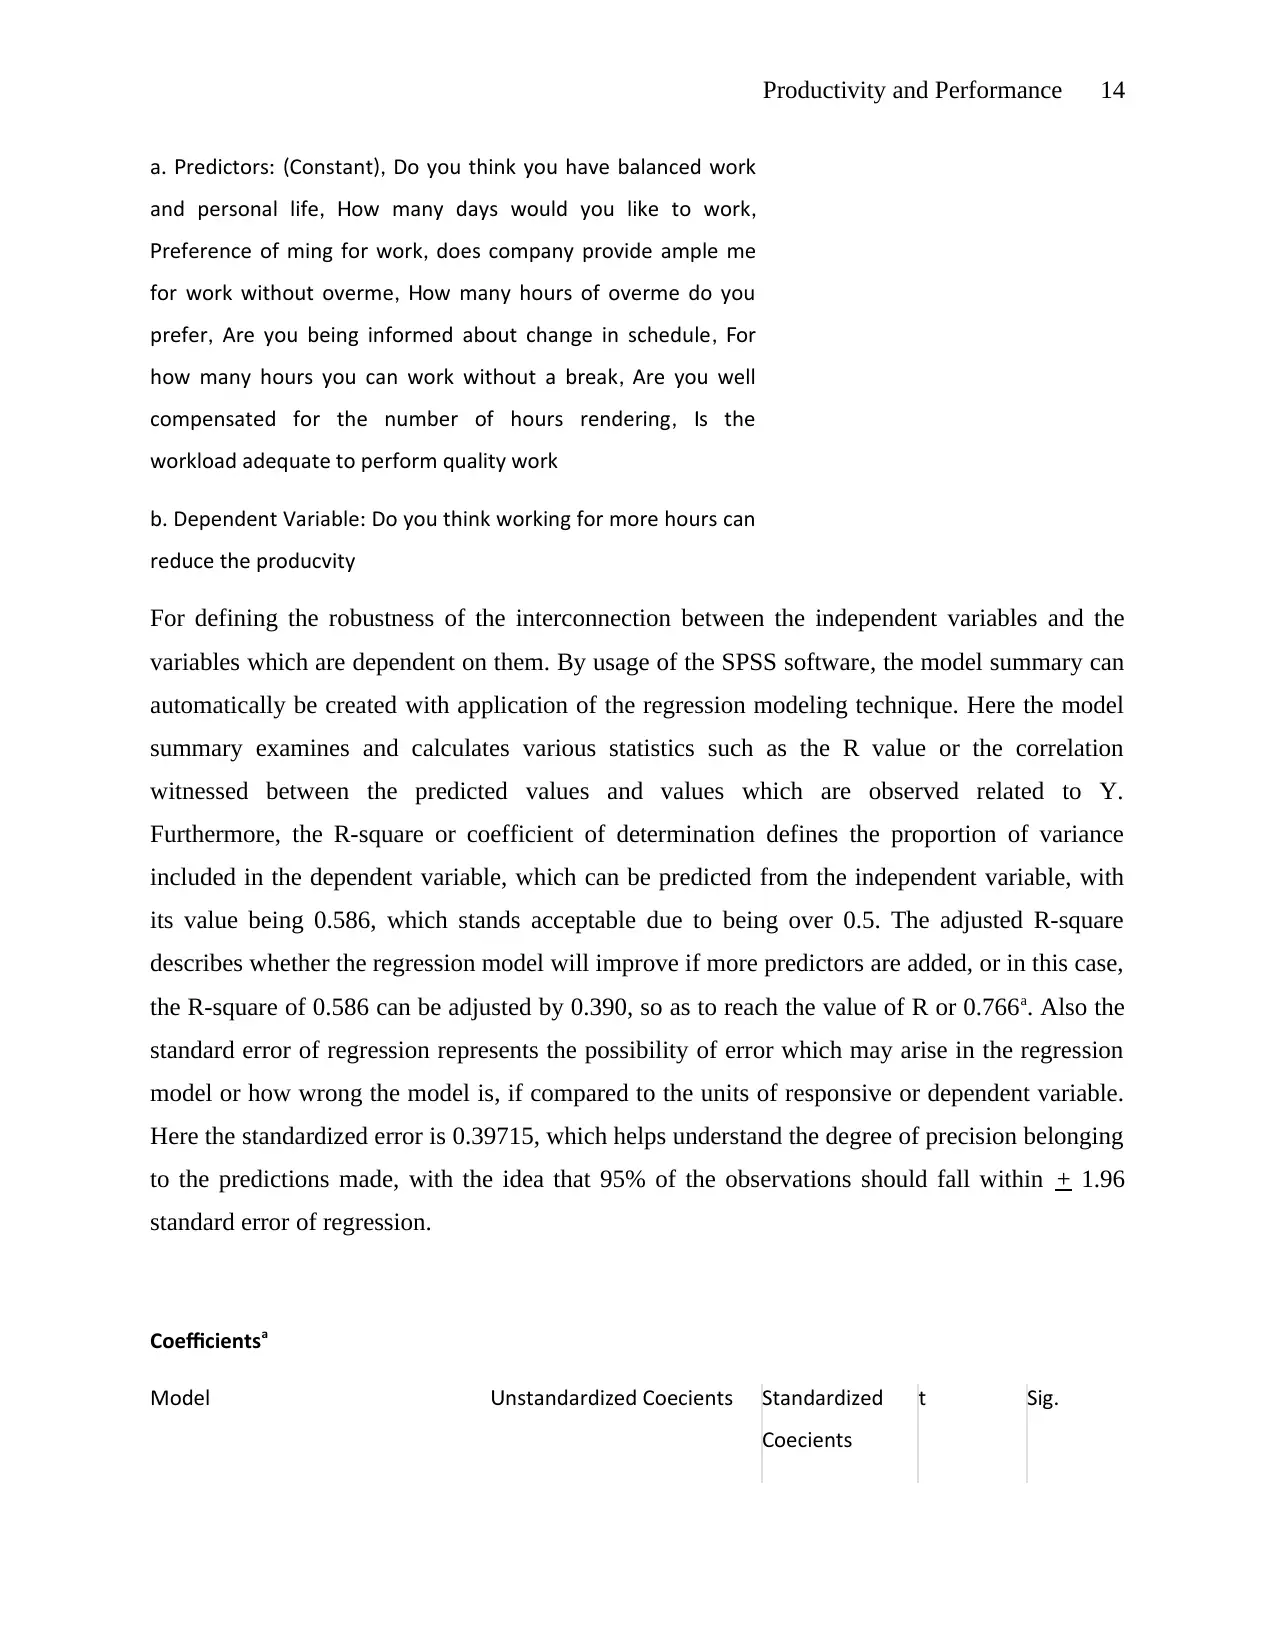
a redictors Constant Do you think you have balanced work. P : ( ),
and personal life ow many days would you like to work, H ,
reference of ti ming for work does company provide ample ti meP ,
for work without overtime ow many hours of overtime do you, H
prefer Are you being informed about change in schedule or, , F
how many hours you can work without a break Are you well,
compensated for the number of hours rendering s the, I
workload adequate to perform quality work
b Dependent Variable Do you think working for more hours can. :
reduce the productivity
For defining the robustness of the interconnection between the independent variables and the
variables which are dependent on them. By usage of the SPSS software, the model summary can
automatically be created with application of the regression modeling technique. Here the model
summary examines and calculates various statistics such as the R value or the correlation
witnessed between the predicted values and values which are observed related to Y.
Furthermore, the R-square or coefficient of determination defines the proportion of variance
included in the dependent variable, which can be predicted from the independent variable, with
its value being 0.586, which stands acceptable due to being over 0.5. The adjusted R-square
describes whether the regression model will improve if more predictors are added, or in this case,
the R-square of 0.586 can be adjusted by 0.390, so as to reach the value of R or 0.766a. Also the
standard error of regression represents the possibility of error which may arise in the regression
model or how wrong the model is, if compared to the units of responsive or dependent variable.
Here the standardized error is 0.39715, which helps understand the degree of precision belonging
to the predictions made, with the idea that 95% of the observations should fall within + 1.96
standard error of regression.
Coefficientsa
Model nstandardized CoefficientsU Standardized
Coefficients
t Sig.
Productivity and Performance 15
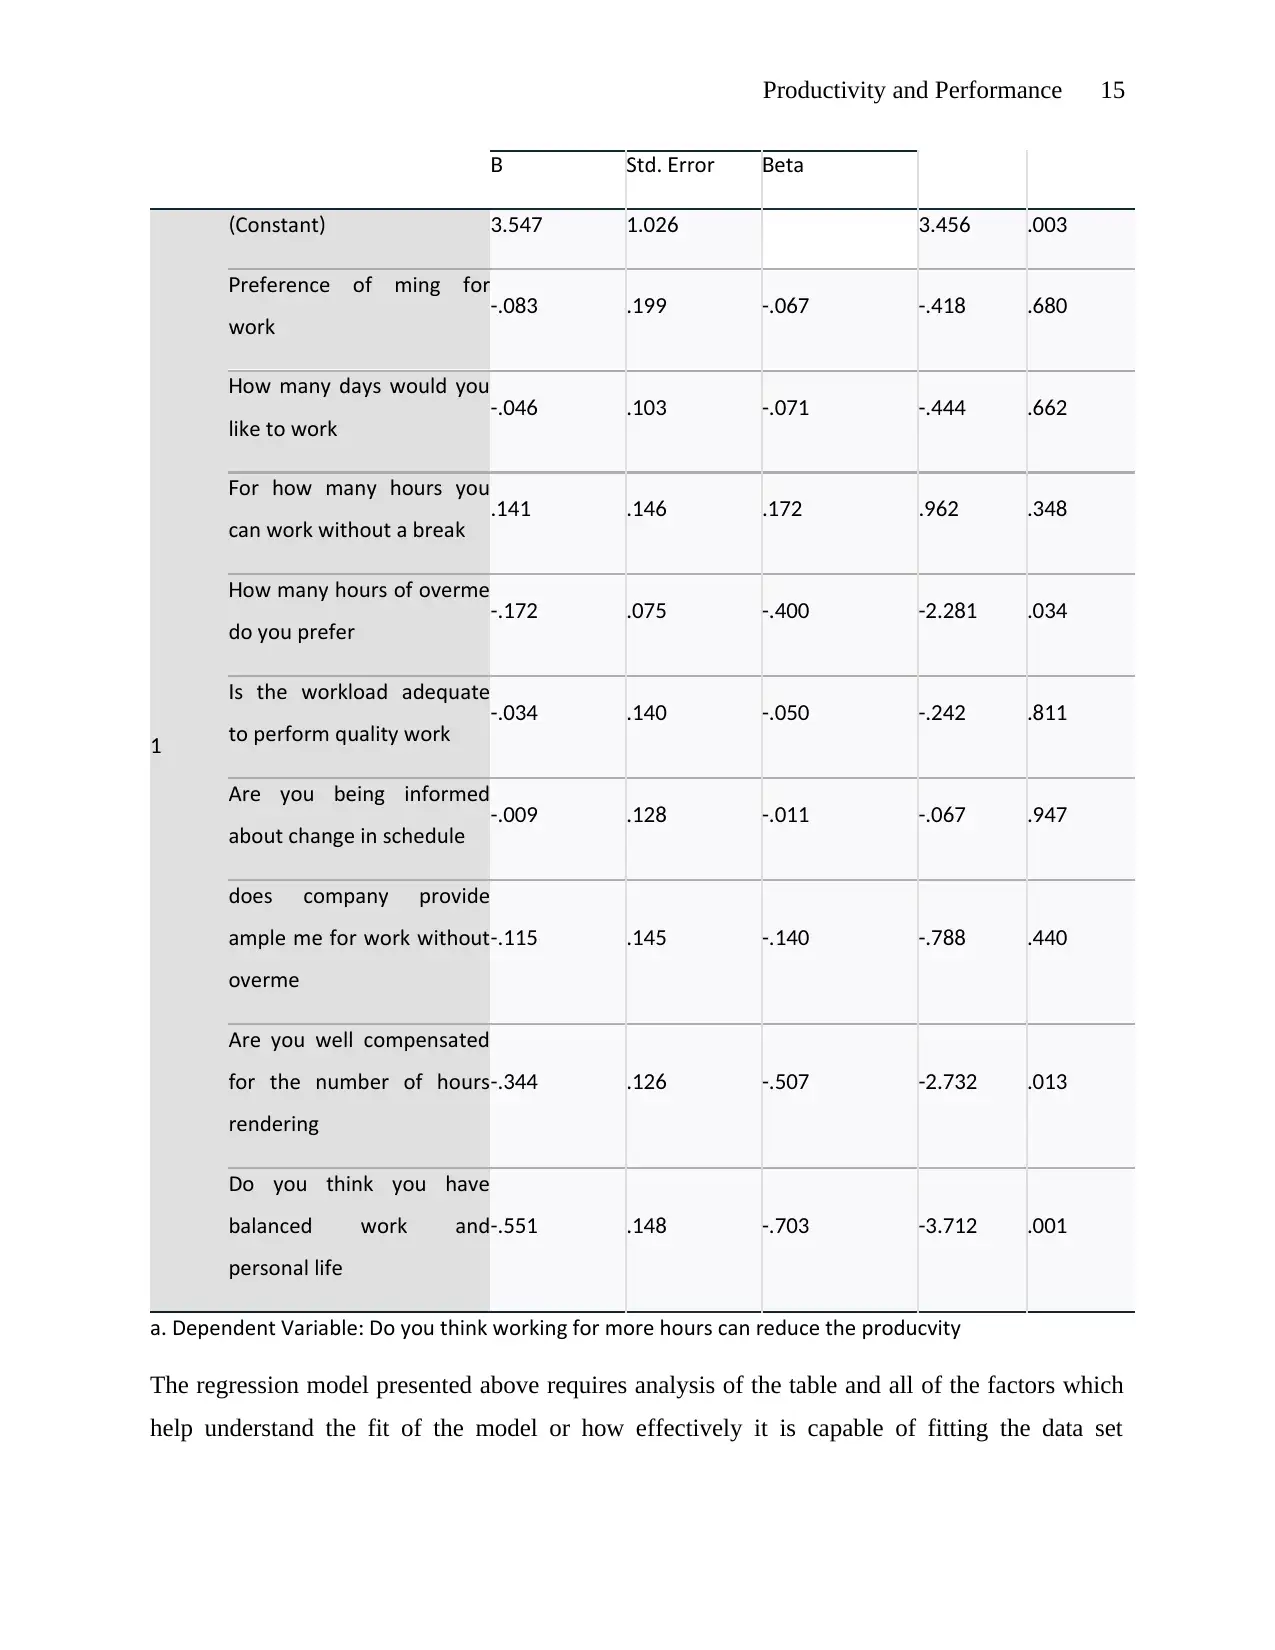
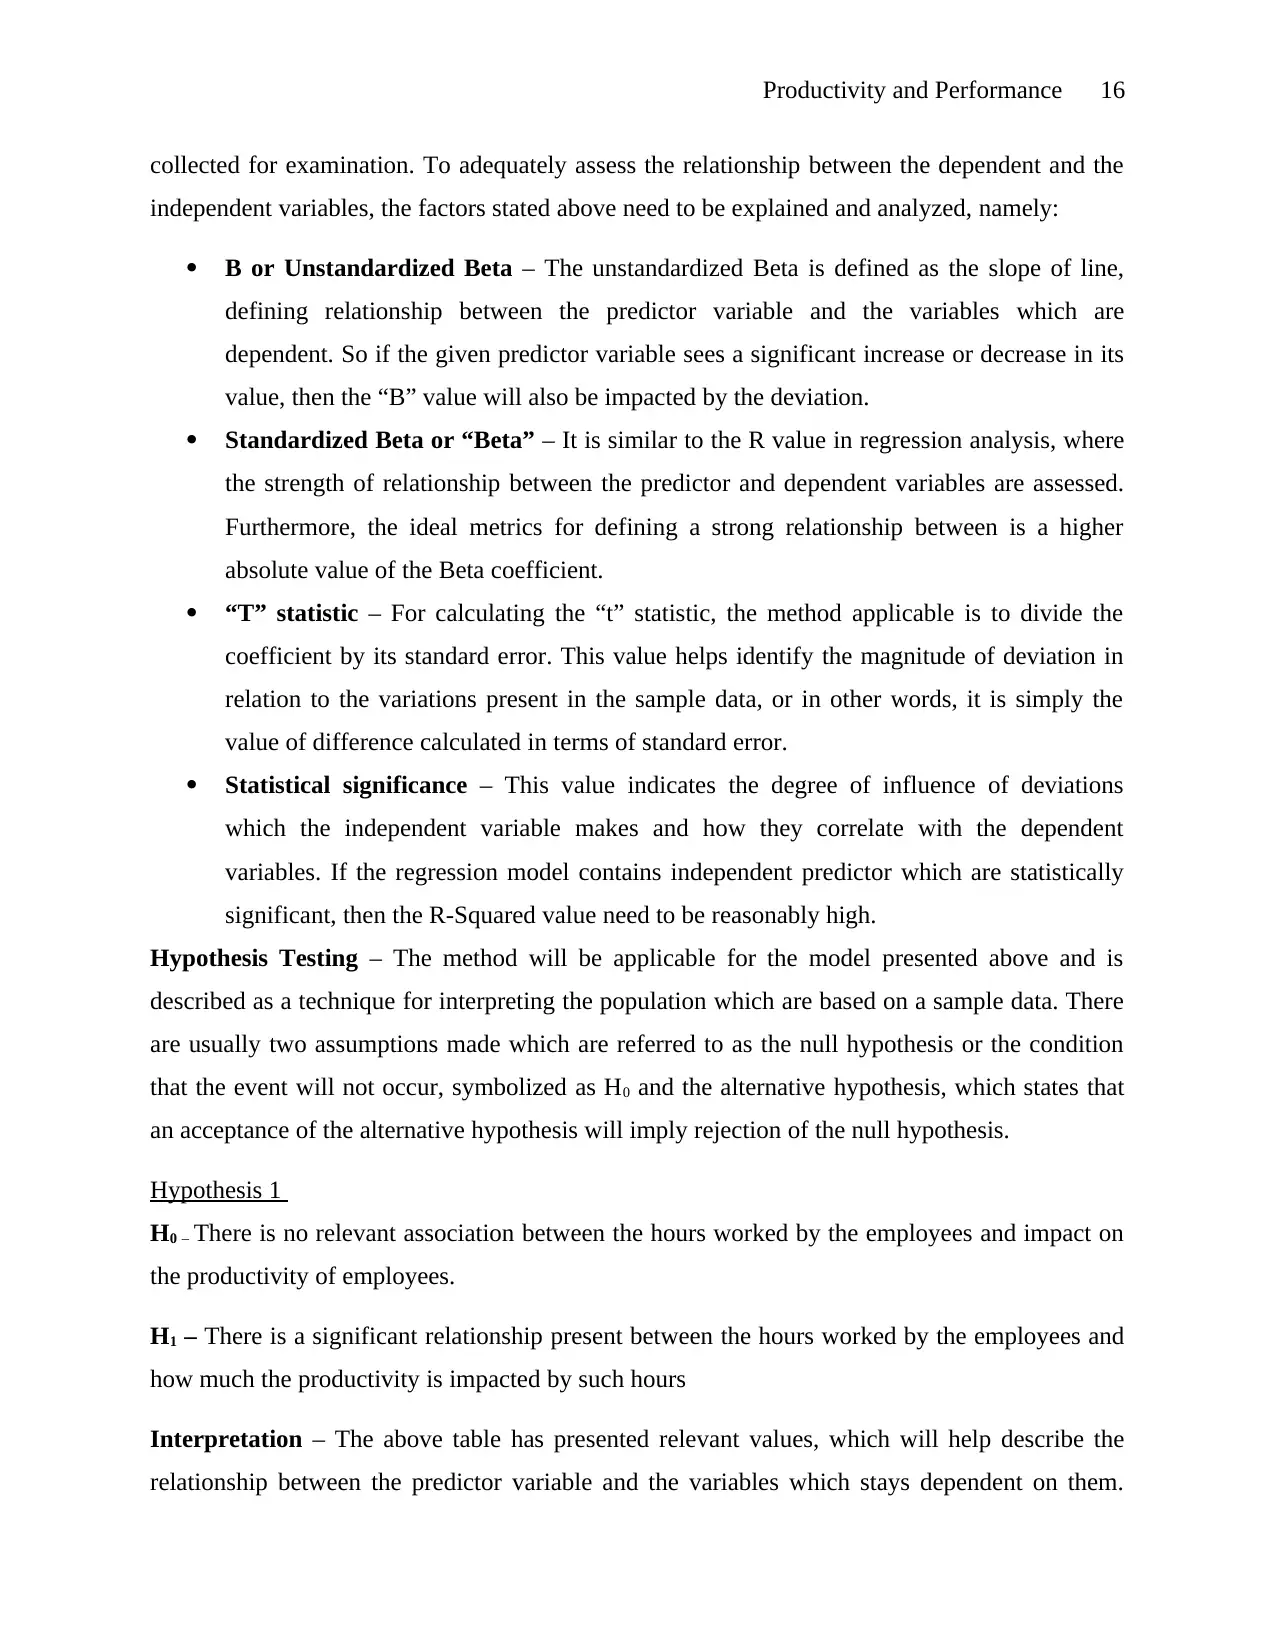
B Std rror. E etaB
1
Constant( ) 3.547 1.026 3.456 .003
reference of ti ming forP
work -.083 .199 -.067 -.418 .680
ow many days would youH
like to work -.046 .103 -.071 -.444 .662
or how many hours youF
can work without a break .141 .146 .172 .962 .348
ow many hours of overtimeH
do you prefer -.172 .075 -.400 -2.281 .034
s the workload adequateI
to perform quality work -.034 .140 -.050 -.242 .811
Are you being informed
about change in schedule -.009 .128 -.011 -.067 .947
does company provide
ample ti me for work without
overtime
-.115 .145 -.140 -.788 .440
Are you well compensated
for the number of hours
rendering
-.344 .126 -.507 -2.732 .013
Do you think you have
balanced work and
personal life
-.551 .148 -.703 -3.712 .001
a Dependent Variable Do you think working for more hours can reduce the productivity. :
The regression model presented above requires analysis of the table and all of the factors which
help understand the fit of the model or how effectively it is capable of fitting the data set
Productivity and Performance 16
collected for examination. To adequately assess the relationship between the dependent and the
independent variables, the factors stated above need to be explained and analyzed, namely:
B or Unstandardized Beta – The unstandardized Beta is defined as the slope of line,
defining relationship between the predictor variable and the variables which are
dependent. So if the given predictor variable sees a significant increase or decrease in its
value, then the “B” value will also be impacted by the deviation.
Standardized Beta or “Beta” – It is similar to the R value in regression analysis, where
the strength of relationship between the predictor and dependent variables are assessed.
Furthermore, the ideal metrics for defining a strong relationship between is a higher
absolute value of the Beta coefficient.
“T” statistic – For calculating the “t” statistic, the method applicable is to divide the
coefficient by its standard error. This value helps identify the magnitude of deviation in
relation to the variations present in the sample data, or in other words, it is simply the
value of difference calculated in terms of standard error.
Statistical significance – This value indicates the degree of influence of deviations
which the independent variable makes and how they correlate with the dependent
variables. If the regression model contains independent predictor which are statistically
significant, then the R-Squared value need to be reasonably high.
Hypothesis Testing – The method will be applicable for the model presented above and is
described as a technique for interpreting the population which are based on a sample data. There
are usually two assumptions made which are referred to as the null hypothesis or the condition
that the event will not occur, symbolized as H0 and the alternative hypothesis, which states that
an acceptance of the alternative hypothesis will imply rejection of the null hypothesis.
Hypothesis 1
H0 – There is no relevant association between the hours worked by the employees and impact on
the productivity of employees.
H1 – There is a significant relationship present between the hours worked by the employees and
how much the productivity is impacted by such hours
Interpretation – The above table has presented relevant values, which will help describe the
relationship between the predictor variable and the variables which stays dependent on them.
Paraphrase This Document
Need a fresh take? Get an instant paraphrase of this document with our AI Paraphraser
Productivity and Performance 17
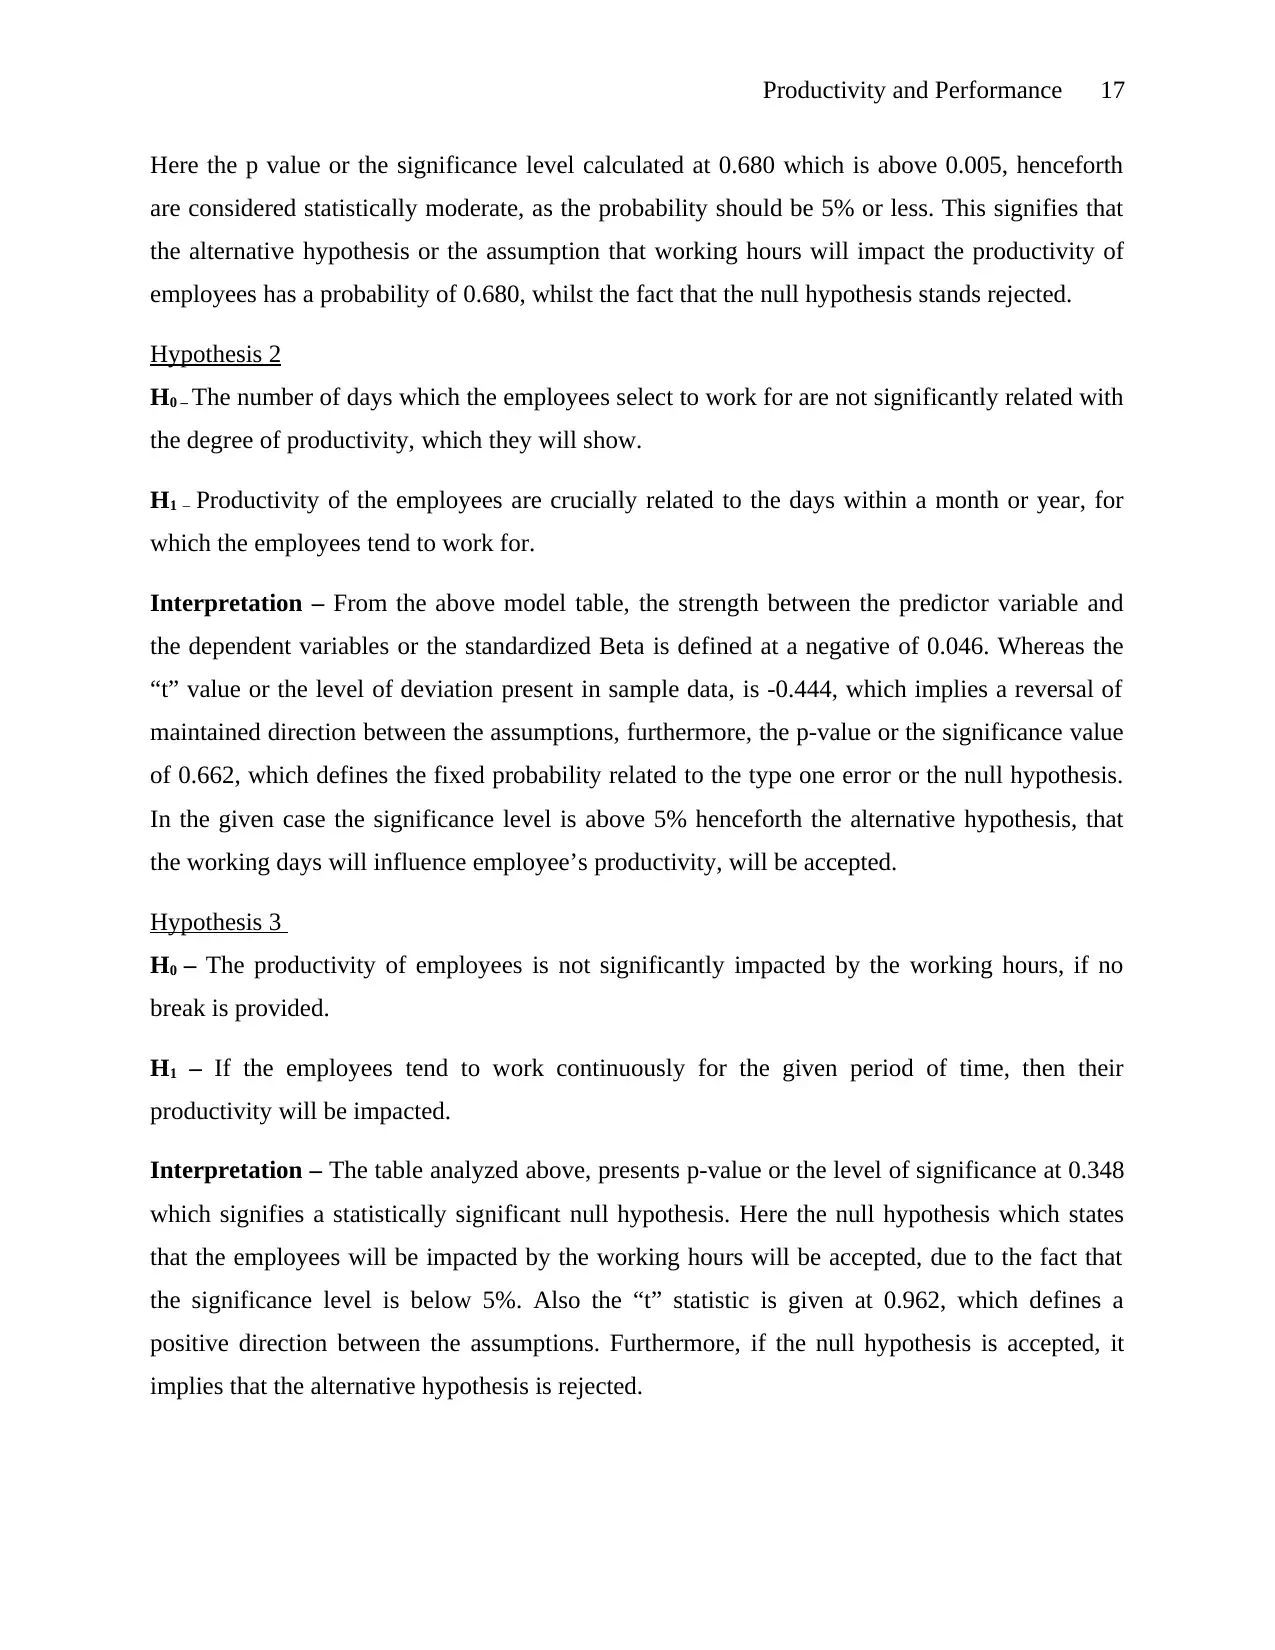
Here the p value or the significance level calculated at 0.680 which is above 0.005, henceforth
are considered statistically moderate, as the probability should be 5% or less. This signifies that
the alternative hypothesis or the assumption that working hours will impact the productivity of
employees has a probability of 0.680, whilst the fact that the null hypothesis stands rejected.
Hypothesis 2
H0 – The number of days which the employees select to work for are not significantly related with
the degree of productivity, which they will show.
H1 – Productivity of the employees are crucially related to the days within a month or year, for
which the employees tend to work for.
Interpretation – From the above model table, the strength between the predictor variable and
the dependent variables or the standardized Beta is defined at a negative of 0.046. Whereas the
“t” value or the level of deviation present in sample data, is -0.444, which implies a reversal of
maintained direction between the assumptions, furthermore, the p-value or the significance value
of 0.662, which defines the fixed probability related to the type one error or the null hypothesis.
In the given case the significance level is above 5% henceforth the alternative hypothesis, that
the working days will influence employee’s productivity, will be accepted.
Hypothesis 3
H0 – The productivity of employees is not significantly impacted by the working hours, if no
break is provided.
H1 – If the employees tend to work continuously for the given period of time, then their
productivity will be impacted.
Interpretation – The table analyzed above, presents p-value or the level of significance at 0.348
which signifies a statistically significant null hypothesis. Here the null hypothesis which states
that the employees will be impacted by the working hours will be accepted, due to the fact that
the significance level is below 5%. Also the “t” statistic is given at 0.962, which defines a
positive direction between the assumptions. Furthermore, if the null hypothesis is accepted, it
implies that the alternative hypothesis is rejected.
Productivity and Performance 18
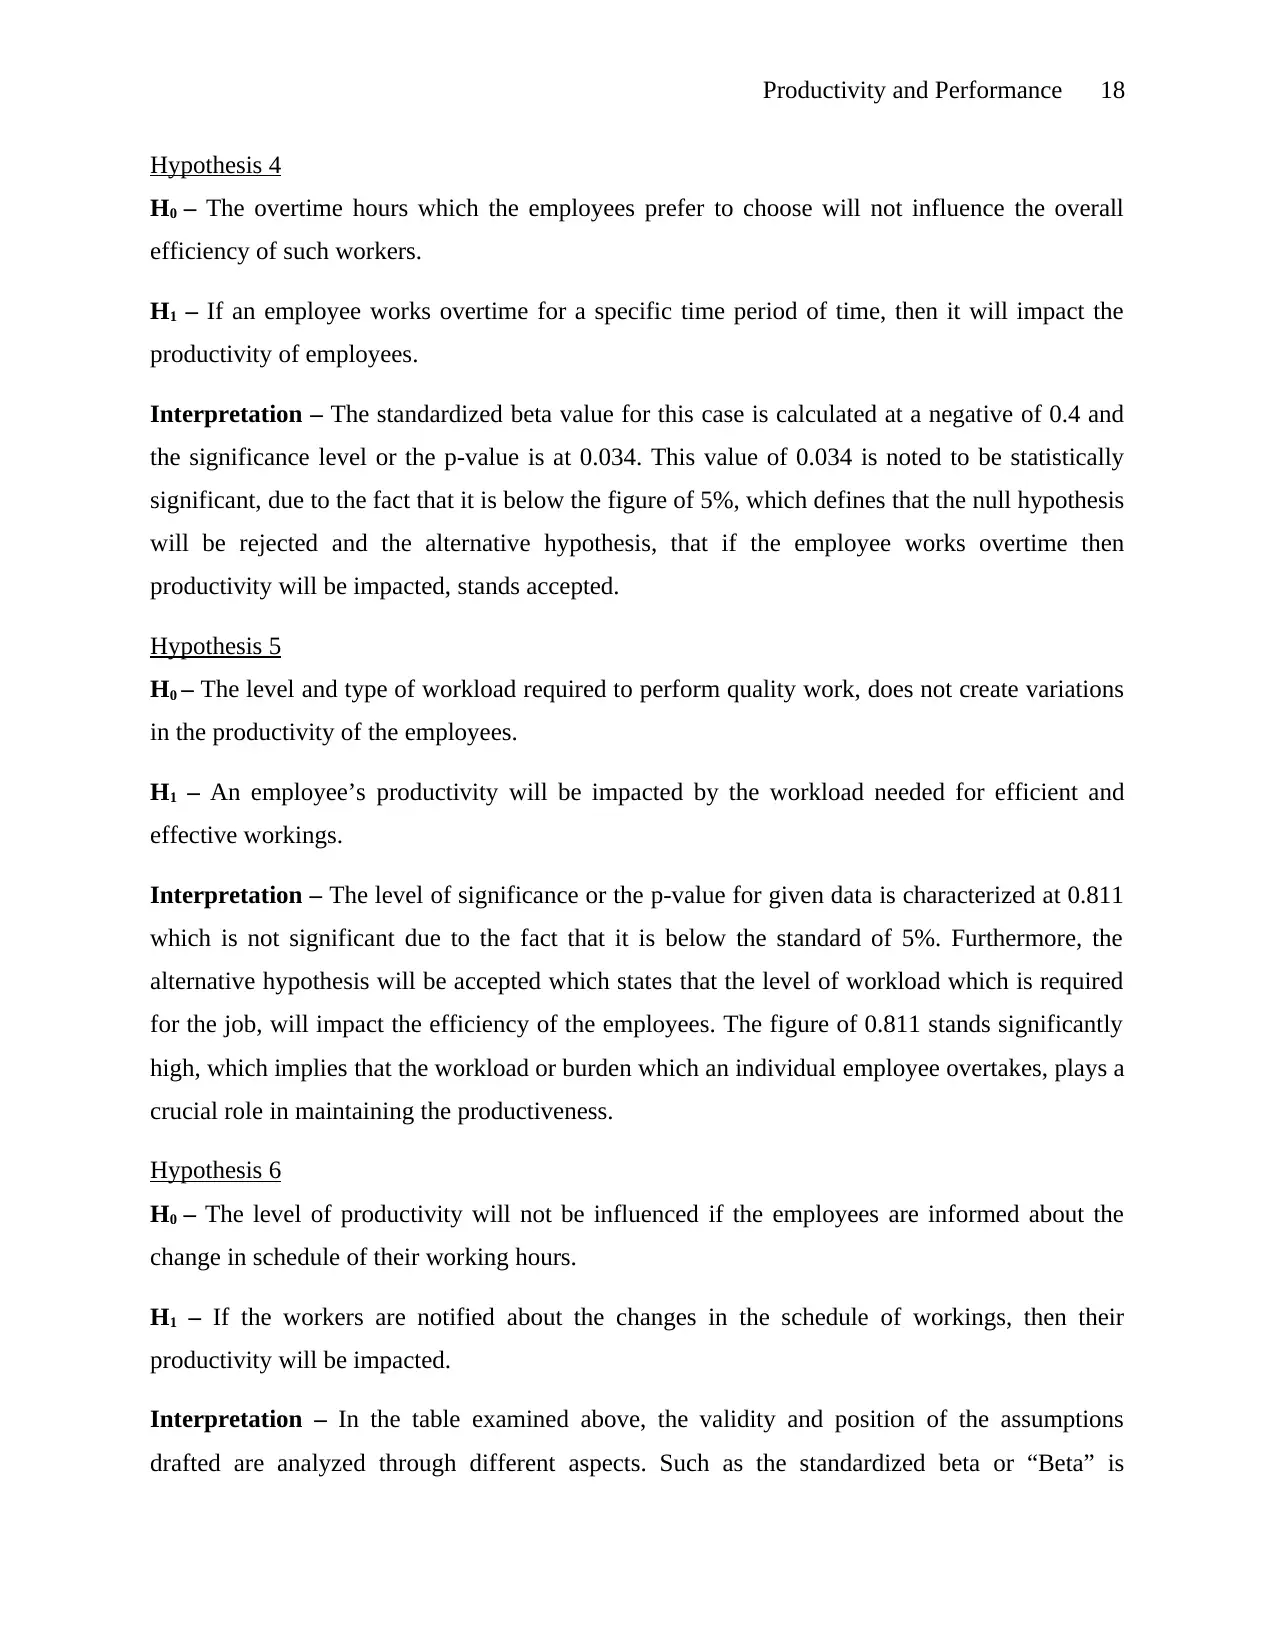
Hypothesis 4
H0 – The overtime hours which the employees prefer to choose will not influence the overall
efficiency of such workers.
H1 – If an employee works overtime for a specific time period of time, then it will impact the
productivity of employees.
Interpretation – The standardized beta value for this case is calculated at a negative of 0.4 and
the significance level or the p-value is at 0.034. This value of 0.034 is noted to be statistically
significant, due to the fact that it is below the figure of 5%, which defines that the null hypothesis
will be rejected and the alternative hypothesis, that if the employee works overtime then
productivity will be impacted, stands accepted.
Hypothesis 5
H0 – The level and type of workload required to perform quality work, does not create variations
in the productivity of the employees.
H1 – An employee’s productivity will be impacted by the workload needed for efficient and
effective workings.
Interpretation – The level of significance or the p-value for given data is characterized at 0.811
which is not significant due to the fact that it is below the standard of 5%. Furthermore, the
alternative hypothesis will be accepted which states that the level of workload which is required
for the job, will impact the efficiency of the employees. The figure of 0.811 stands significantly
high, which implies that the workload or burden which an individual employee overtakes, plays a
crucial role in maintaining the productiveness.
Hypothesis 6
H0 – The level of productivity will not be influenced if the employees are informed about the
change in schedule of their working hours.
H1 – If the workers are notified about the changes in the schedule of workings, then their
productivity will be impacted.
Interpretation – In the table examined above, the validity and position of the assumptions
drafted are analyzed through different aspects. Such as the standardized beta or “Beta” is
Productivity and Performance 19
calculated at -0.011 and the t-statistic or the value of difference is defined as -0.067. Moreover,
the p-value or the degree of significance is defined at 0.947, which also lies way ahead of the
bench mark set at 5%. Hence, the alternative hypothesis, that the change in schedule of working
hours will impact the overall productivity of an employee, will be accepted, with the null
hypothesis being false.
Hypothesis 7
H0 – If the company provides ample time for the work to be performed by the employees, then
their productivity will not be deviated from the bench mark set.
H1 – The timings of the company will impact the productivity of the employees, even when it is
not labelled as overtime hours.
Interpretation – The value of significance is defined as 0.440, which is below the average of
5%, henceforth the null hypothesis should be accepted, stating that the timings of the company
holds the capacity to impact an employee’s productivity, even if the same is not included in the
overtime hours. The t-statistic is defined from a negative value of 0.788, whereas the
standardized beta value is calculated at -0.140, which states the relationship between the
predictor value and the dependent variables.
Hypothesis 8
H0 – The productivity of workers in the company will not be impacted by the fact that employees
are adequately compensated by the number of hours worked.
H1 – In case the employees are fully or partially compensated for the work they perform, then it
will influence the productivity.
Interpretation – For the given case the significance value defined for the null hypothesis or the
assumption that the productivity of the employees is not based on the idea that they are
compensated for the work performed, is calculated at 0.013, which is critical or significant
statistically. The value lies below the standard of 5%, therefore, it can be said that the null
hypothesis is accepted and the alternative hypothesis remains rejected. Also the standardized
beta is calculated at a negative of 0.507, while the t-statistic stands at 2.732, both defining an
adverse value of the provided assumption.
Secure Best Marks with AI Grader
Need help grading? Try our AI Grader for instant feedback on your assignments.
Productivity and Performance 20
Hypothesis 9
H0 – The presence of proper work life balance for the employees will not affect the productivity
factor in the job.
H1 – The work life balance will impact adversely or favorably impact the efficiency of
employees.
Interpretation – For this variable, the significance value to address the impact of null
hypothesis, is defined as 0.001, where the null hypothesis states that the presence of proper work
life balance will not impact the productivity, which the employees will showcase in their relevant
roles. Due to the p-value being below 5%, that is 0.001, therefore, the null hypothesis should be
accepted and as a result the alternative assumption or hypothesis will remain unaccepted.
Moreover, the t statistic is presented at 3.712 and the standardized beta value is at a negative of
0.0703.
Productivity and Performance 21
CONCLUSION
In a related report that analyses the relationship between job suitability and employee self-
examination performance, executives who plan more reasonable or better work trials for their
employees were associated with higher radical productivity. He insists on the "strong" view that
the universal race can increase productivity through such work, which creates a ground for a
"shared benefit" environment. It rejects the more "cynical" notion that organisations are faced
with compromises in which more competition must actually come at the cost of a reduced work /
life balance. However, the positive correlation between high productivity and overall work / life
arrangements was lost when controlled for panel testing. That is, work / life experiences
generally demonstrate better management practices and a better environment for organisational
employees, and make them more productive. In any case, the lack of a negative correlation
between reasonable work options and productivity may justify the cost of making more cost-
effective adaptations based on labour government assistance.
Productivity and Performance 22
REFERENCE LIST
Mahmood, Y.N., Raewf, M.B. and AL-Hamadany, Z.S., 2019. A study on the perceptual
relationship between overtime and output. Cihan University-Erbil Journal of Humanities
and Social Sciences, 3(1), pp.27-31.
Darmawan, D., Mardikaningsih, R., Sinambela, E.A., Arifin, S., Putra, A.R., Hariani, M., Al
Hakim, Y.R. and Irfan, M., 2020. The Quality of Human Resources, Job Performance
and Employee Loyalty. International Journal of Psychosocial Rehabilitation, 24(3),
pp.2580-2592.
Asamani, J.A., Naab, F., Ofei, A.M.A. and Addo, R., 2016. Do leadership styles influence
productivity?. British Journal of Healthcare Management, 22(2), pp.83-91.
Ishizaka, A. and Pereira, V.E., 2016. Portraying an employee performance management system
based on multi-criteria decision analysis and visual techniques. International Journal of
Manpower.
Nguyen, T.L., 2016. Building human resources management capacity for university research:
The case at four leading Vietnamese universities. Higher Education, 71(2), pp.231-251.
Naoum, S.G., 2016. Factors influencing labour productivity on construction sites: A state-of-the-
art literature review and a survey. International journal of productivity and performance
management.
Ko, Y.J. and Choi, J.N., 2019. Overtime work as the antecedent of employee satisfaction, firm
productivity, and innovation. Journal of Organisational Behavior, 40(3), pp.282-295.
Radant, O., Colomo-Palacios, R. and Stantchev, V., 2016. Factors for the management of scarce
human resources and highly skilled employees in IT-departments: a systematic
review. Journal of Information Technology Research (JITR), 9(1), pp.65-82.
Kampkötter, P., Mohrenweiser, J., Sliwka, D., Steffes, S. and Wolter, S., 2016, August.
Measuring the use of human resources practices and employee attitudes: the linked
personnel panel. In Evidence-based HRM: a Global Forum for Empirical Scholarship.
Emerald Group Publishing Limited.
Katou, A.A., 2017. How does human resource management influence organisational
performance? An integrative approach-based analysis. International Journal of
Productivity and Performance Management.
Paraphrase This Document
Need a fresh take? Get an instant paraphrase of this document with our AI Paraphraser
Productivity and Performance 23
Durdyev, S., Ismail, S. and Kandymov, N., 2018. Structural equation model of the factors
affecting construction labour productivity. Journal of Construction Engineering and
Management, 144(4), p.04018007.
Lasisi, T.T., Ozturen, A., Eluwole, K.K. and Avci, T., 2020. Explicating innovation-based
human resource management's influence on employee satisfaction and
performance. Employee Relations: The International Journal.
Kumatongo, B. and Muzata, K.K., 2021. Research Paradigms and Designs with their Application
in Education. Journal of Lexicography and Terminology (Online ISSN 2664-0899. Print
ISSN 2517-9306)., 5(1), pp.16-32.
Coates, A., 2021. The prevalence of philosophical assumptions described in mixed methods
research in education. Journal of Mixed Methods Research, 15(2), pp.171-189.
Gonsalves, L., Wyss, K., Cresswell, J.A., Waithaka, M., Gichangi, P. and Hilber, A.M., 2020.
Mixed-methods study on pharmacies as contraception providers to Kenyan young people:
who uses them and why?. BMJ open, 10(7), p.e034769.
Cresswell, A.K., Ryan, N.M., Heyward, A.J., Smith, A.N., Colquhoun, J., Case, M., Birt, M.J.,
Chinkin, M., Wyatt, M., Radford, B. and Costello, P., 2021. A quantitative comparison of
towed-camera and diver-camera transects for monitoring coral reefs. PeerJ, 9, p.e11090.

Productivity and Performance 24
APPENDICES
APPENDICES
1 out of 27
Related Documents


Your All-in-One AI-Powered Toolkit for Academic Success.
+13062052269
info@desklib.com
Available 24*7 on WhatsApp / Email
![[object Object]](/_next/static/media/star-bottom.7253800d.svg)
Unlock your academic potential
© 2024 | Zucol Services PVT LTD | All rights reserved.