Detailed Report on Performance Analysis and Simulation (Accounting)
VerifiedAdded on 2023/06/05
|15
|3132
|149
Report
AI Summary
This report provides a detailed performance analysis and simulation in the context of accounting, focusing on business decision-making. It evaluates the continuous growth in sales and revenue achieved by Digby and Ferris through strategic decisions and planning, highlighting the importance of improving profitability through effective resource utilization. The report also discusses the efficient utilization of assets, the impact of managing sales growth, and the consequences of failing to improve asset turnover ratio. It emphasizes the significance of efficient fund management and the importance of managing free cash flows. Furthermore, the report evaluates stock performance over the years, analyzes the importance of achieving sustainable growth, managing cash effectively, and working capital. It concludes by highlighting the need for flexibility in response to changing circumstances, with references to relevant academic sources. Desklib offers a variety of resources for students, including past papers and solved assignments.
Running head: PERFORMANCE ANALYSIS AND SIMULATION (ACCOUNTING)
Performance Analysis and Simulation (Accounting)
Name of the Student:
Name of the University:
Authors Note:
Performance Analysis and Simulation (Accounting)
Name of the Student:
Name of the University:
Authors Note:
Paraphrase This Document
Need a fresh take? Get an instant paraphrase of this document with our AI Paraphraser
1PERFORMANCE ANALYSIS AND SIMULATION (ACCOUNTING)
Contents
Section 2: Reflection on lessons learnt about business decision making:.......................................2
Evaluating stock performance of over the years:............................................................................7
References:....................................................................................................................................11
2PERFORMANCE ANALYSIS AND SIMULATION (ACCOUNTING)
Section 2: Reflection on lessons learnt about business decision making:
In order to conduct performance analysis of different entities individually and
comparatively, it is essential to have relevant data about their performance for a particular period
(Reboredo and Ugolini, 2016). Based on the financial information about the entities performance
and position as on a particular date, a detailed analysis of their performance individually, i.e.
how the entity has performed over the years. In case of comparative performance analysis, the
performances of different entities are compared to find out who has performed better
comparatively (Ballings et. al. 2015).
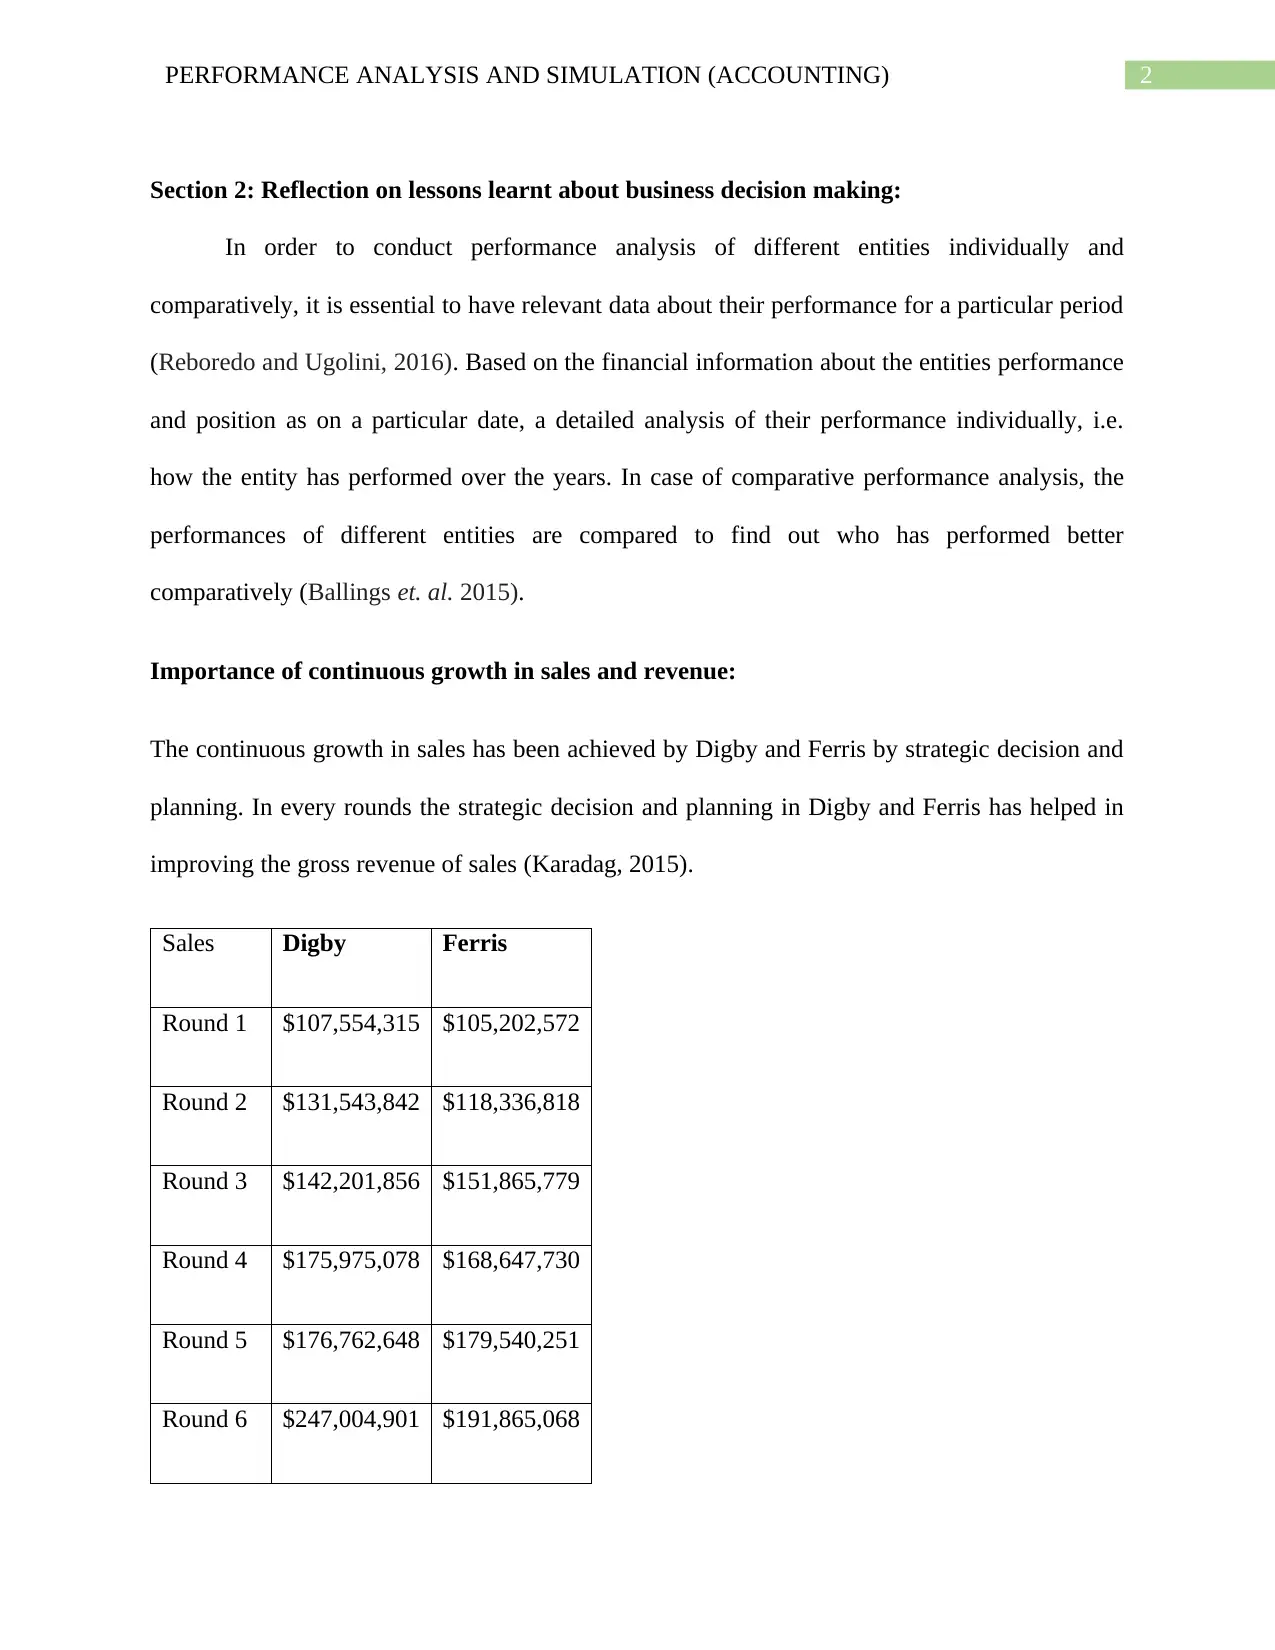
Importance of continuous growth in sales and revenue:
The continuous growth in sales has been achieved by Digby and Ferris by strategic decision and
planning. In every rounds the strategic decision and planning in Digby and Ferris has helped in
improving the gross revenue of sales (Karadag, 2015).
Sales Digby Ferris
Round 1 $107,554,315 $105,202,572
Round 2 $131,543,842 $118,336,818
Round 3 $142,201,856 $151,865,779
Round 4 $175,975,078 $168,647,730
Round 5 $176,762,648 $179,540,251
Round 6 $247,004,901 $191,865,068
Section 2: Reflection on lessons learnt about business decision making:
In order to conduct performance analysis of different entities individually and
comparatively, it is essential to have relevant data about their performance for a particular period
(Reboredo and Ugolini, 2016). Based on the financial information about the entities performance
and position as on a particular date, a detailed analysis of their performance individually, i.e.
how the entity has performed over the years. In case of comparative performance analysis, the
performances of different entities are compared to find out who has performed better
comparatively (Ballings et. al. 2015).
Importance of continuous growth in sales and revenue:
The continuous growth in sales has been achieved by Digby and Ferris by strategic decision and
planning. In every rounds the strategic decision and planning in Digby and Ferris has helped in
improving the gross revenue of sales (Karadag, 2015).
Sales Digby Ferris
Round 1 $107,554,315 $105,202,572
Round 2 $131,543,842 $118,336,818
Round 3 $142,201,856 $151,865,779
Round 4 $175,975,078 $168,647,730
Round 5 $176,762,648 $179,540,251
Round 6 $247,004,901 $191,865,068
⊘ This is a preview!⊘
Do you want full access?
Subscribe today to unlock all pages.
Trusted by 1+ million students worldwide
3PERFORMANCE ANALYSIS AND SIMULATION (ACCOUNTING)
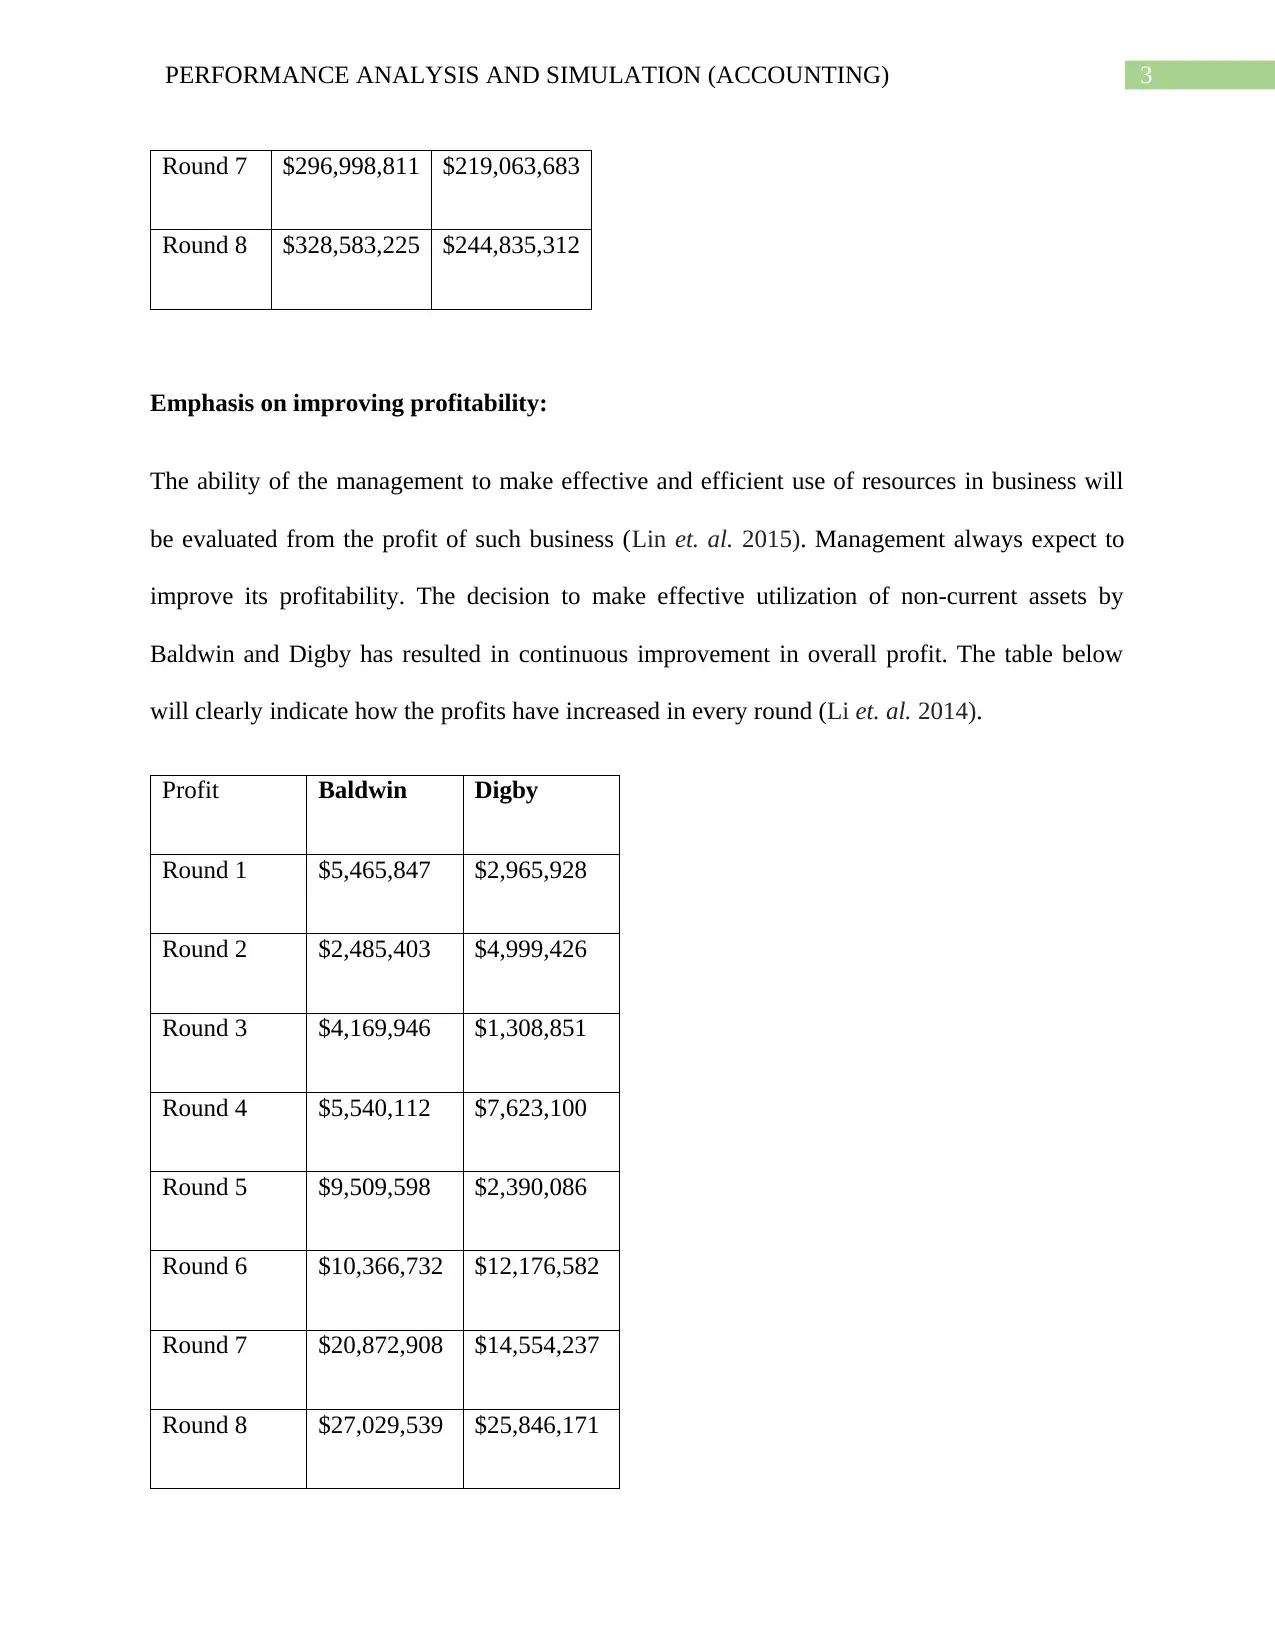
Round 7 $296,998,811 $219,063,683
Round 8 $328,583,225 $244,835,312
Emphasis on improving profitability:
The ability of the management to make effective and efficient use of resources in business will
be evaluated from the profit of such business (Lin et. al. 2015). Management always expect to
improve its profitability. The decision to make effective utilization of non-current assets by
Baldwin and Digby has resulted in continuous improvement in overall profit. The table below
will clearly indicate how the profits have increased in every round (Li et. al. 2014).
Profit Baldwin Digby
Round 1 $5,465,847 $2,965,928
Round 2 $2,485,403 $4,999,426
Round 3 $4,169,946 $1,308,851
Round 4 $5,540,112 $7,623,100
Round 5 $9,509,598 $2,390,086
Round 6 $10,366,732 $12,176,582
Round 7 $20,872,908 $14,554,237
Round 8 $27,029,539 $25,846,171
Paraphrase This Document
Need a fresh take? Get an instant paraphrase of this document with our AI Paraphraser
4PERFORMANCE ANALYSIS AND SIMULATION (ACCOUNTING)
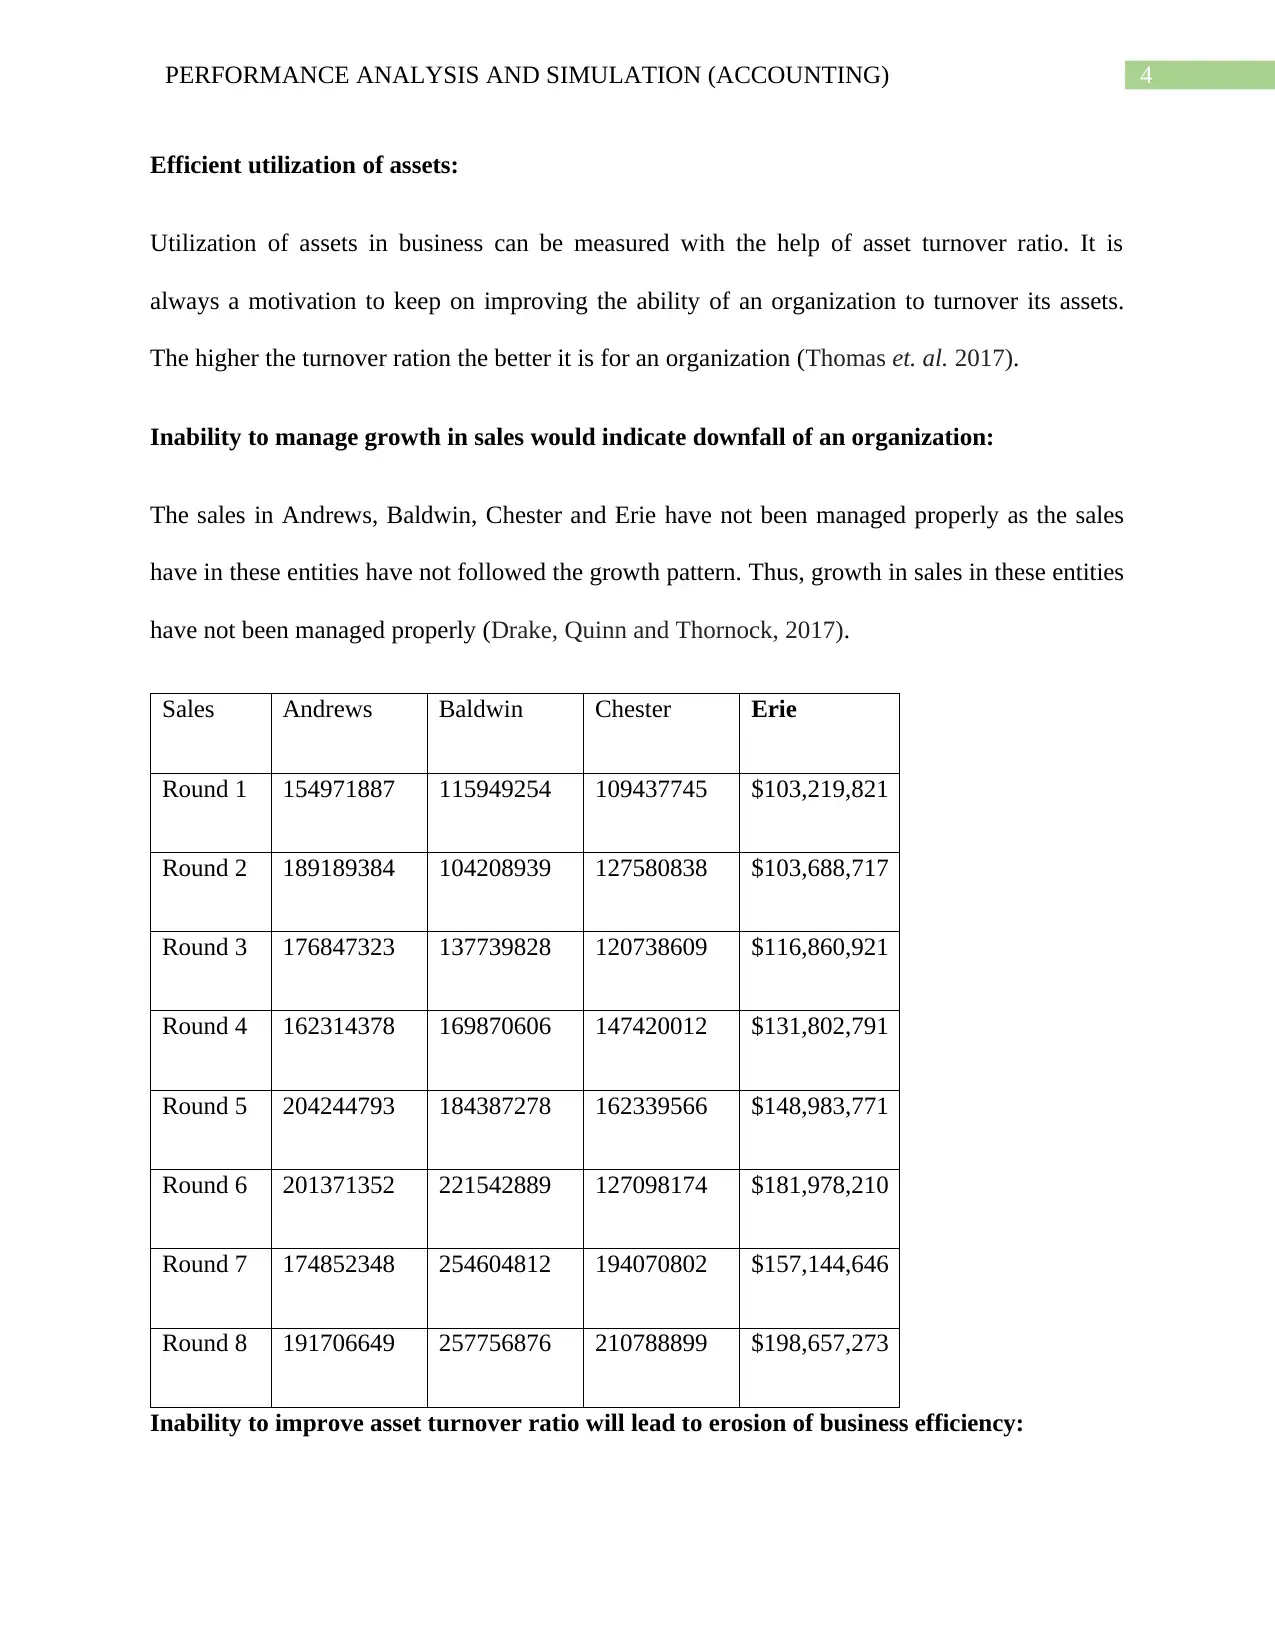
Efficient utilization of assets:
Utilization of assets in business can be measured with the help of asset turnover ratio. It is
always a motivation to keep on improving the ability of an organization to turnover its assets.
The higher the turnover ration the better it is for an organization (Thomas et. al. 2017).
Inability to manage growth in sales would indicate downfall of an organization:
The sales in Andrews, Baldwin, Chester and Erie have not been managed properly as the sales
have in these entities have not followed the growth pattern. Thus, growth in sales in these entities
have not been managed properly (Drake, Quinn and Thornock, 2017).
Sales Andrews Baldwin Chester Erie
Round 1 154971887 115949254 109437745 $103,219,821
Round 2 189189384 104208939 127580838 $103,688,717
Round 3 176847323 137739828 120738609 $116,860,921
Round 4 162314378 169870606 147420012 $131,802,791
Round 5 204244793 184387278 162339566 $148,983,771
Round 6 201371352 221542889 127098174 $181,978,210
Round 7 174852348 254604812 194070802 $157,144,646
Round 8 191706649 257756876 210788899 $198,657,273
Inability to improve asset turnover ratio will lead to erosion of business efficiency:
5PERFORMANCE ANALYSIS AND SIMULATION (ACCOUNTING)
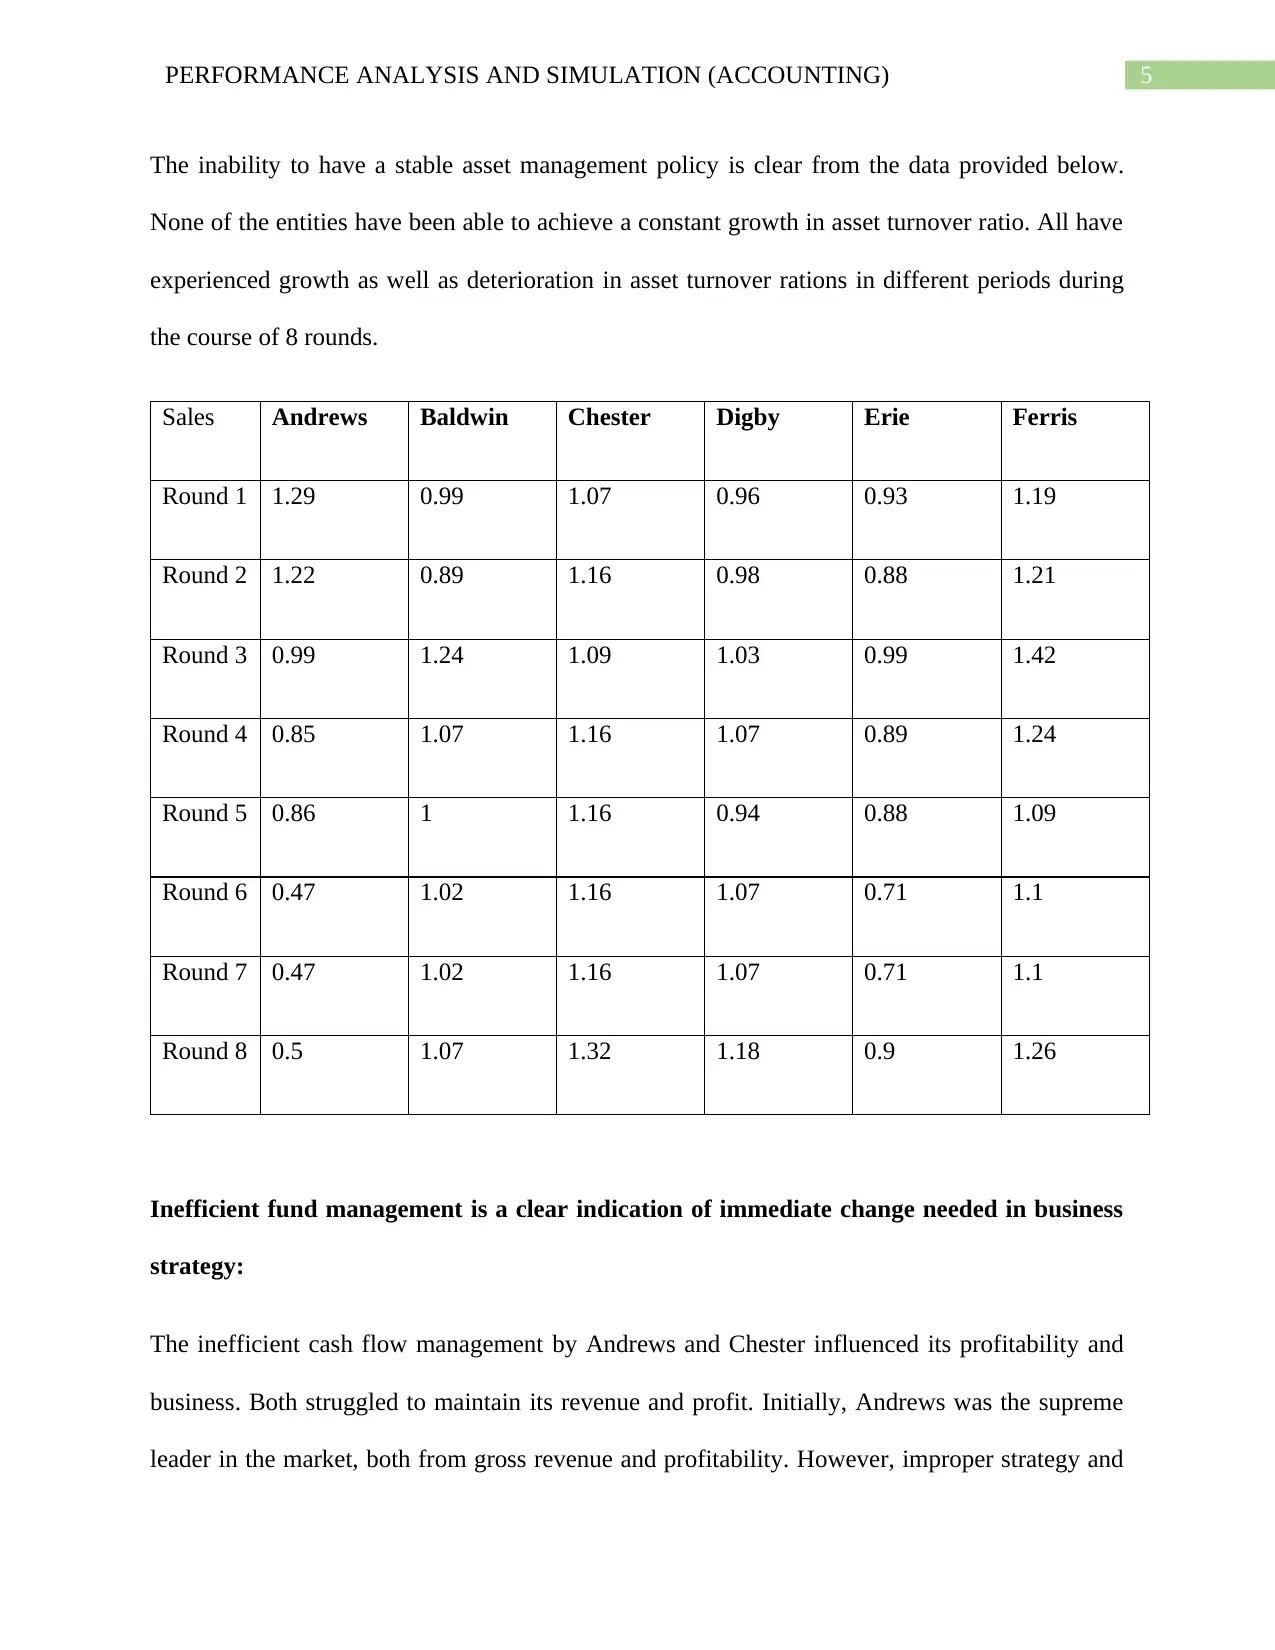
The inability to have a stable asset management policy is clear from the data provided below.
None of the entities have been able to achieve a constant growth in asset turnover ratio. All have
experienced growth as well as deterioration in asset turnover rations in different periods during
the course of 8 rounds.
Sales Andrews Baldwin Chester Digby Erie Ferris
Round 1 1.29 0.99 1.07 0.96 0.93 1.19
Round 2 1.22 0.89 1.16 0.98 0.88 1.21
Round 3 0.99 1.24 1.09 1.03 0.99 1.42
Round 4 0.85 1.07 1.16 1.07 0.89 1.24
Round 5 0.86 1 1.16 0.94 0.88 1.09
Round 6 0.47 1.02 1.16 1.07 0.71 1.1
Round 7 0.47 1.02 1.16 1.07 0.71 1.1
Round 8 0.5 1.07 1.32 1.18 0.9 1.26
Inefficient fund management is a clear indication of immediate change needed in business
strategy:
The inefficient cash flow management by Andrews and Chester influenced its profitability and
business. Both struggled to maintain its revenue and profit. Initially, Andrews was the supreme
leader in the market, both from gross revenue and profitability. However, improper strategy and
⊘ This is a preview!⊘
Do you want full access?
Subscribe today to unlock all pages.
Trusted by 1+ million students worldwide
6PERFORMANCE ANALYSIS AND SIMULATION (ACCOUNTING)
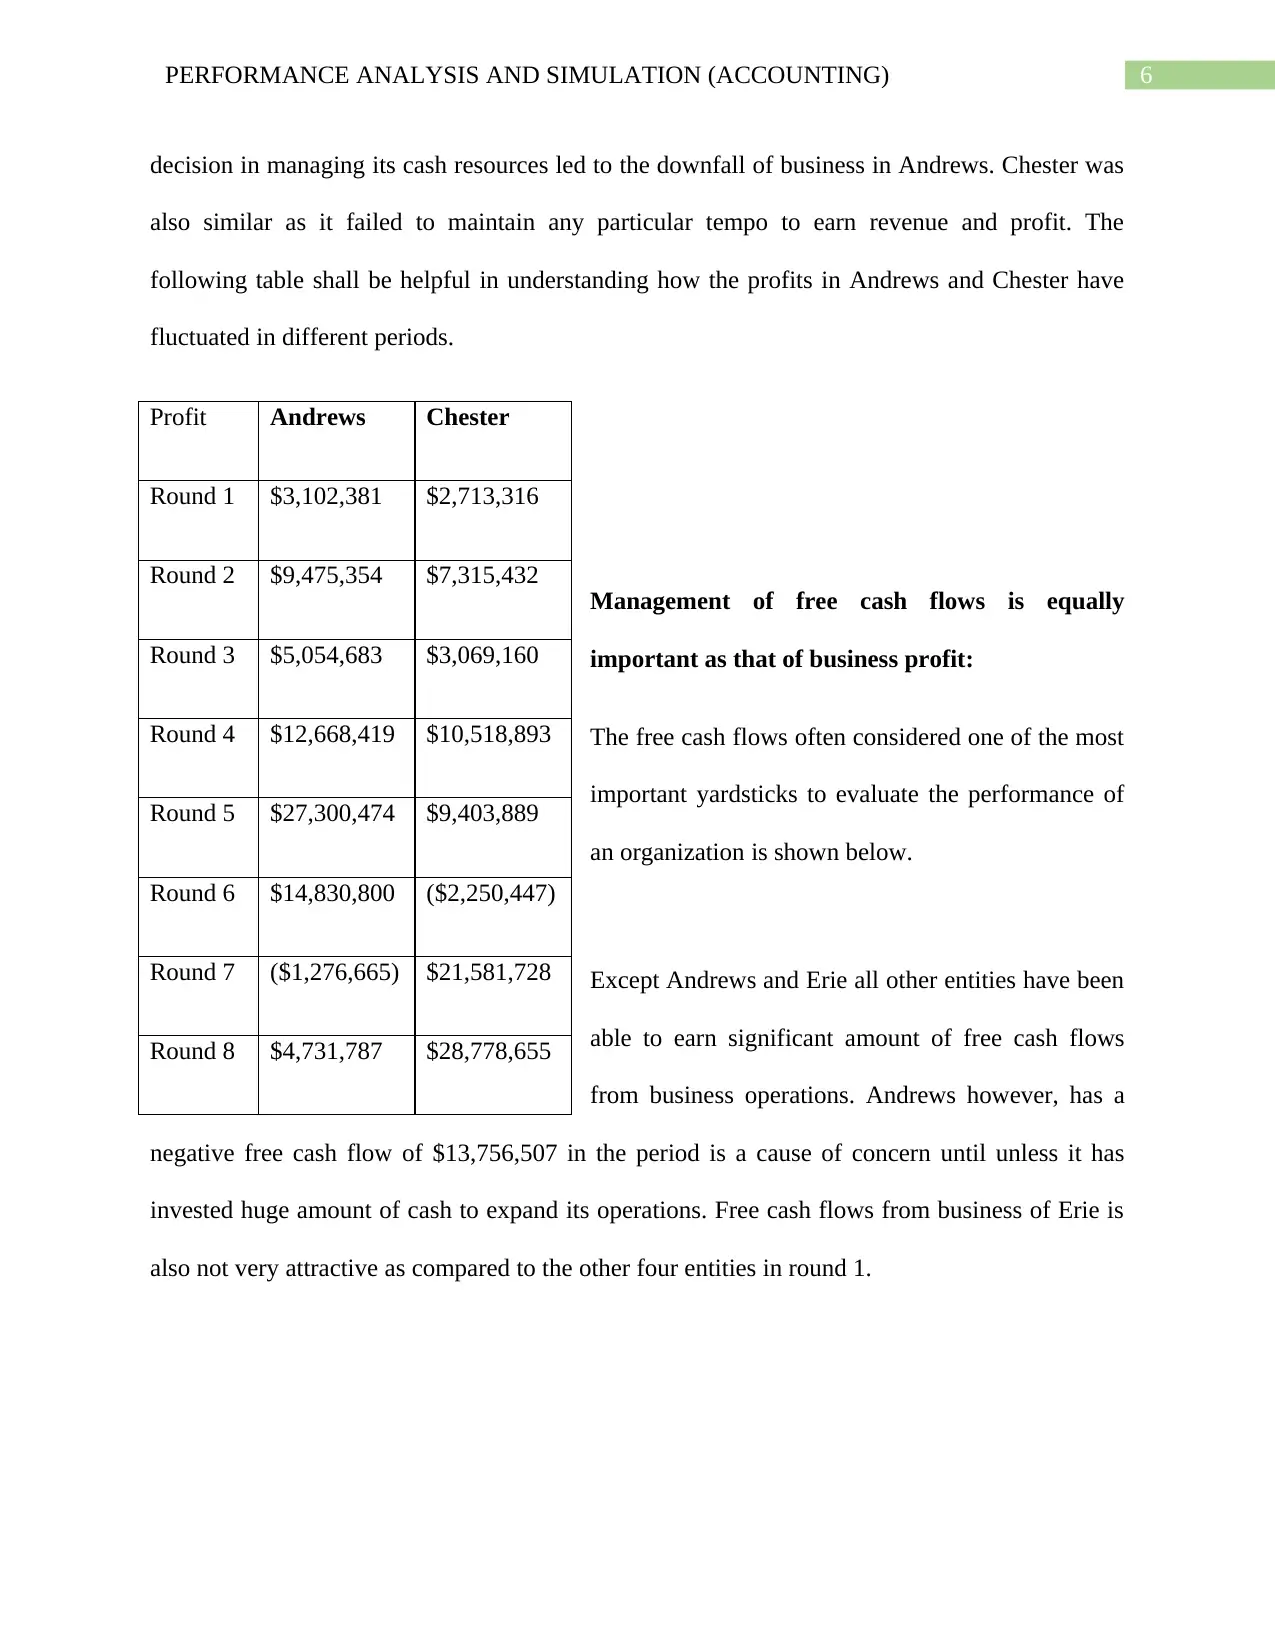
decision in managing its cash resources led to the downfall of business in Andrews. Chester was
also similar as it failed to maintain any particular tempo to earn revenue and profit. The
following table shall be helpful in understanding how the profits in Andrews and Chester have
fluctuated in different periods.
Management of free cash flows is equally
important as that of business profit:
The free cash flows often considered one of the most
important yardsticks to evaluate the performance of
an organization is shown below.
Except Andrews and Erie all other entities have been
able to earn significant amount of free cash flows
from business operations. Andrews however, has a
negative free cash flow of $13,756,507 in the period is a cause of concern until unless it has
invested huge amount of cash to expand its operations. Free cash flows from business of Erie is
also not very attractive as compared to the other four entities in round 1.
Profit Andrews Chester
Round 1 $3,102,381 $2,713,316
Round 2 $9,475,354 $7,315,432
Round 3 $5,054,683 $3,069,160
Round 4 $12,668,419 $10,518,893
Round 5 $27,300,474 $9,403,889
Round 6 $14,830,800 ($2,250,447)
Round 7 ($1,276,665) $21,581,728
Round 8 $4,731,787 $28,778,655
Paraphrase This Document
Need a fresh take? Get an instant paraphrase of this document with our AI Paraphraser
7PERFORMANCE ANALYSIS AND SIMULATION (ACCOUNTING)
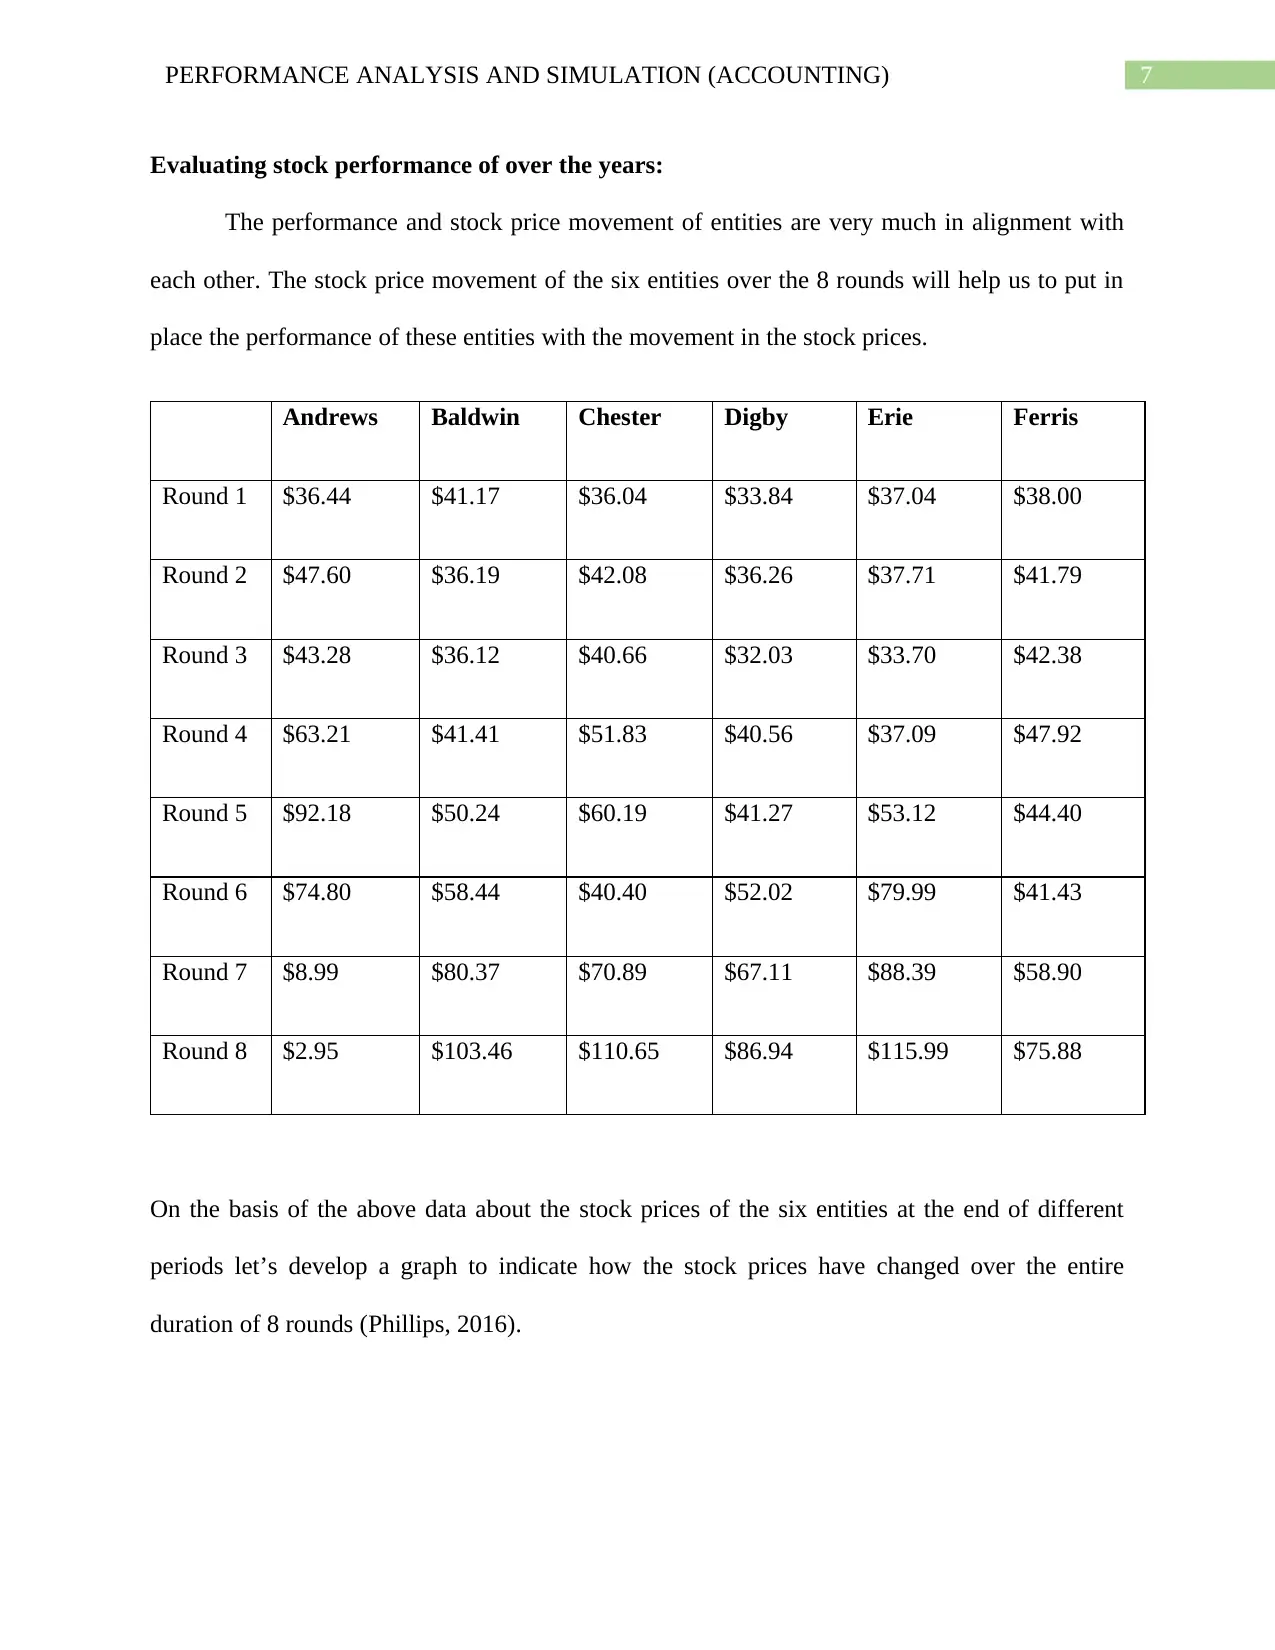
Evaluating stock performance of over the years:
The performance and stock price movement of entities are very much in alignment with
each other. The stock price movement of the six entities over the 8 rounds will help us to put in
place the performance of these entities with the movement in the stock prices.
Andrews Baldwin Chester Digby Erie Ferris
Round 1 $36.44 $41.17 $36.04 $33.84 $37.04 $38.00
Round 2 $47.60 $36.19 $42.08 $36.26 $37.71 $41.79
Round 3 $43.28 $36.12 $40.66 $32.03 $33.70 $42.38
Round 4 $63.21 $41.41 $51.83 $40.56 $37.09 $47.92
Round 5 $92.18 $50.24 $60.19 $41.27 $53.12 $44.40
Round 6 $74.80 $58.44 $40.40 $52.02 $79.99 $41.43
Round 7 $8.99 $80.37 $70.89 $67.11 $88.39 $58.90
Round 8 $2.95 $103.46 $110.65 $86.94 $115.99 $75.88
On the basis of the above data about the stock prices of the six entities at the end of different
periods let’s develop a graph to indicate how the stock prices have changed over the entire
duration of 8 rounds (Phillips, 2016).
8PERFORMANCE ANALYSIS AND SIMULATION (ACCOUNTING)
Round 1 Round 2 Round 3 Round 4 Round 5 Round 6 Round 7 Round 8
$0.00
$20.00
$40.00
$60.00
$80.00
$100.00
$120.00
$140.00
Stock pr ice movement
Andrews Baldwin Chester
Digby Erie Ferris
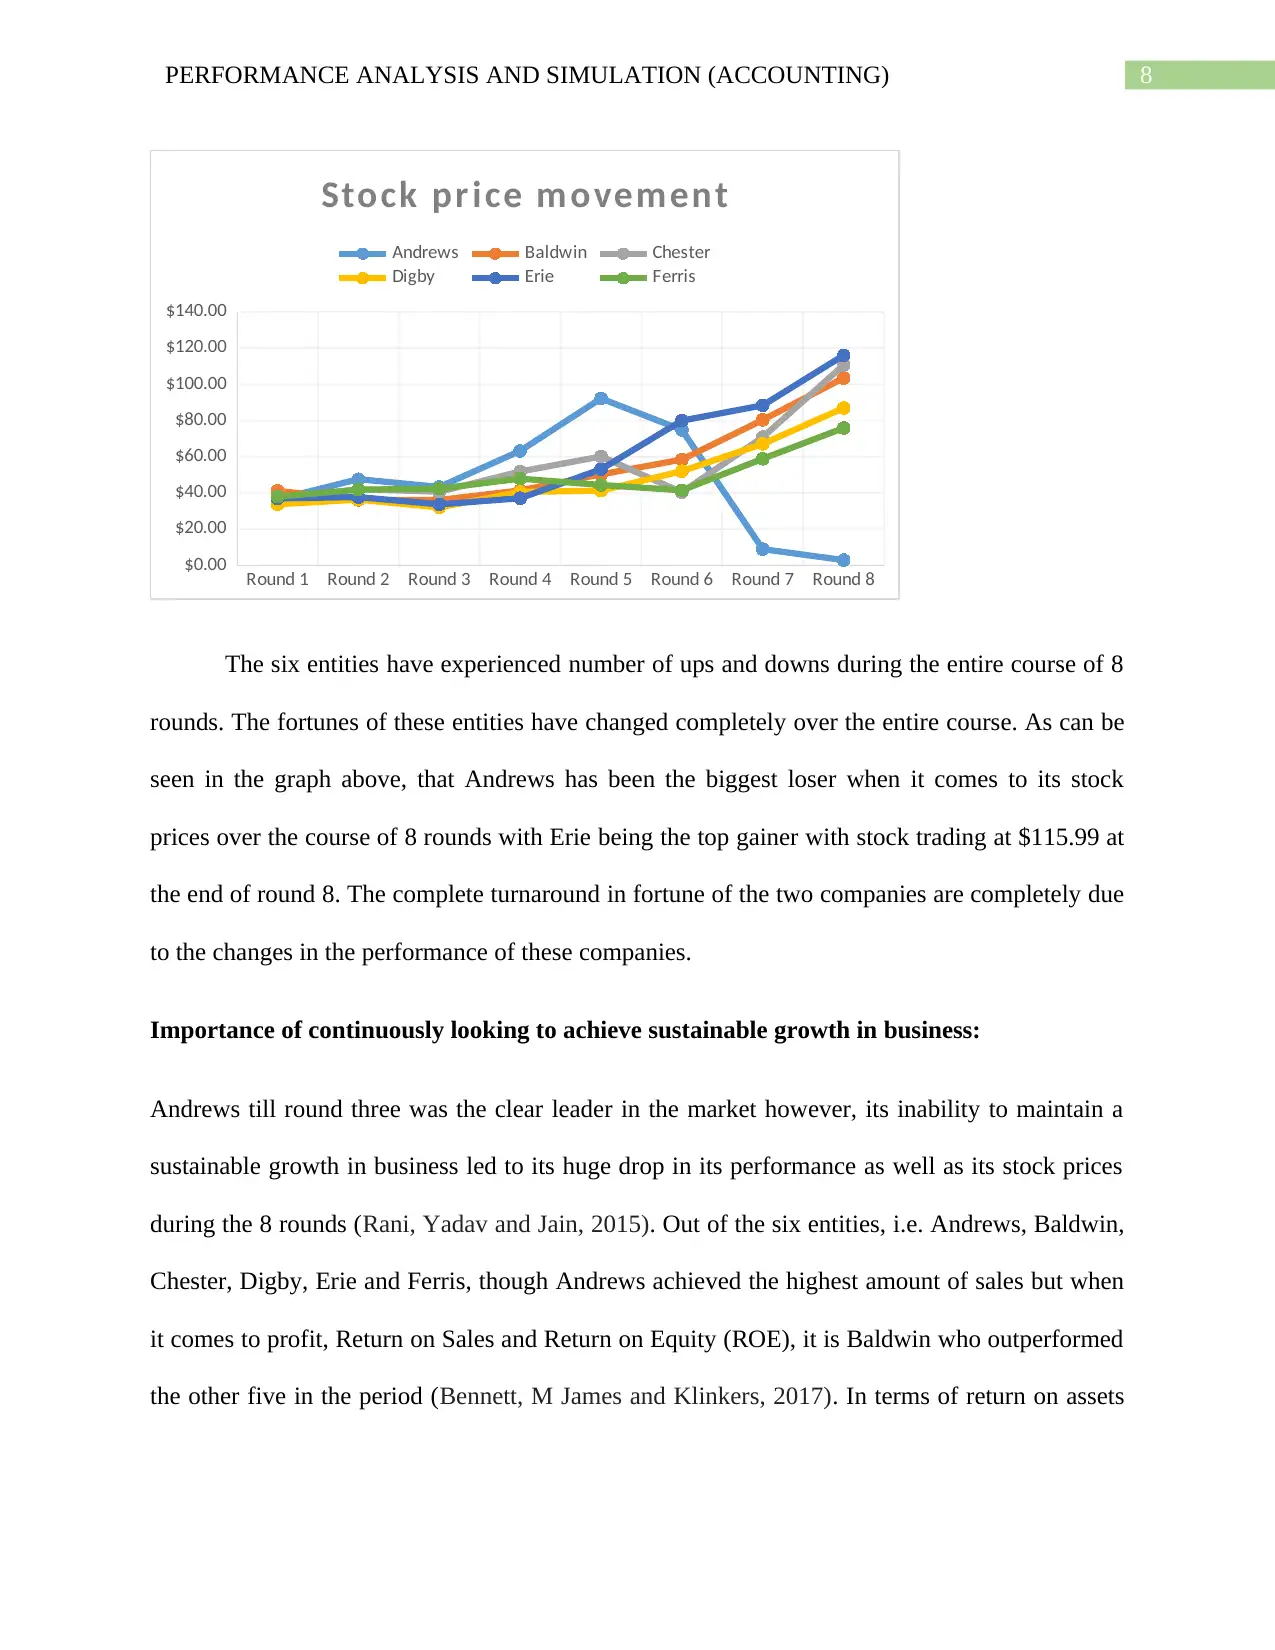
The six entities have experienced number of ups and downs during the entire course of 8
rounds. The fortunes of these entities have changed completely over the entire course. As can be
seen in the graph above, that Andrews has been the biggest loser when it comes to its stock
prices over the course of 8 rounds with Erie being the top gainer with stock trading at $115.99 at
the end of round 8. The complete turnaround in fortune of the two companies are completely due
to the changes in the performance of these companies.
Importance of continuously looking to achieve sustainable growth in business:
Andrews till round three was the clear leader in the market however, its inability to maintain a
sustainable growth in business led to its huge drop in its performance as well as its stock prices
during the 8 rounds (Rani, Yadav and Jain, 2015). Out of the six entities, i.e. Andrews, Baldwin,
Chester, Digby, Erie and Ferris, though Andrews achieved the highest amount of sales but when
it comes to profit, Return on Sales and Return on Equity (ROE), it is Baldwin who outperformed
the other five in the period (Bennett, M James and Klinkers, 2017). In terms of return on assets
Round 1 Round 2 Round 3 Round 4 Round 5 Round 6 Round 7 Round 8
$0.00
$20.00
$40.00
$60.00
$80.00
$100.00
$120.00
$140.00
Stock pr ice movement
Andrews Baldwin Chester
Digby Erie Ferris
The six entities have experienced number of ups and downs during the entire course of 8
rounds. The fortunes of these entities have changed completely over the entire course. As can be
seen in the graph above, that Andrews has been the biggest loser when it comes to its stock
prices over the course of 8 rounds with Erie being the top gainer with stock trading at $115.99 at
the end of round 8. The complete turnaround in fortune of the two companies are completely due
to the changes in the performance of these companies.
Importance of continuously looking to achieve sustainable growth in business:
Andrews till round three was the clear leader in the market however, its inability to maintain a
sustainable growth in business led to its huge drop in its performance as well as its stock prices
during the 8 rounds (Rani, Yadav and Jain, 2015). Out of the six entities, i.e. Andrews, Baldwin,
Chester, Digby, Erie and Ferris, though Andrews achieved the highest amount of sales but when
it comes to profit, Return on Sales and Return on Equity (ROE), it is Baldwin who outperformed
the other five in the period (Bennett, M James and Klinkers, 2017). In terms of return on assets
⊘ This is a preview!⊘
Do you want full access?
Subscribe today to unlock all pages.
Trusted by 1+ million students worldwide
9PERFORMANCE ANALYSIS AND SIMULATION (ACCOUNTING)
(ROA), Ferris outperformed all including Baldwin with 5.26% as compared to Baldwin who was
second best with 4.66% (Saeidi et. al. 2015).
Thus, it is important to have a strategy to achieve sustainable growth in business. This will help
entities to improve their profile in the market. The stock prices of an entity reflects how it is
perceived by the investors. The stock prices of Andrews have taken the most beating during the 8
rounds simply because it failed miserably to maintain sustainable growth in business.
Having an effective strategy to manage cash in the business:
Cash management is one of the most important aspects of any business. In case an entity does
not have an effective cash management strategy then it will struggle to achieve its objectives
both in the short run as well as in the long run. Andrews and Chester are two prime examples of
this. Despite having significant amount of revenue initially, both due to inability of managing its
cash have suffered significant loss of market share and profitability during the course of 8
rounds.
Working capital management:
Managing the working capital is again a key aspect of running an organization successfully. The
day to day affairs within an organization will be hampered if the management does not have a
suitable working capital management strategy. One of the biggest reasons behind the continuous
growth of Digby and Ferris is the efficient working management strategy in both. Whereas the
downfall of Andrews over the last two rounds is also to a large extent is due to the inability of
the management to maintain a proper working capital and cash resources. The emergency loan
taken by Andrews resulted in huge loss in round 7 (Warren Jr, Moffitt and Byrnes, 2015).
Paraphrase This Document
Need a fresh take? Get an instant paraphrase of this document with our AI Paraphraser
10PERFORMANCE ANALYSIS AND SIMULATION (ACCOUNTING)
Flexibility:
Entities operate in an environment which is uncertain thus, the performance of an entity changes
from period to period. As can be seen in previous period where Andrews performed
exceptionally well compared to its performance in earlier period. However, in the latest period
(round 3) again there has been changes in performances of the entities (DeFusco et. al. 2015). It
is of utmost importance for an entity to be flexible with the changes in circumstance. The
management should react to changes in circumstances by responding accordingly. Flexibility is
essential to ensure prompt action with changing circumstances (Weygandt, Kimmel and Kieso,
2015).
11PERFORMANCE ANALYSIS AND SIMULATION (ACCOUNTING)
References:
Ballings, M., Van den Poel, D., Hespeels, N. and Gryp, R., 2015. Evaluating multiple classifiers
for stock price direction prediction. Expert Systems with Applications, 42(20), pp.7046-7056.
Bennett, M., James, P. and Klinkers, L. eds., 2017. Sustainable measures: Evaluation and
reporting of environmental and social performance. Routledge.
DeFusco, R.A., McLeavey, D.W., Pinto, J.E., Anson, M.J. and Runkle, D.E., 2015. Quantitative
investment analysis. John Wiley & Sons.
Drake, M.S., Quinn, P.J. and Thornock, J.R., 2017. Who uses financial statements? a
demographic analysis of financial statement downloads from edgar. Accounting Horizons, 31(3),
pp.55-68. [Online] Available at: http://www.aaajournals.org/doi/abs/10.2308/acch-51736
[Accessed 3 October 2018]
Fazzini, M., 2018. Financial Statement Analysis. In Business Valuation (pp. 39-76). Palgrave
Macmillan, Cham. [Online] Available at: https://link.springer.com/chapter/10.1007/978-3-319-
89494-2_3 [Accessed 3 October 2018]
Jans, M., Alles, M.G. and Vasarhelyi, M.A., 2014. A field study on the use of process mining of
event logs as an analytical procedure in auditing. The Accounting Review, 89(5), pp.1751-1773.
[Online] Available from: http://www.aaajournals.org/doi/abs/10.2308/accr-50807?code=aaan-
site [Accessed 3 October 2018]
Karadag, H., 2015. Financial management challenges in small and medium-sized enterprises: A
strategic management approach. EMAJ: Emerging Markets Journal, 5(1), pp.26-40. [Online]
Available at: http://emaj.pitt.edu/ojs/index.php/emaj/article/view/67 [Accessed 3 October 2018]
⊘ This is a preview!⊘
Do you want full access?
Subscribe today to unlock all pages.
Trusted by 1+ million students worldwide
1 out of 15
Related Documents


Your All-in-One AI-Powered Toolkit for Academic Success.
+13062052269
info@desklib.com
Available 24*7 on WhatsApp / Email
![[object Object]](/_next/static/media/star-bottom.7253800d.svg)
Unlock your academic potential
Copyright © 2020–2026 A2Z Services. All Rights Reserved. Developed and managed by ZUCOL.