Analysis of Financial Ratios and Performance of Tesco and Sainsbury
VerifiedAdded on 2023/01/03
|18
|3924
|83
AI Summary
This report provides an analysis of the financial ratios and performance of Tesco and Sainsbury. It includes calculations of current ratio, quick ratio, net profit margin, gross profit margin, gearing ratio, P/E ratio, earning per share, return on capital employed, average inventory turnover period, and dividend payout ratio. The report also discusses the financial position of both companies and the limitations of relying on financial ratios. It offers insights into the profitability, liquidity, and efficiency of Tesco and Sainsbury.
Contribute Materials
Your contribution can guide someone’s learning journey. Share your
documents today.

PORTFOLIO
Secure Best Marks with AI Grader
Need help grading? Try our AI Grader for instant feedback on your assignments.
Table of Contents
INTRODUCTION...........................................................................................................................4
Portfolio 1........................................................................................................................................4
Calculation of financial ratios......................................................................................................4
Analysis financial position of companies....................................................................................8
Analysis of business performance improvement.........................................................................9
Limitations of Company relying on financial ratios..................................................................10
Portfolio 2......................................................................................................................................12
Capital Investment Appraisal.....................................................................................................12
CONCLUSION..............................................................................................................................15
REFERENCES..............................................................................................................................17
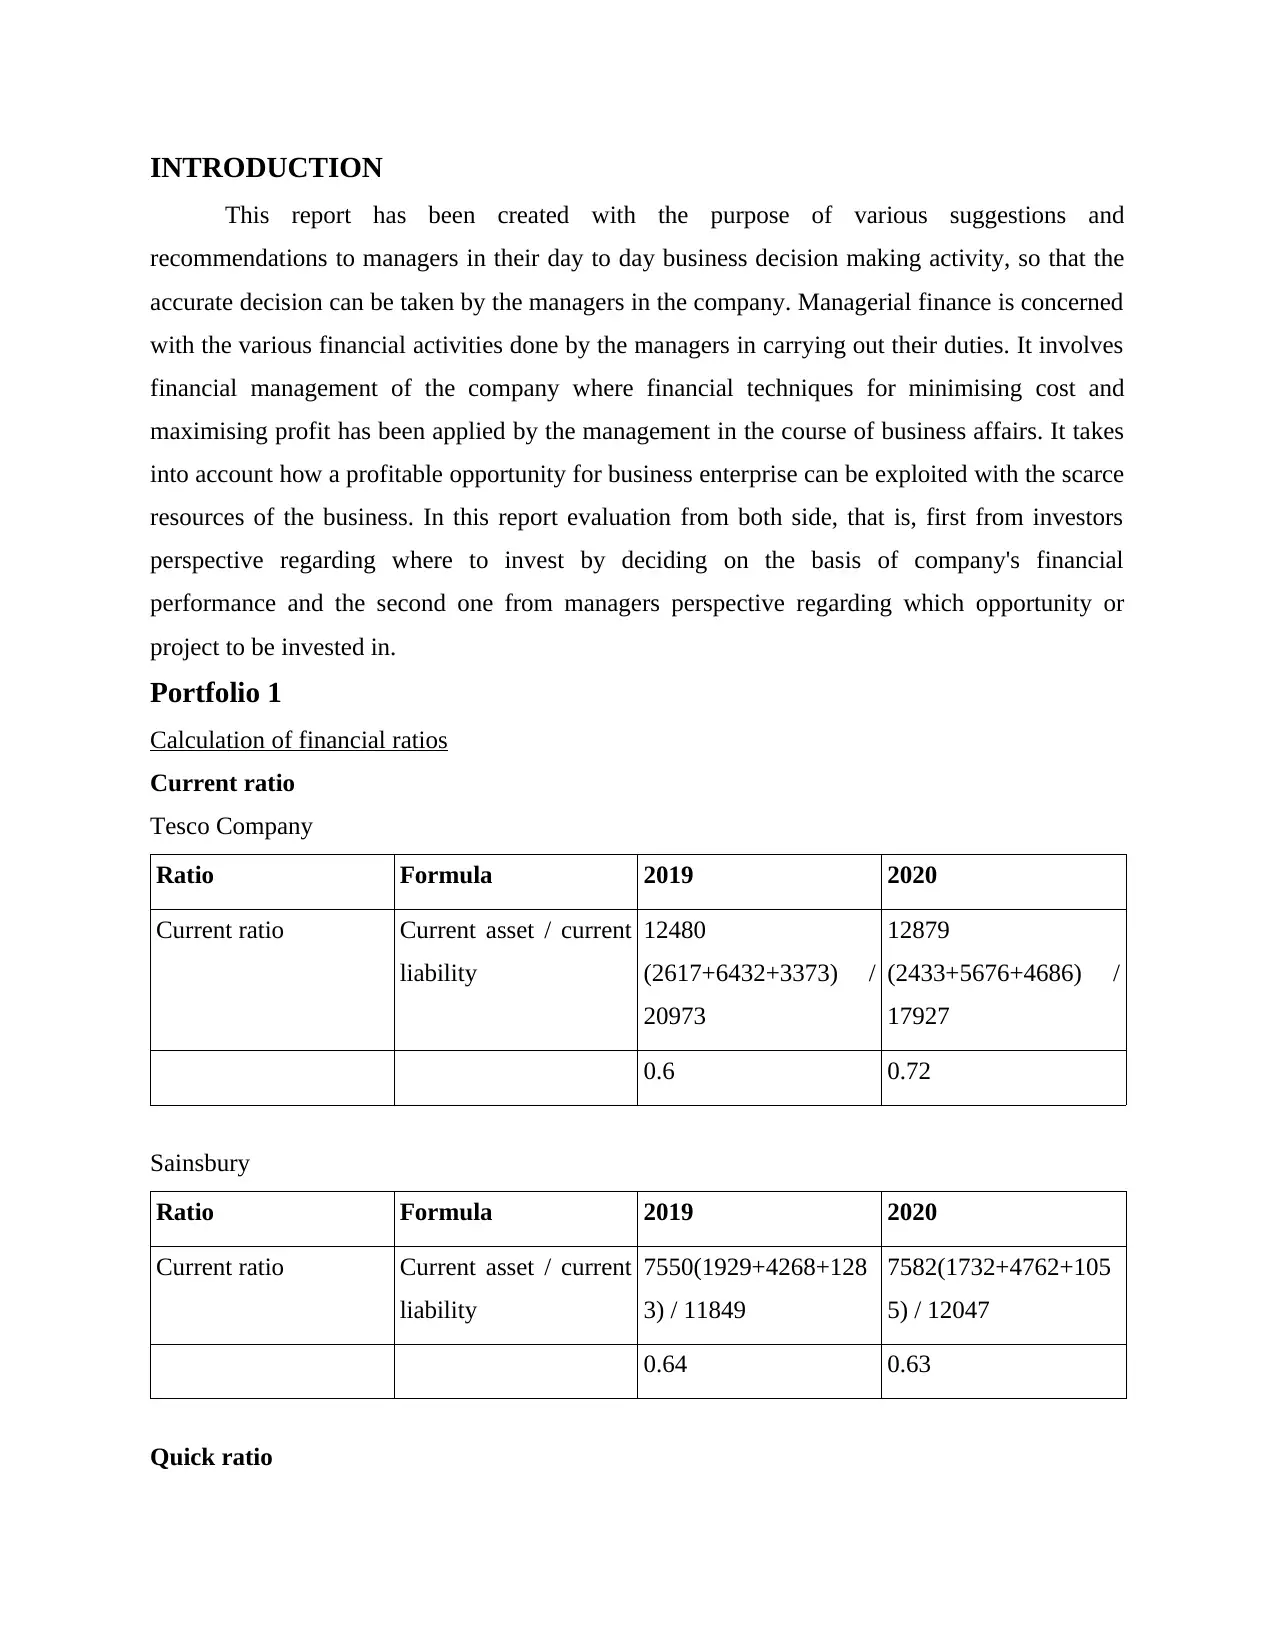
INTRODUCTION
This report has been created with the purpose of various suggestions and
recommendations to managers in their day to day business decision making activity, so that the
accurate decision can be taken by the managers in the company. Managerial finance is concerned
with the various financial activities done by the managers in carrying out their duties. It involves
financial management of the company where financial techniques for minimising cost and
maximising profit has been applied by the management in the course of business affairs. It takes
into account how a profitable opportunity for business enterprise can be exploited with the scarce
resources of the business. In this report evaluation from both side, that is, first from investors
perspective regarding where to invest by deciding on the basis of company's financial
performance and the second one from managers perspective regarding which opportunity or
project to be invested in.
Portfolio 1
Calculation of financial ratios
Current ratio
Tesco Company
Ratio Formula 2019 2020
Current ratio Current asset / current
liability
12480
(2617+6432+3373) /
20973
12879
(2433+5676+4686) /
17927
0.6 0.72
Sainsbury
Ratio Formula 2019 2020
Current ratio Current asset / current
liability
7550(1929+4268+128
3) / 11849
7582(1732+4762+105
5) / 12047
0.64 0.63
Quick ratio
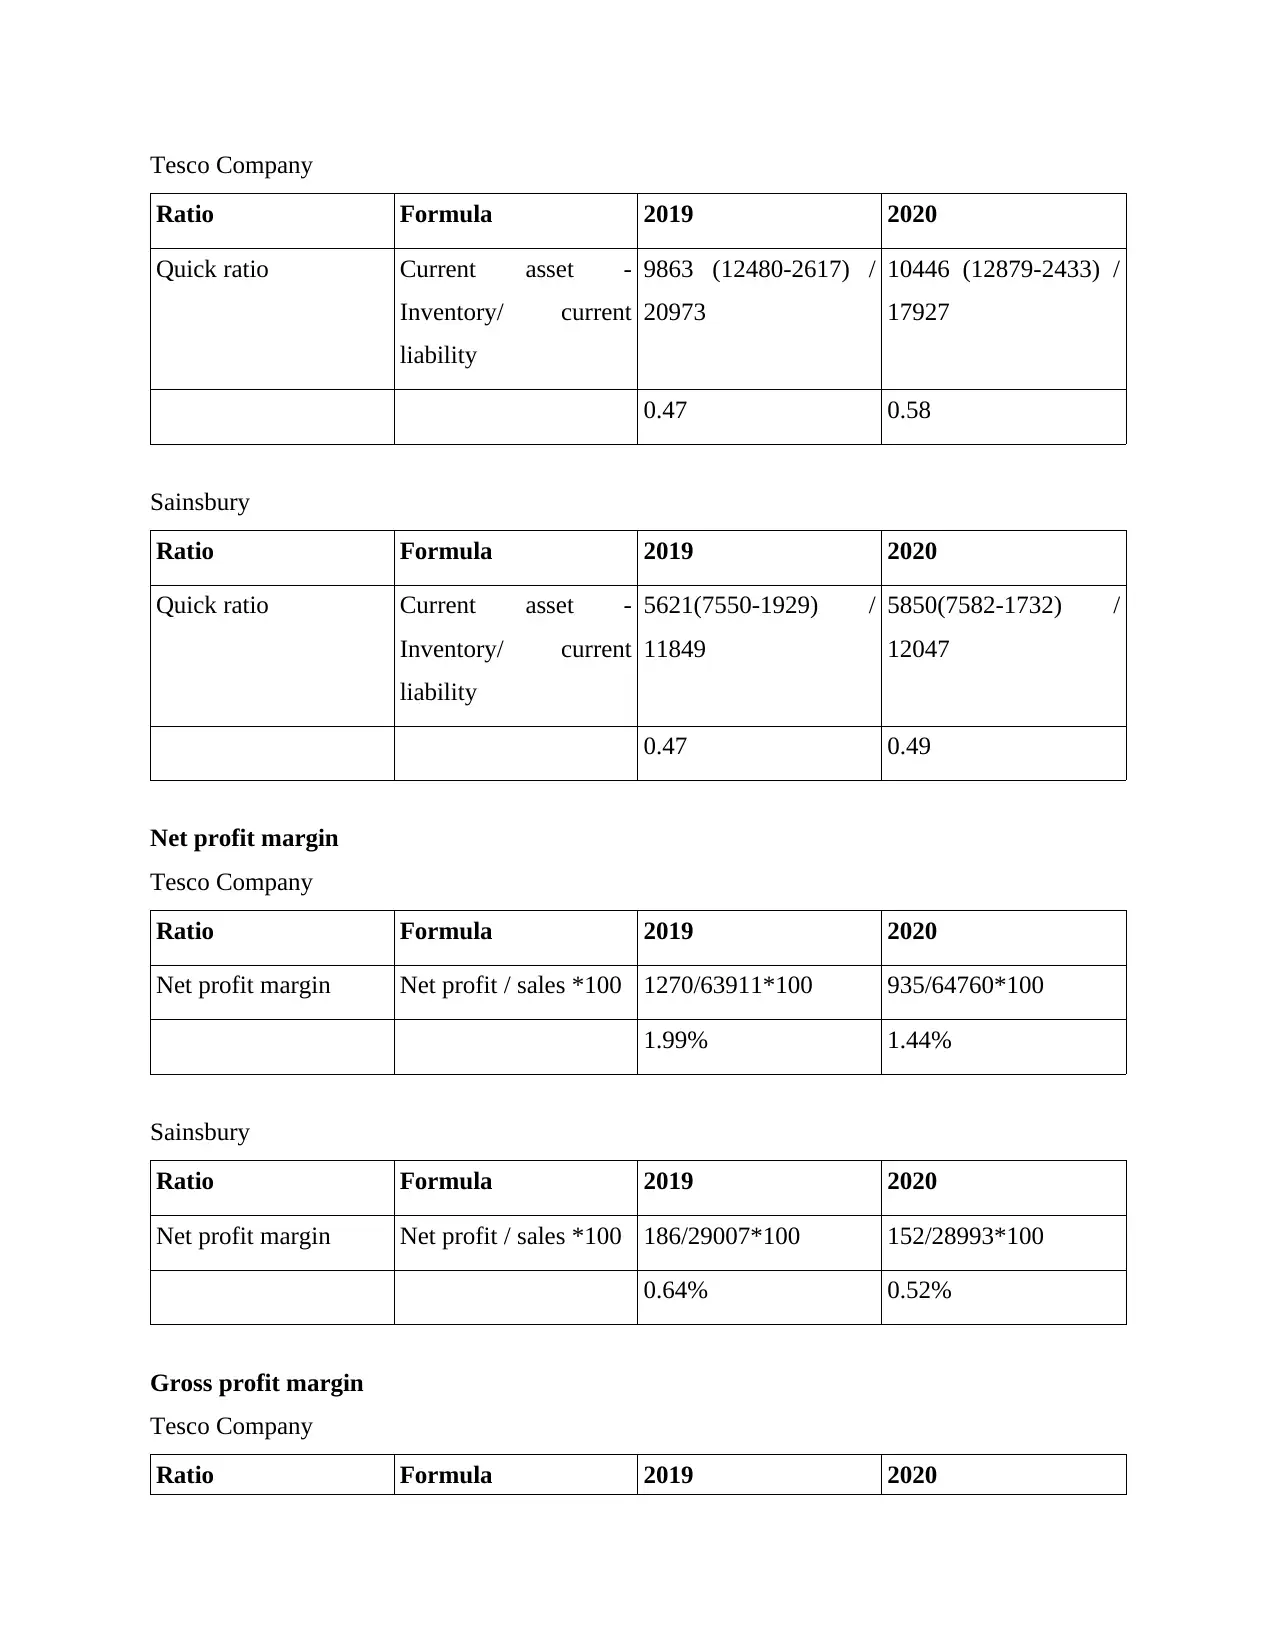
Tesco Company
Ratio Formula 2019 2020
Quick ratio Current asset -
Inventory/ current
liability
9863 (12480-2617) /
20973
10446 (12879-2433) /
17927
0.47 0.58
Sainsbury
Ratio Formula 2019 2020
Quick ratio Current asset -
Inventory/ current
liability
5621(7550-1929) /
11849
5850(7582-1732) /
12047
0.47 0.49
Net profit margin
Tesco Company
Ratio Formula 2019 2020
Net profit margin Net profit / sales *100 1270/63911*100 935/64760*100
1.99% 1.44%
Sainsbury
Ratio Formula 2019 2020
Net profit margin Net profit / sales *100 186/29007*100 152/28993*100
0.64% 0.52%
Gross profit margin
Tesco Company
Ratio Formula 2019 2020
Ratio Formula 2019 2020
Quick ratio Current asset -
Inventory/ current
liability
9863 (12480-2617) /
20973
10446 (12879-2433) /
17927
0.47 0.58
Sainsbury
Ratio Formula 2019 2020
Quick ratio Current asset -
Inventory/ current
liability
5621(7550-1929) /
11849
5850(7582-1732) /
12047
0.47 0.49
Net profit margin
Tesco Company
Ratio Formula 2019 2020
Net profit margin Net profit / sales *100 1270/63911*100 935/64760*100
1.99% 1.44%
Sainsbury
Ratio Formula 2019 2020
Net profit margin Net profit / sales *100 186/29007*100 152/28993*100
0.64% 0.52%
Gross profit margin
Tesco Company
Ratio Formula 2019 2020
Secure Best Marks with AI Grader
Need help grading? Try our AI Grader for instant feedback on your assignments.
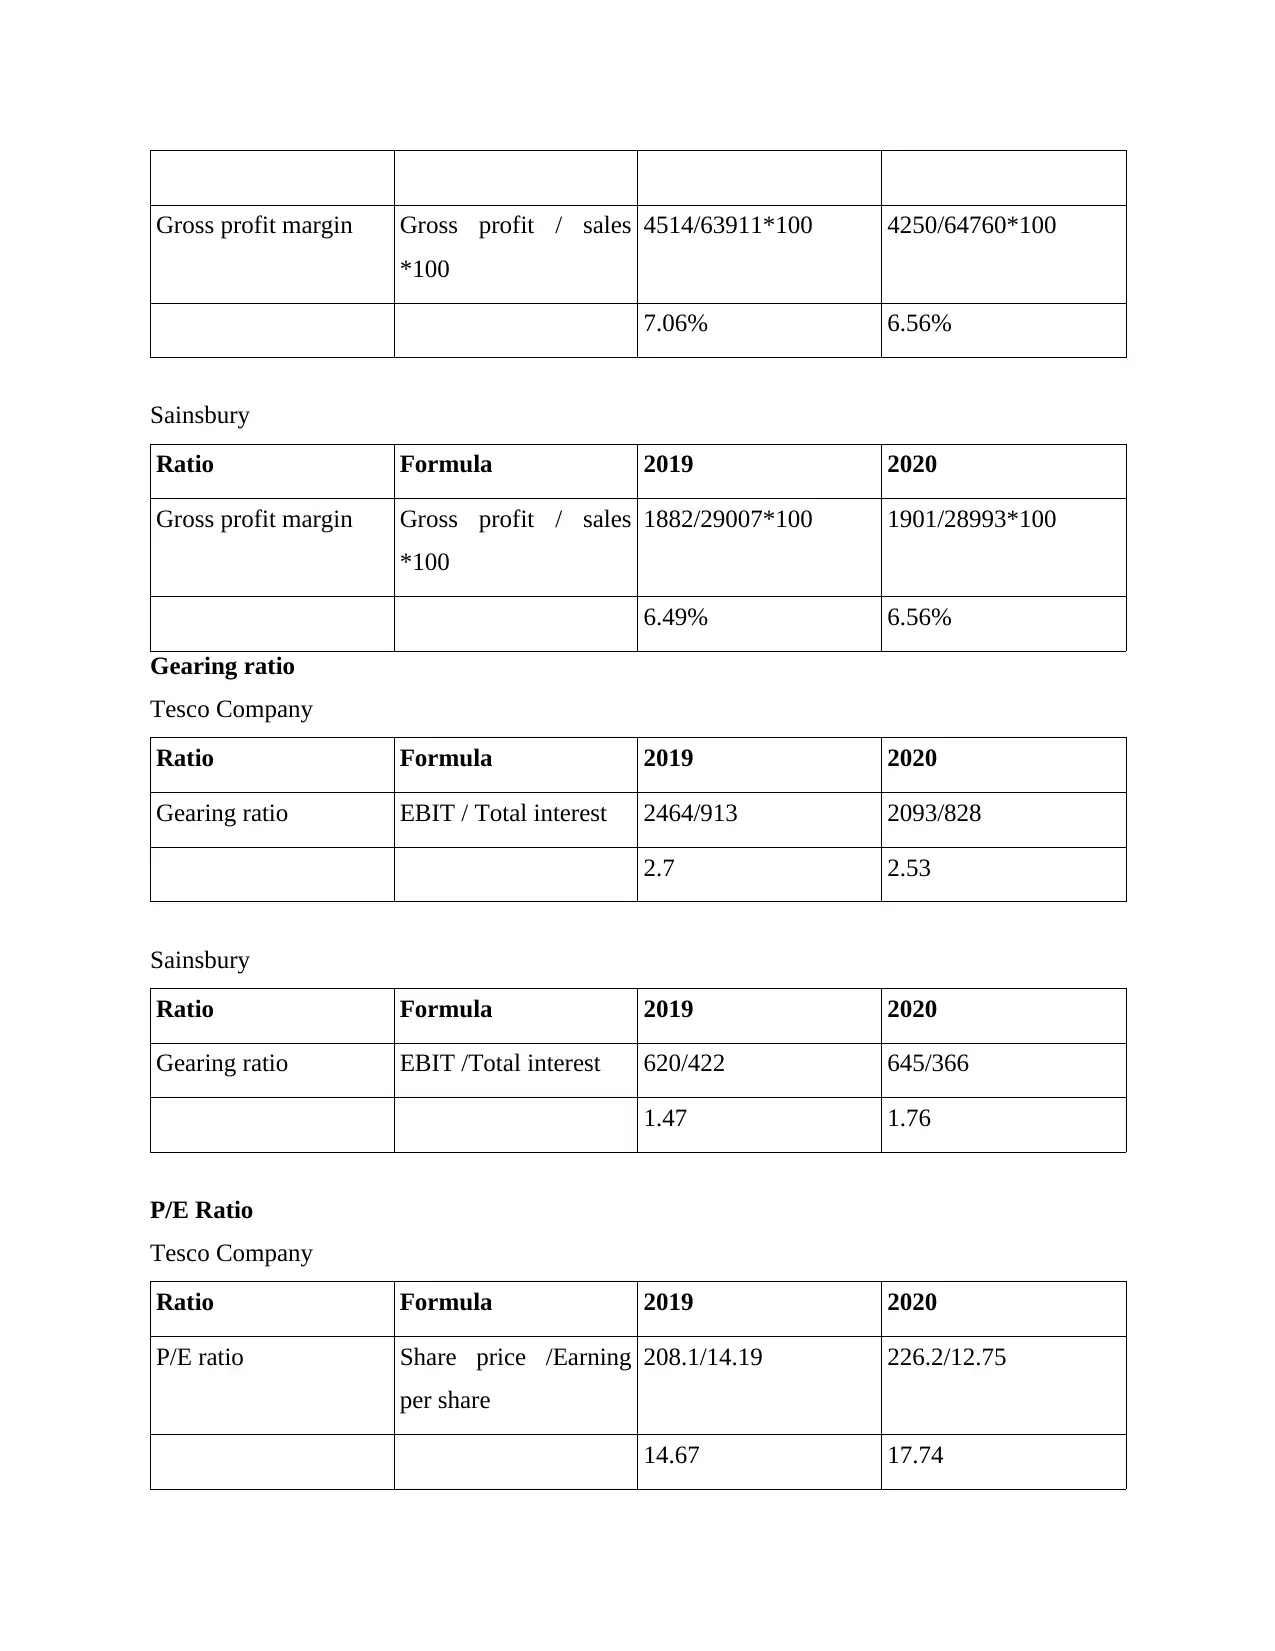
Gross profit margin Gross profit / sales
*100
4514/63911*100 4250/64760*100
7.06% 6.56%
Sainsbury
Ratio Formula 2019 2020
Gross profit margin Gross profit / sales
*100
1882/29007*100 1901/28993*100
6.49% 6.56%
Gearing ratio
Tesco Company
Ratio Formula 2019 2020
Gearing ratio EBIT / Total interest 2464/913 2093/828
2.7 2.53
Sainsbury
Ratio Formula 2019 2020
Gearing ratio EBIT /Total interest 620/422 645/366
1.47 1.76
P/E Ratio
Tesco Company
Ratio Formula 2019 2020
P/E ratio Share price /Earning
per share
208.1/14.19 226.2/12.75
14.67 17.74
*100
4514/63911*100 4250/64760*100
7.06% 6.56%
Sainsbury
Ratio Formula 2019 2020
Gross profit margin Gross profit / sales
*100
1882/29007*100 1901/28993*100
6.49% 6.56%
Gearing ratio
Tesco Company
Ratio Formula 2019 2020
Gearing ratio EBIT / Total interest 2464/913 2093/828
2.7 2.53
Sainsbury
Ratio Formula 2019 2020
Gearing ratio EBIT /Total interest 620/422 645/366
1.47 1.76
P/E Ratio
Tesco Company
Ratio Formula 2019 2020
P/E ratio Share price /Earning
per share
208.1/14.19 226.2/12.75
14.67 17.74
Sainsbury
Ratio Formula 2019 2020
P/E ratio Share price /Earning
per share
206/6.79 20/05/08
30.34 40
Earning per share
Tesco Company
Ratio Formula 2019 2020
Earning per share Net income/ number
of equity share
5.87 7.78
Sainsbury
Ratio Formula 2019 2020
Earning per share Net income/ number
of equity share
-0.72 -2.85
Return on capital employed
Tesco Company
Ratio Formula 2019 2020
Return on capital
employed
Earning before interest
and tax / capital
employed (Total asset
– current liability)
2464 / 35925(56898-
20973)
2093/34375(52302-
17927)
0.07 0.06
Ratio Formula 2019 2020
P/E ratio Share price /Earning
per share
206/6.79 20/05/08
30.34 40
Earning per share
Tesco Company
Ratio Formula 2019 2020
Earning per share Net income/ number
of equity share
5.87 7.78
Sainsbury
Ratio Formula 2019 2020
Earning per share Net income/ number
of equity share
-0.72 -2.85
Return on capital employed
Tesco Company
Ratio Formula 2019 2020
Return on capital
employed
Earning before interest
and tax / capital
employed (Total asset
– current liability)
2464 / 35925(56898-
20973)
2093/34375(52302-
17927)
0.07 0.06
Sainsbury
Ratio Formula 2019 2020
Return on capital
employed
Earning before interest
and tax / capital
employed (Total asset
– current liability)
620/16162(28011-
11849)
645/15890(27937-
12047)
0.04 0.04
Average inventory turnover period
Tesco Company
Ratio Formula 2019 2020
Average inventory
turnover period
Cost of good sold
/average stock
61272/2441(2264+261
7/2)
62199/2525(2617+243
3/2)
25.1 24.63
Sainsbury
Ratio Formula 2019 2020
Average inventory
turnover period
Cost of good sold
/average stock
28406/1869.5(1810+1
929/2)
28343/1830.5(1929+1
732/2)
15.19 15.48
Dividend payout ratio
Tesco Company
Ratio Formula 2019 2020
Dividend payout ratio Dividend per share /
Earning per share
3.67/13.04 6.75/9.54
0.28 0.71
Ratio Formula 2019 2020
Return on capital
employed
Earning before interest
and tax / capital
employed (Total asset
– current liability)
620/16162(28011-
11849)
645/15890(27937-
12047)
0.04 0.04
Average inventory turnover period
Tesco Company
Ratio Formula 2019 2020
Average inventory
turnover period
Cost of good sold
/average stock
61272/2441(2264+261
7/2)
62199/2525(2617+243
3/2)
25.1 24.63
Sainsbury
Ratio Formula 2019 2020
Average inventory
turnover period
Cost of good sold
/average stock
28406/1869.5(1810+1
929/2)
28343/1830.5(1929+1
732/2)
15.19 15.48
Dividend payout ratio
Tesco Company
Ratio Formula 2019 2020
Dividend payout ratio Dividend per share /
Earning per share
3.67/13.04 6.75/9.54
0.28 0.71
Paraphrase This Document
Need a fresh take? Get an instant paraphrase of this document with our AI Paraphraser
Sainsbury
Ratio Formula 2019 2020
Dividend payout ratio Dividend per share /
Earning per share
10.2/7.5 11.2/5.8
1.36 1.93
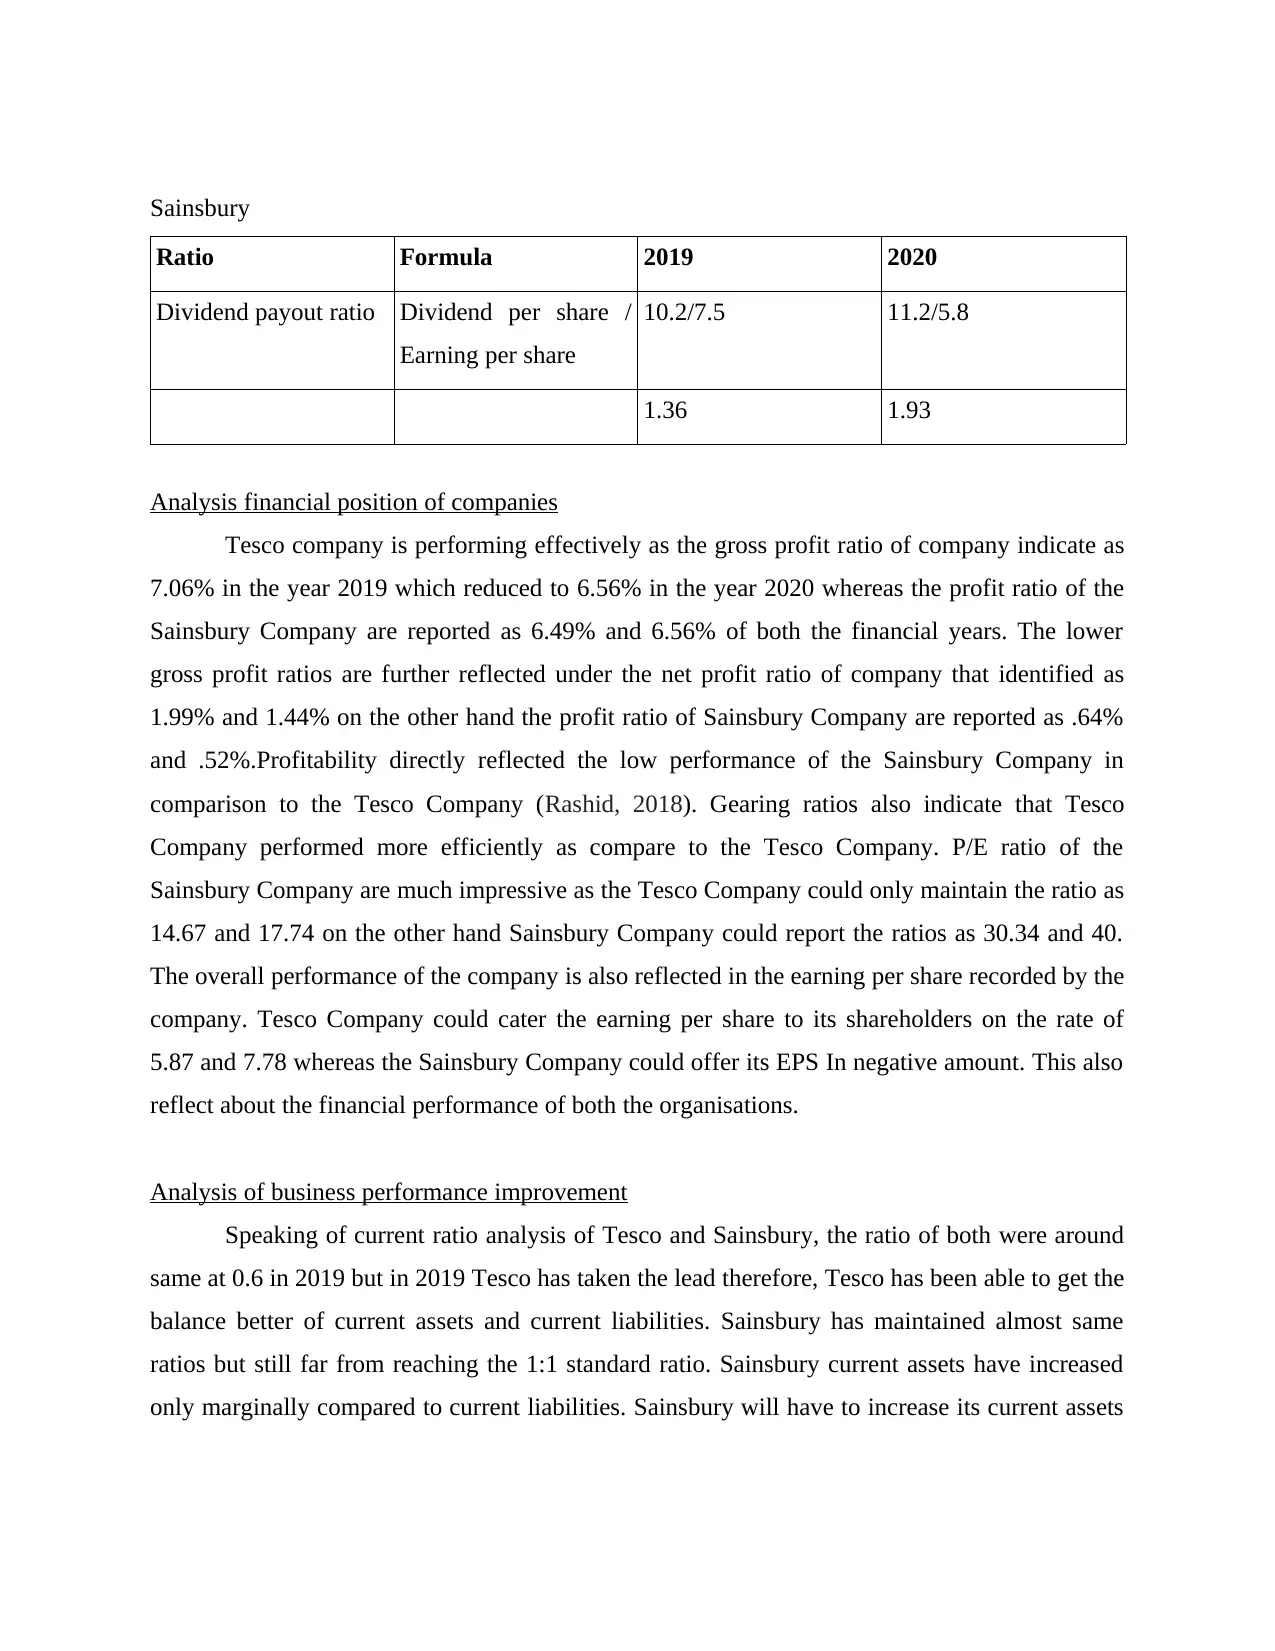
Analysis financial position of companies
Tesco company is performing effectively as the gross profit ratio of company indicate as
7.06% in the year 2019 which reduced to 6.56% in the year 2020 whereas the profit ratio of the
Sainsbury Company are reported as 6.49% and 6.56% of both the financial years. The lower
gross profit ratios are further reflected under the net profit ratio of company that identified as
1.99% and 1.44% on the other hand the profit ratio of Sainsbury Company are reported as .64%
and .52%.Profitability directly reflected the low performance of the Sainsbury Company in
comparison to the Tesco Company (Rashid, 2018). Gearing ratios also indicate that Tesco
Company performed more efficiently as compare to the Tesco Company. P/E ratio of the
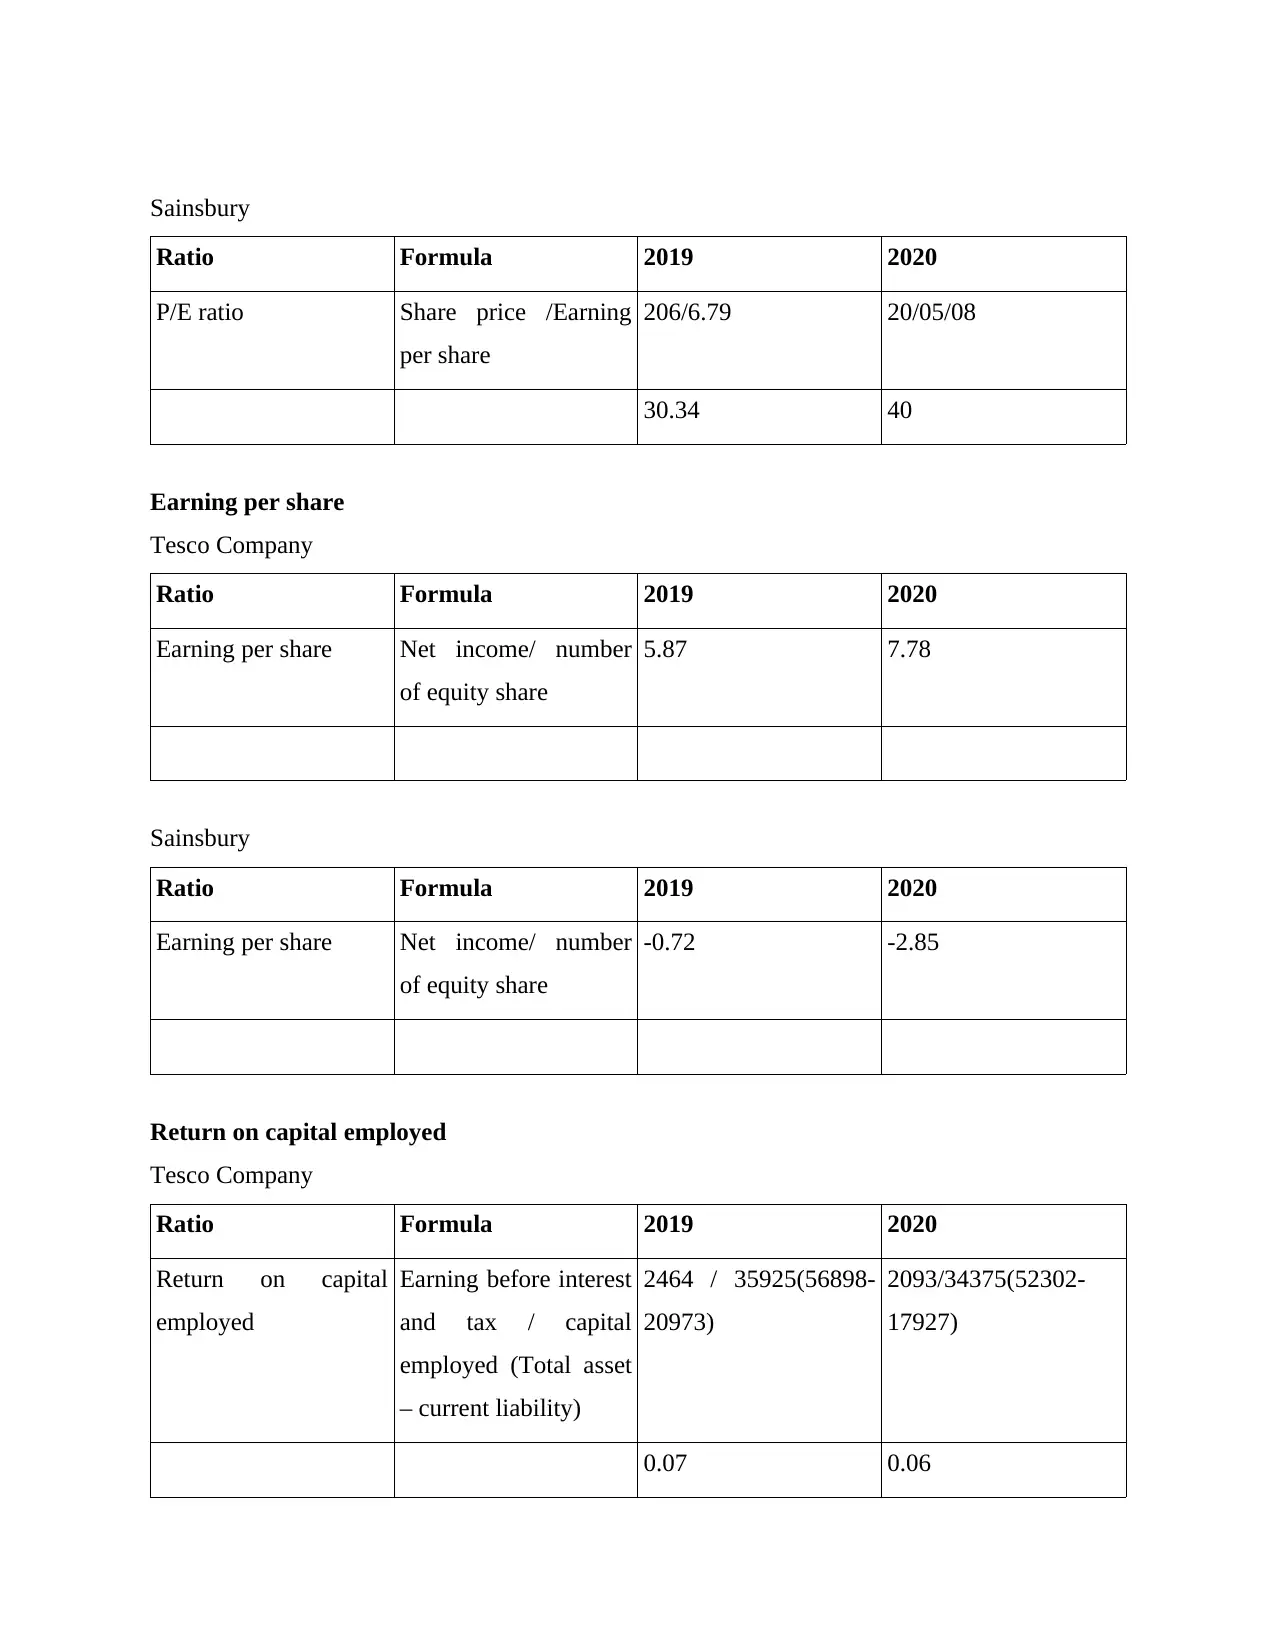
Sainsbury Company are much impressive as the Tesco Company could only maintain the ratio as
14.67 and 17.74 on the other hand Sainsbury Company could report the ratios as 30.34 and 40.
The overall performance of the company is also reflected in the earning per share recorded by the
company. Tesco Company could cater the earning per share to its shareholders on the rate of
5.87 and 7.78 whereas the Sainsbury Company could offer its EPS In negative amount. This also
reflect about the financial performance of both the organisations.
Analysis of business performance improvement
Speaking of current ratio analysis of Tesco and Sainsbury, the ratio of both were around
same at 0.6 in 2019 but in 2019 Tesco has taken the lead therefore, Tesco has been able to get the
balance better of current assets and current liabilities. Sainsbury has maintained almost same
ratios but still far from reaching the 1:1 standard ratio. Sainsbury current assets have increased
only marginally compared to current liabilities. Sainsbury will have to increase its current assets
Ratio Formula 2019 2020
Dividend payout ratio Dividend per share /
Earning per share
10.2/7.5 11.2/5.8
1.36 1.93
Analysis financial position of companies
Tesco company is performing effectively as the gross profit ratio of company indicate as
7.06% in the year 2019 which reduced to 6.56% in the year 2020 whereas the profit ratio of the
Sainsbury Company are reported as 6.49% and 6.56% of both the financial years. The lower
gross profit ratios are further reflected under the net profit ratio of company that identified as
1.99% and 1.44% on the other hand the profit ratio of Sainsbury Company are reported as .64%
and .52%.Profitability directly reflected the low performance of the Sainsbury Company in
comparison to the Tesco Company (Rashid, 2018). Gearing ratios also indicate that Tesco
Company performed more efficiently as compare to the Tesco Company. P/E ratio of the
Sainsbury Company are much impressive as the Tesco Company could only maintain the ratio as
14.67 and 17.74 on the other hand Sainsbury Company could report the ratios as 30.34 and 40.
The overall performance of the company is also reflected in the earning per share recorded by the
company. Tesco Company could cater the earning per share to its shareholders on the rate of
5.87 and 7.78 whereas the Sainsbury Company could offer its EPS In negative amount. This also
reflect about the financial performance of both the organisations.
Analysis of business performance improvement
Speaking of current ratio analysis of Tesco and Sainsbury, the ratio of both were around
same at 0.6 in 2019 but in 2019 Tesco has taken the lead therefore, Tesco has been able to get the
balance better of current assets and current liabilities. Sainsbury has maintained almost same
ratios but still far from reaching the 1:1 standard ratio. Sainsbury current assets have increased
only marginally compared to current liabilities. Sainsbury will have to increase its current assets
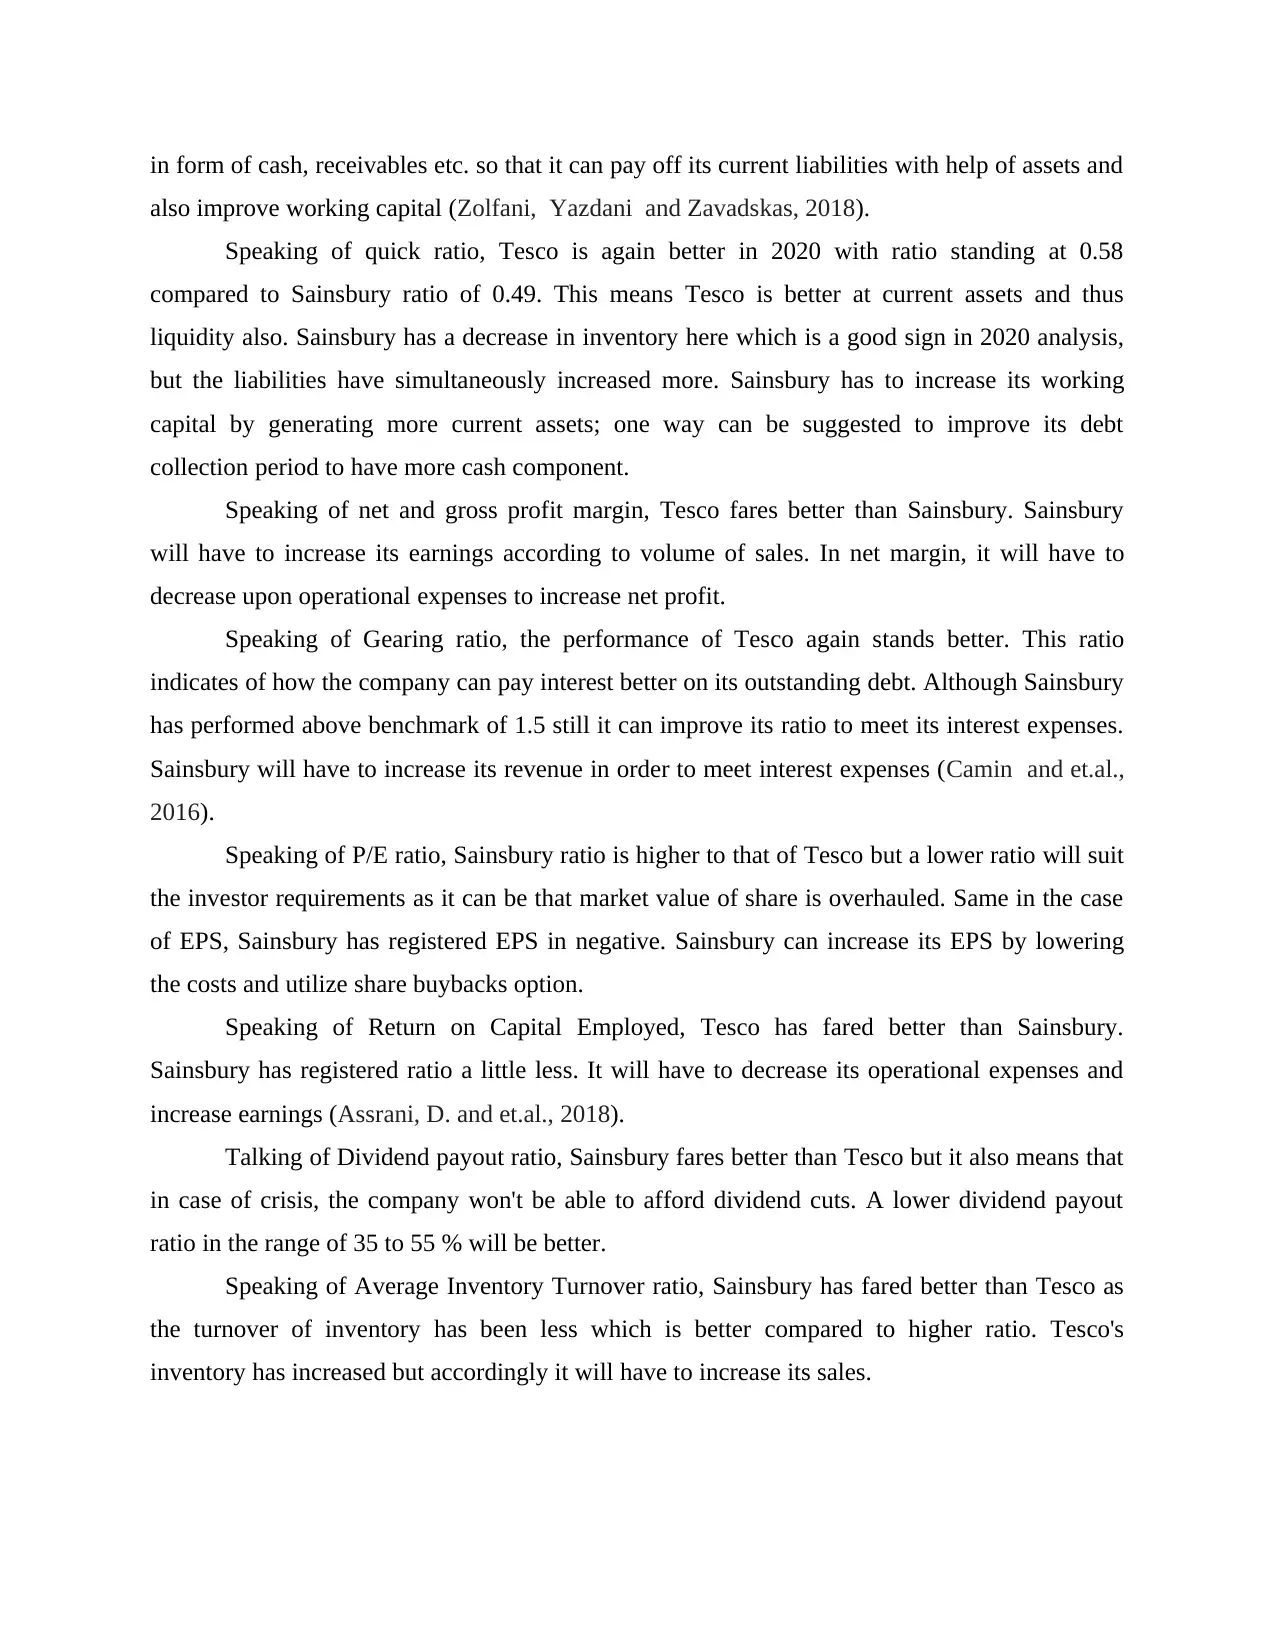
in form of cash, receivables etc. so that it can pay off its current liabilities with help of assets and
also improve working capital (Zolfani, Yazdani and Zavadskas, 2018).
Speaking of quick ratio, Tesco is again better in 2020 with ratio standing at 0.58
compared to Sainsbury ratio of 0.49. This means Tesco is better at current assets and thus
liquidity also. Sainsbury has a decrease in inventory here which is a good sign in 2020 analysis,
but the liabilities have simultaneously increased more. Sainsbury has to increase its working
capital by generating more current assets; one way can be suggested to improve its debt
collection period to have more cash component.
Speaking of net and gross profit margin, Tesco fares better than Sainsbury. Sainsbury
will have to increase its earnings according to volume of sales. In net margin, it will have to
decrease upon operational expenses to increase net profit.
Speaking of Gearing ratio, the performance of Tesco again stands better. This ratio
indicates of how the company can pay interest better on its outstanding debt. Although Sainsbury
has performed above benchmark of 1.5 still it can improve its ratio to meet its interest expenses.
Sainsbury will have to increase its revenue in order to meet interest expenses (Camin and et.al.,
2016).
Speaking of P/E ratio, Sainsbury ratio is higher to that of Tesco but a lower ratio will suit
the investor requirements as it can be that market value of share is overhauled. Same in the case
of EPS, Sainsbury has registered EPS in negative. Sainsbury can increase its EPS by lowering
the costs and utilize share buybacks option.
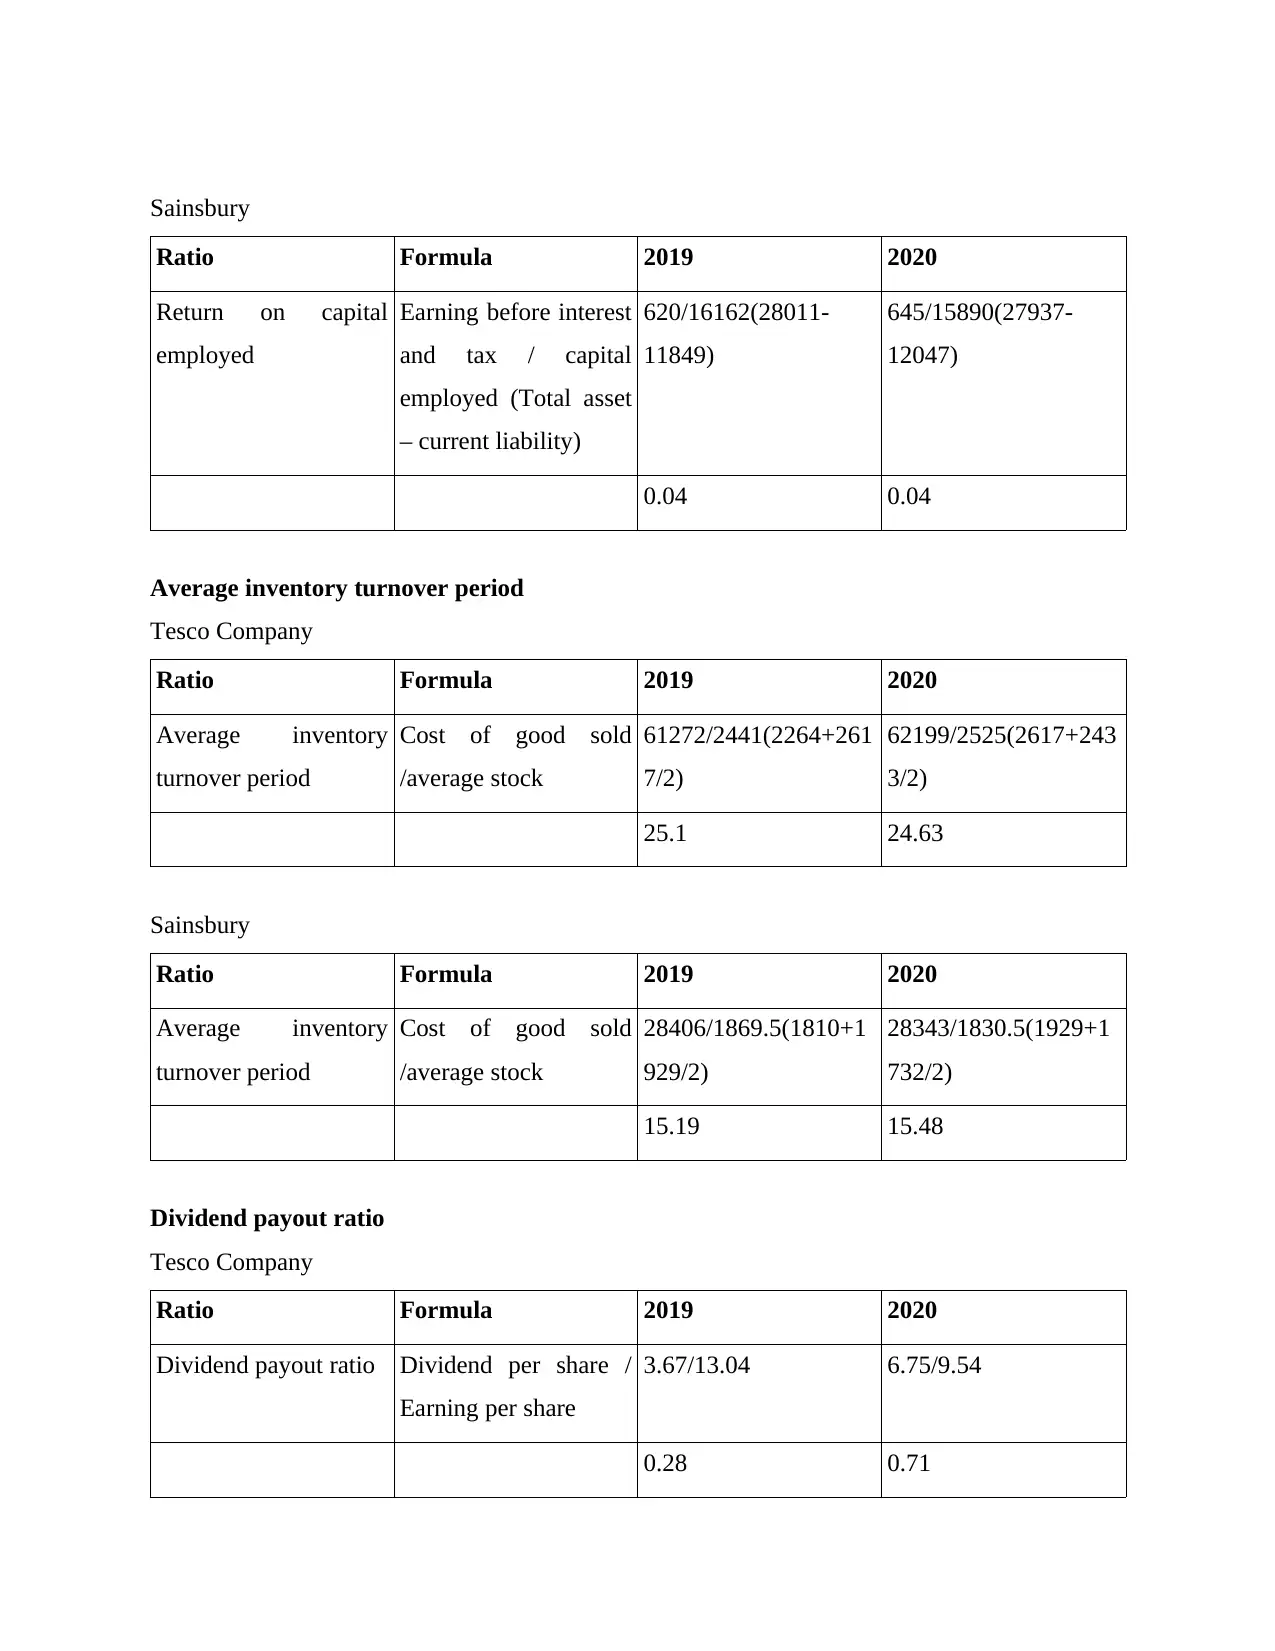
Speaking of Return on Capital Employed, Tesco has fared better than Sainsbury.
Sainsbury has registered ratio a little less. It will have to decrease its operational expenses and
increase earnings (Assrani, D. and et.al., 2018).
Talking of Dividend payout ratio, Sainsbury fares better than Tesco but it also means that
in case of crisis, the company won't be able to afford dividend cuts. A lower dividend payout
ratio in the range of 35 to 55 % will be better.
Speaking of Average Inventory Turnover ratio, Sainsbury has fared better than Tesco as
the turnover of inventory has been less which is better compared to higher ratio. Tesco's
inventory has increased but accordingly it will have to increase its sales.
also improve working capital (Zolfani, Yazdani and Zavadskas, 2018).
Speaking of quick ratio, Tesco is again better in 2020 with ratio standing at 0.58
compared to Sainsbury ratio of 0.49. This means Tesco is better at current assets and thus
liquidity also. Sainsbury has a decrease in inventory here which is a good sign in 2020 analysis,
but the liabilities have simultaneously increased more. Sainsbury has to increase its working
capital by generating more current assets; one way can be suggested to improve its debt
collection period to have more cash component.
Speaking of net and gross profit margin, Tesco fares better than Sainsbury. Sainsbury
will have to increase its earnings according to volume of sales. In net margin, it will have to
decrease upon operational expenses to increase net profit.
Speaking of Gearing ratio, the performance of Tesco again stands better. This ratio
indicates of how the company can pay interest better on its outstanding debt. Although Sainsbury
has performed above benchmark of 1.5 still it can improve its ratio to meet its interest expenses.
Sainsbury will have to increase its revenue in order to meet interest expenses (Camin and et.al.,
2016).
Speaking of P/E ratio, Sainsbury ratio is higher to that of Tesco but a lower ratio will suit
the investor requirements as it can be that market value of share is overhauled. Same in the case
of EPS, Sainsbury has registered EPS in negative. Sainsbury can increase its EPS by lowering
the costs and utilize share buybacks option.
Speaking of Return on Capital Employed, Tesco has fared better than Sainsbury.
Sainsbury has registered ratio a little less. It will have to decrease its operational expenses and
increase earnings (Assrani, D. and et.al., 2018).
Talking of Dividend payout ratio, Sainsbury fares better than Tesco but it also means that
in case of crisis, the company won't be able to afford dividend cuts. A lower dividend payout
ratio in the range of 35 to 55 % will be better.
Speaking of Average Inventory Turnover ratio, Sainsbury has fared better than Tesco as
the turnover of inventory has been less which is better compared to higher ratio. Tesco's
inventory has increased but accordingly it will have to increase its sales.
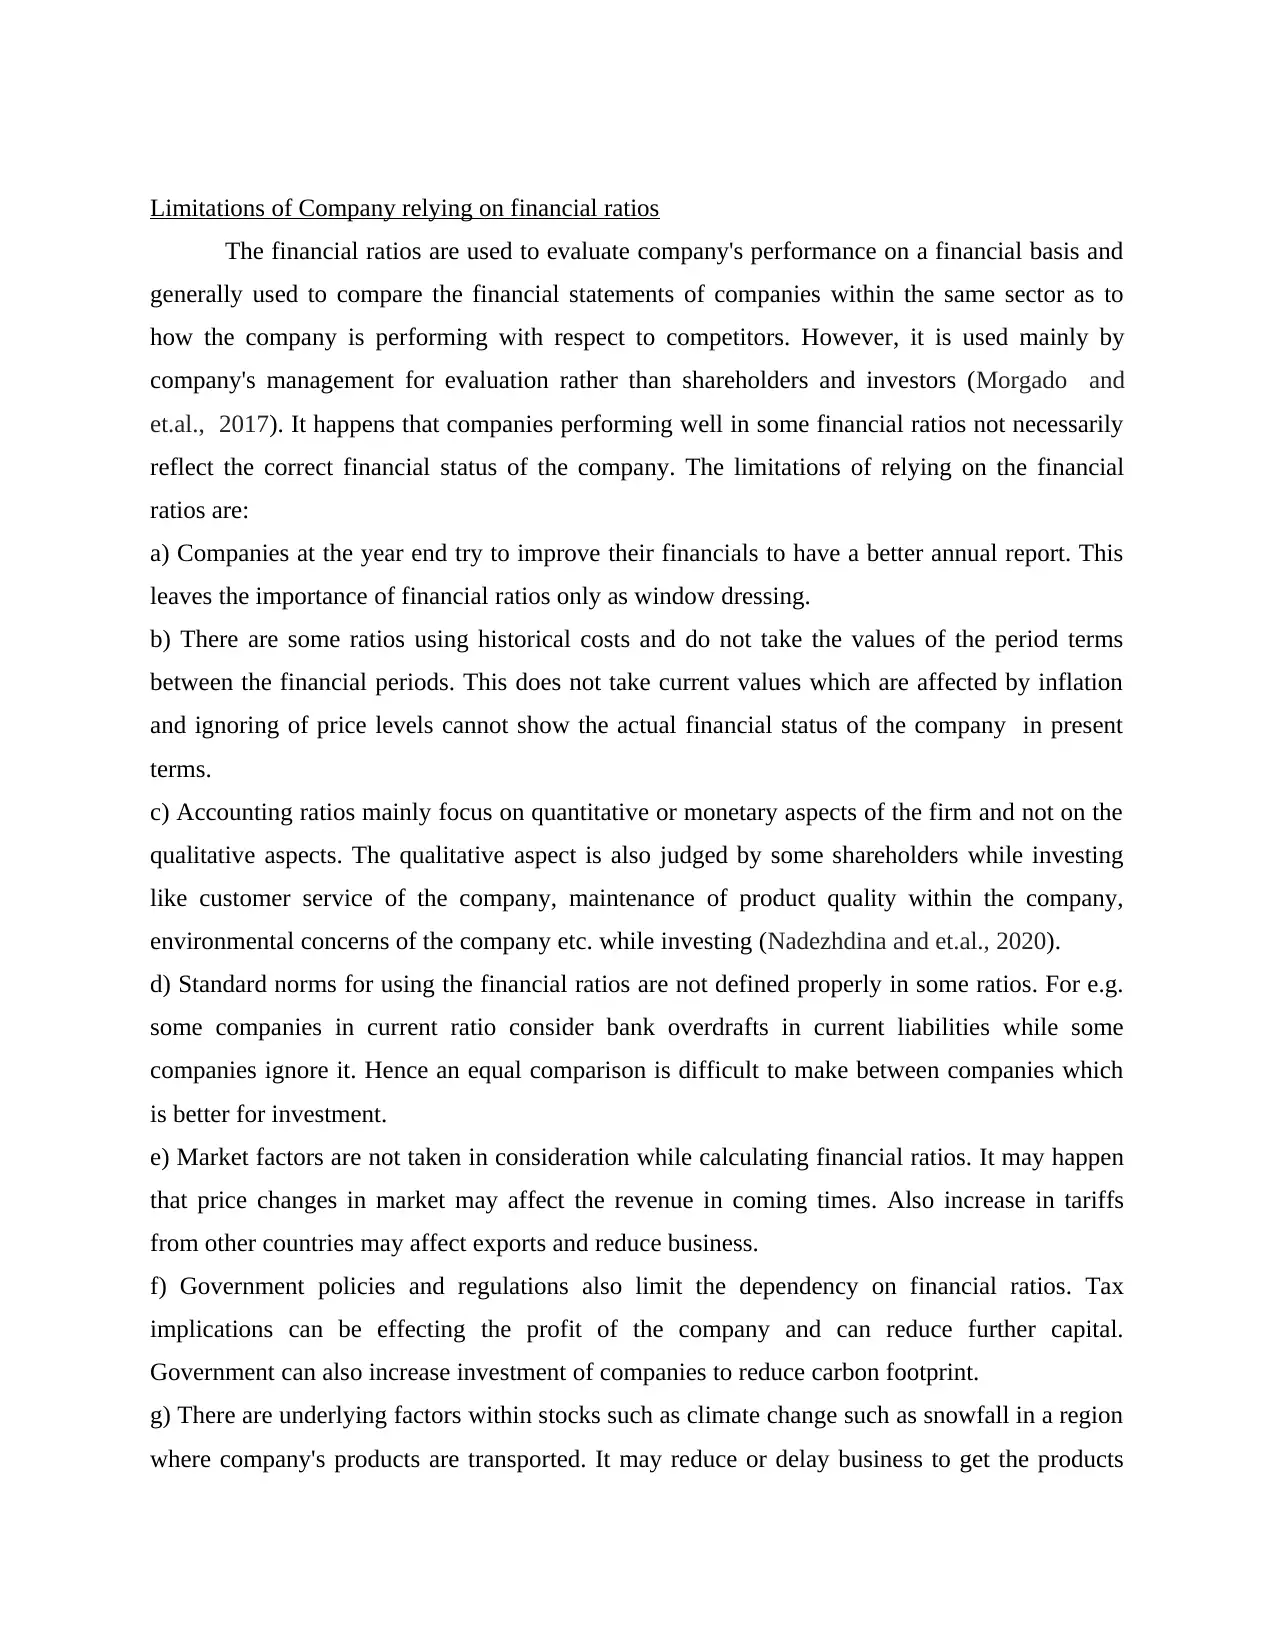
Limitations of Company relying on financial ratios
The financial ratios are used to evaluate company's performance on a financial basis and
generally used to compare the financial statements of companies within the same sector as to
how the company is performing with respect to competitors. However, it is used mainly by
company's management for evaluation rather than shareholders and investors (Morgado and
et.al., 2017). It happens that companies performing well in some financial ratios not necessarily
reflect the correct financial status of the company. The limitations of relying on the financial
ratios are:
a) Companies at the year end try to improve their financials to have a better annual report. This
leaves the importance of financial ratios only as window dressing.
b) There are some ratios using historical costs and do not take the values of the period terms
between the financial periods. This does not take current values which are affected by inflation
and ignoring of price levels cannot show the actual financial status of the company in present
terms.
c) Accounting ratios mainly focus on quantitative or monetary aspects of the firm and not on the
qualitative aspects. The qualitative aspect is also judged by some shareholders while investing
like customer service of the company, maintenance of product quality within the company,
environmental concerns of the company etc. while investing (Nadezhdina and et.al., 2020).
d) Standard norms for using the financial ratios are not defined properly in some ratios. For e.g.
some companies in current ratio consider bank overdrafts in current liabilities while some
companies ignore it. Hence an equal comparison is difficult to make between companies which
is better for investment.
e) Market factors are not taken in consideration while calculating financial ratios. It may happen
that price changes in market may affect the revenue in coming times. Also increase in tariffs
from other countries may affect exports and reduce business.
f) Government policies and regulations also limit the dependency on financial ratios. Tax
implications can be effecting the profit of the company and can reduce further capital.
Government can also increase investment of companies to reduce carbon footprint.
g) There are underlying factors within stocks such as climate change such as snowfall in a region
where company's products are transported. It may reduce or delay business to get the products
Secure Best Marks with AI Grader
Need help grading? Try our AI Grader for instant feedback on your assignments.
transported. Other factors like world economics and trade performance affecting overall
businesses of the world like recession and Covid 19.
h) Speaking of UK, the current political situation of Brexit has impacted the businesses
adversely. It is now difficult to trade at the same terms and rate the country was doing earlier
with other European nations. Tariffs are higher compared to earlier and negotiation of trade
agreements are going on (Nadezhdina and et.al., 2020).
I) It may happen that sometimes the financial statements are manipulated and company shows
more profitability. As financial ratios are dependent on the financial statements inaccuracies will
automatically come in them and thus misrepresentation can occur. Due diligence is required to
wade off these inaccuracies.
j) Change in accounting policies can certainly affect the way financial statements are recorded.
Thus calculations made earlier of financial ratios will not hold value if the financial statements
have been altered according to changed policy. The accountant will have to keep himself update
of the changes (Morgado and et.al., 2017).
k) Change in operational structure of the company from supply chain to product sold and
inventory kept can also influence the financial statements and ratios if done in middle of a
financial term. The company's financials will have to be restated in a new way.
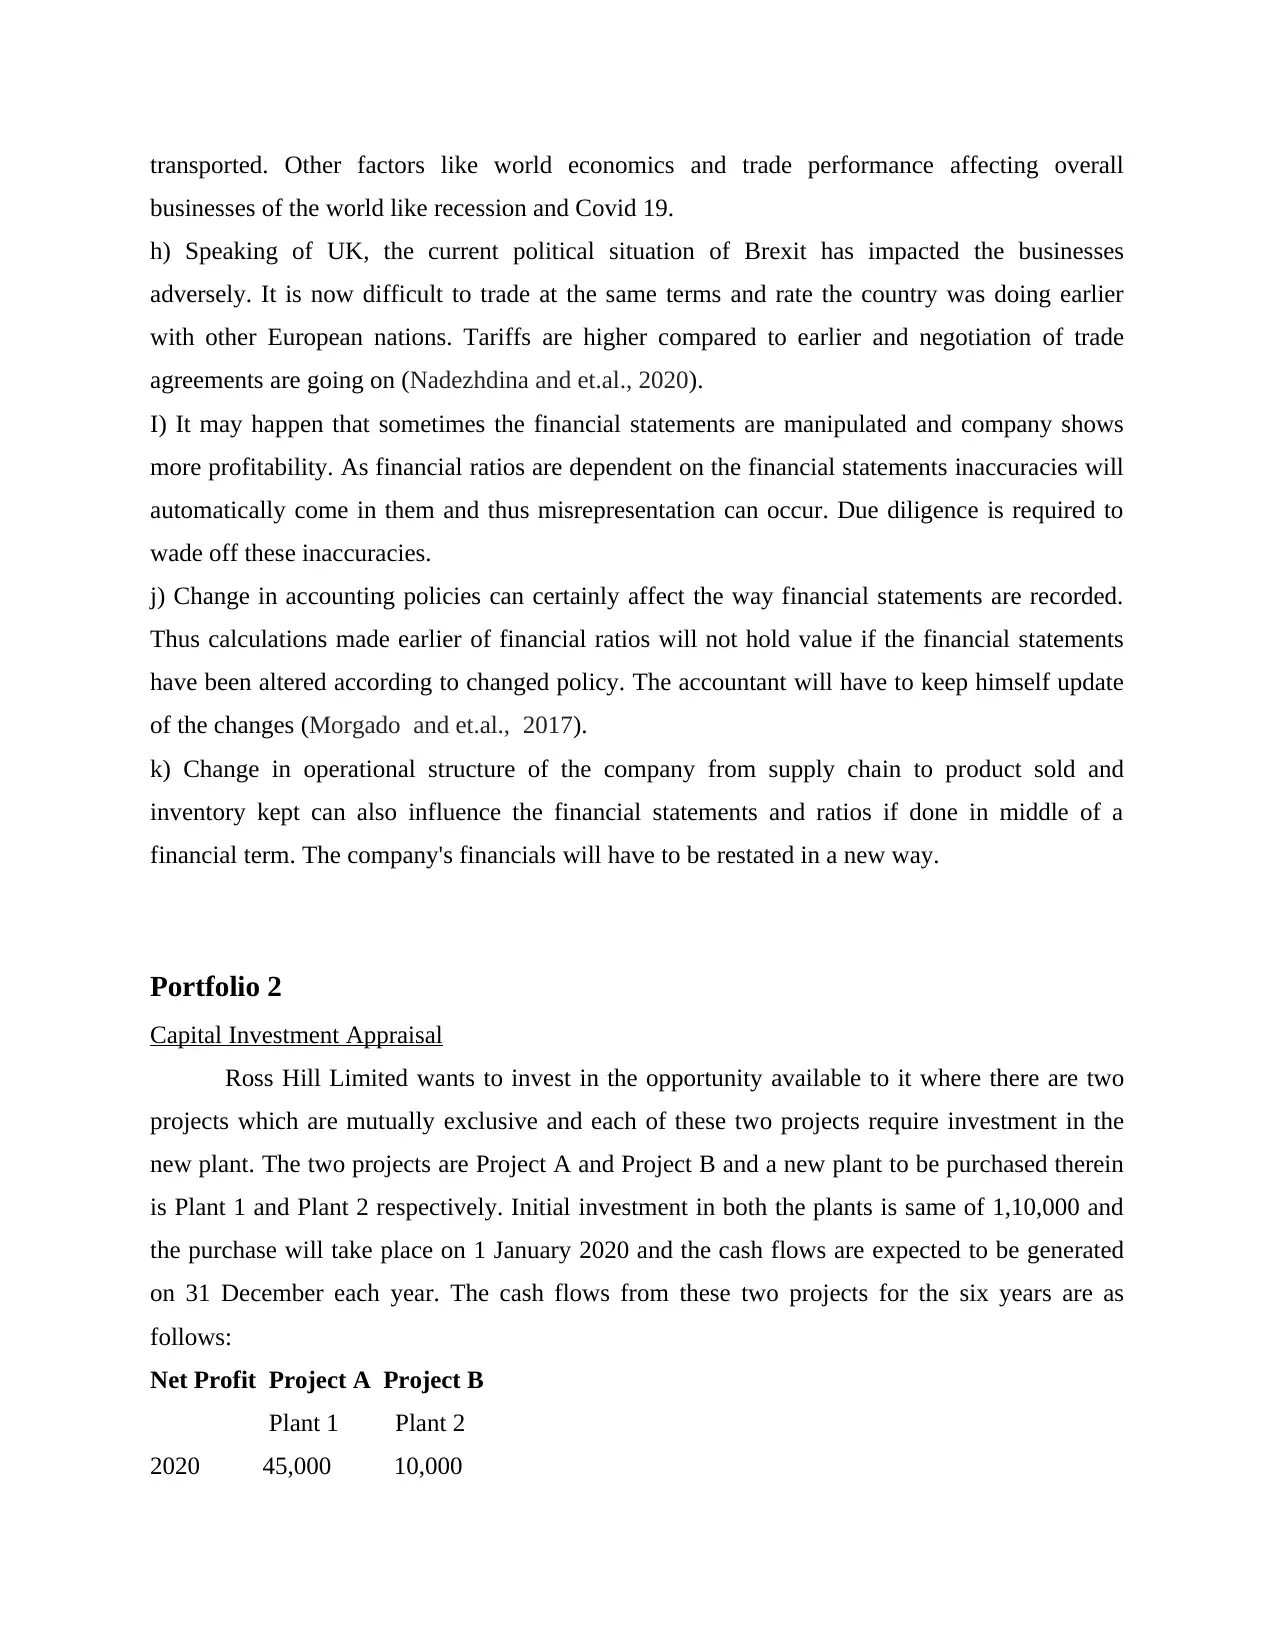
Portfolio 2
Capital Investment Appraisal
Ross Hill Limited wants to invest in the opportunity available to it where there are two
projects which are mutually exclusive and each of these two projects require investment in the
new plant. The two projects are Project A and Project B and a new plant to be purchased therein
is Plant 1 and Plant 2 respectively. Initial investment in both the plants is same of 1,10,000 and
the purchase will take place on 1 January 2020 and the cash flows are expected to be generated
on 31 December each year. The cash flows from these two projects for the six years are as
follows:
Net Profit Project A Project B
Plant 1 Plant 2
2020 45,000 10,000
businesses of the world like recession and Covid 19.
h) Speaking of UK, the current political situation of Brexit has impacted the businesses
adversely. It is now difficult to trade at the same terms and rate the country was doing earlier
with other European nations. Tariffs are higher compared to earlier and negotiation of trade
agreements are going on (Nadezhdina and et.al., 2020).
I) It may happen that sometimes the financial statements are manipulated and company shows
more profitability. As financial ratios are dependent on the financial statements inaccuracies will
automatically come in them and thus misrepresentation can occur. Due diligence is required to
wade off these inaccuracies.
j) Change in accounting policies can certainly affect the way financial statements are recorded.
Thus calculations made earlier of financial ratios will not hold value if the financial statements
have been altered according to changed policy. The accountant will have to keep himself update
of the changes (Morgado and et.al., 2017).
k) Change in operational structure of the company from supply chain to product sold and
inventory kept can also influence the financial statements and ratios if done in middle of a
financial term. The company's financials will have to be restated in a new way.
Portfolio 2
Capital Investment Appraisal
Ross Hill Limited wants to invest in the opportunity available to it where there are two
projects which are mutually exclusive and each of these two projects require investment in the
new plant. The two projects are Project A and Project B and a new plant to be purchased therein
is Plant 1 and Plant 2 respectively. Initial investment in both the plants is same of 1,10,000 and
the purchase will take place on 1 January 2020 and the cash flows are expected to be generated
on 31 December each year. The cash flows from these two projects for the six years are as
follows:
Net Profit Project A Project B
Plant 1 Plant 2
2020 45,000 10,000
2021 45,000 15,000
2022 45,000 25,000
2023 35,000 55,000
2024 35,000 65,000
2025 25,000 50,000
230,000 220,000
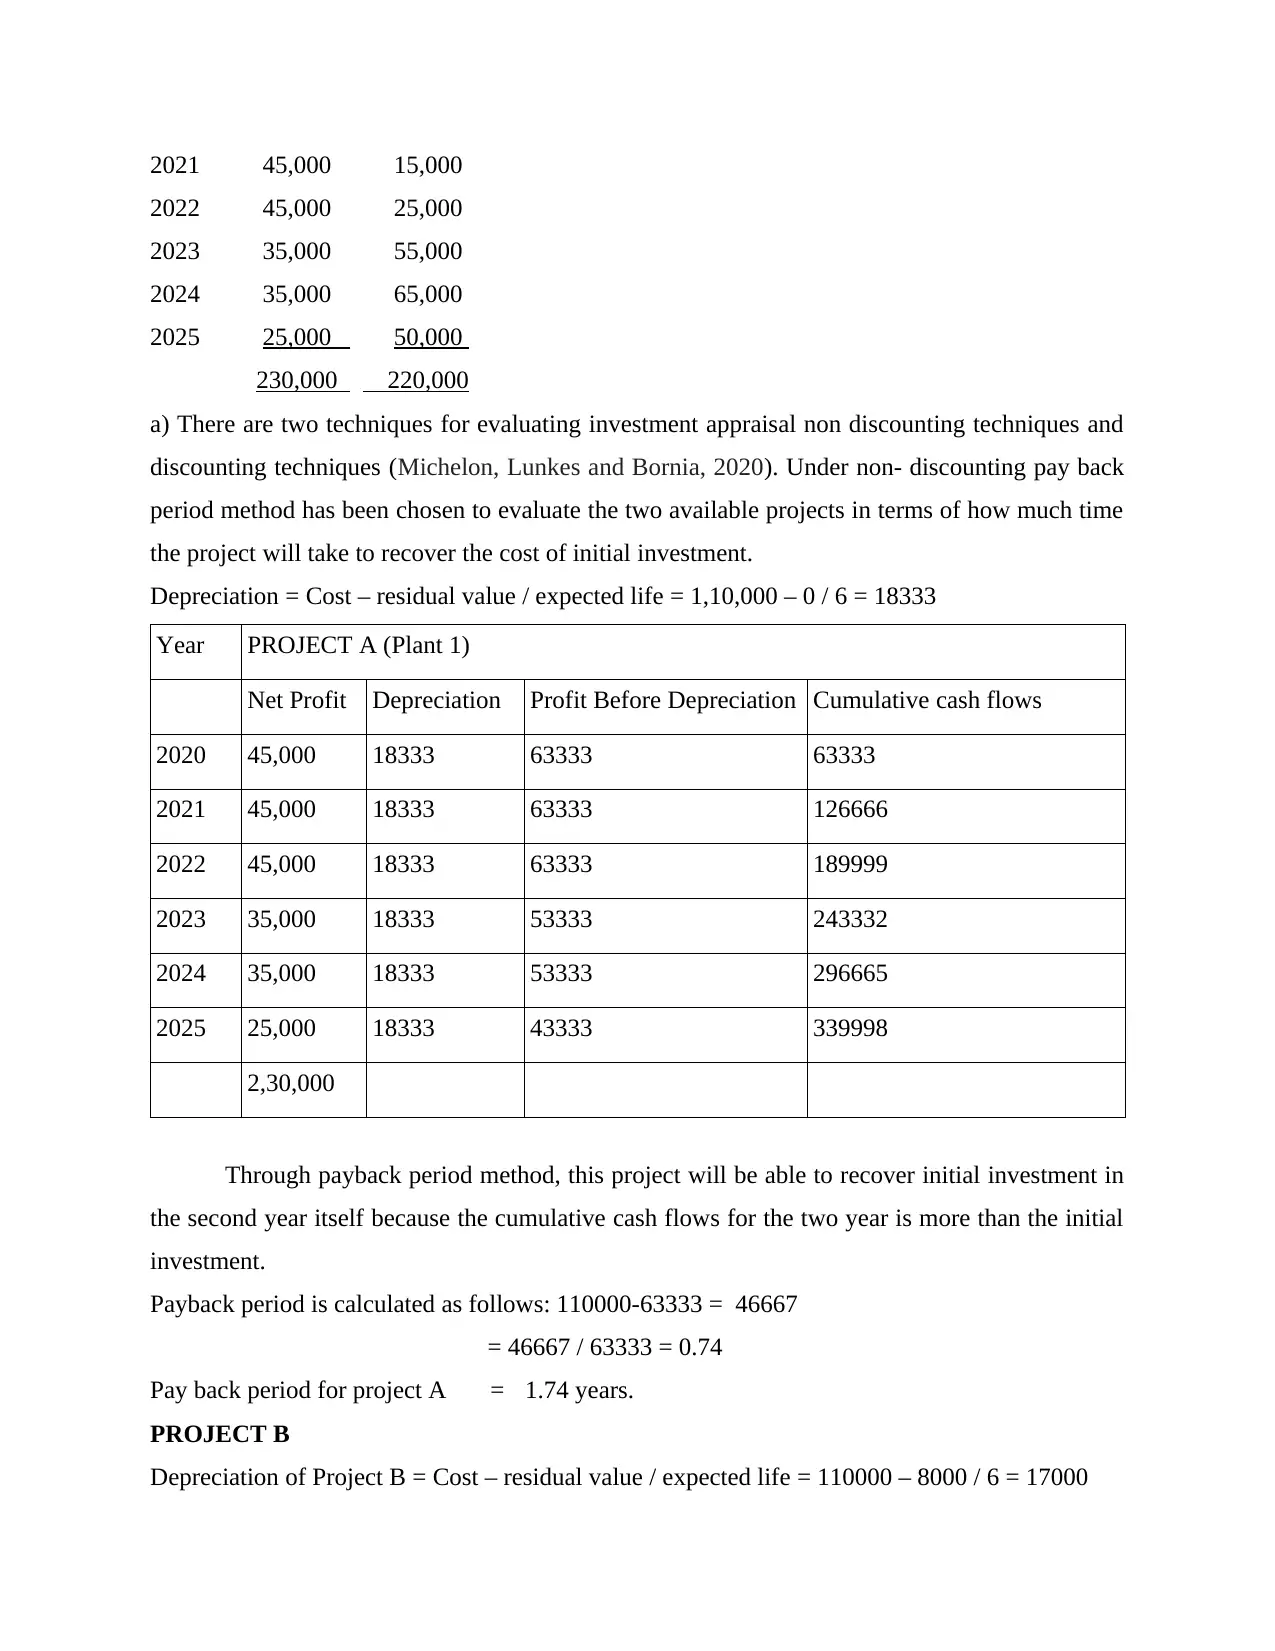
a) There are two techniques for evaluating investment appraisal non discounting techniques and
discounting techniques (Michelon, Lunkes and Bornia, 2020). Under non- discounting pay back
period method has been chosen to evaluate the two available projects in terms of how much time
the project will take to recover the cost of initial investment.
Depreciation = Cost – residual value / expected life = 1,10,000 – 0 / 6 = 18333
Year PROJECT A (Plant 1)
Net Profit Depreciation Profit Before Depreciation Cumulative cash flows
2020 45,000 18333 63333 63333
2021 45,000 18333 63333 126666
2022 45,000 18333 63333 189999
2023 35,000 18333 53333 243332
2024 35,000 18333 53333 296665
2025 25,000 18333 43333 339998
2,30,000
Through payback period method, this project will be able to recover initial investment in
the second year itself because the cumulative cash flows for the two year is more than the initial
investment.
Payback period is calculated as follows: 110000-63333 = 46667
= 46667 / 63333 = 0.74
Pay back period for project A = 1.74 years.
PROJECT B
Depreciation of Project B = Cost – residual value / expected life = 110000 – 8000 / 6 = 17000
2022 45,000 25,000
2023 35,000 55,000
2024 35,000 65,000
2025 25,000 50,000
230,000 220,000
a) There are two techniques for evaluating investment appraisal non discounting techniques and
discounting techniques (Michelon, Lunkes and Bornia, 2020). Under non- discounting pay back
period method has been chosen to evaluate the two available projects in terms of how much time
the project will take to recover the cost of initial investment.
Depreciation = Cost – residual value / expected life = 1,10,000 – 0 / 6 = 18333
Year PROJECT A (Plant 1)
Net Profit Depreciation Profit Before Depreciation Cumulative cash flows
2020 45,000 18333 63333 63333
2021 45,000 18333 63333 126666
2022 45,000 18333 63333 189999
2023 35,000 18333 53333 243332
2024 35,000 18333 53333 296665
2025 25,000 18333 43333 339998
2,30,000
Through payback period method, this project will be able to recover initial investment in
the second year itself because the cumulative cash flows for the two year is more than the initial
investment.
Payback period is calculated as follows: 110000-63333 = 46667
= 46667 / 63333 = 0.74
Pay back period for project A = 1.74 years.
PROJECT B
Depreciation of Project B = Cost – residual value / expected life = 110000 – 8000 / 6 = 17000
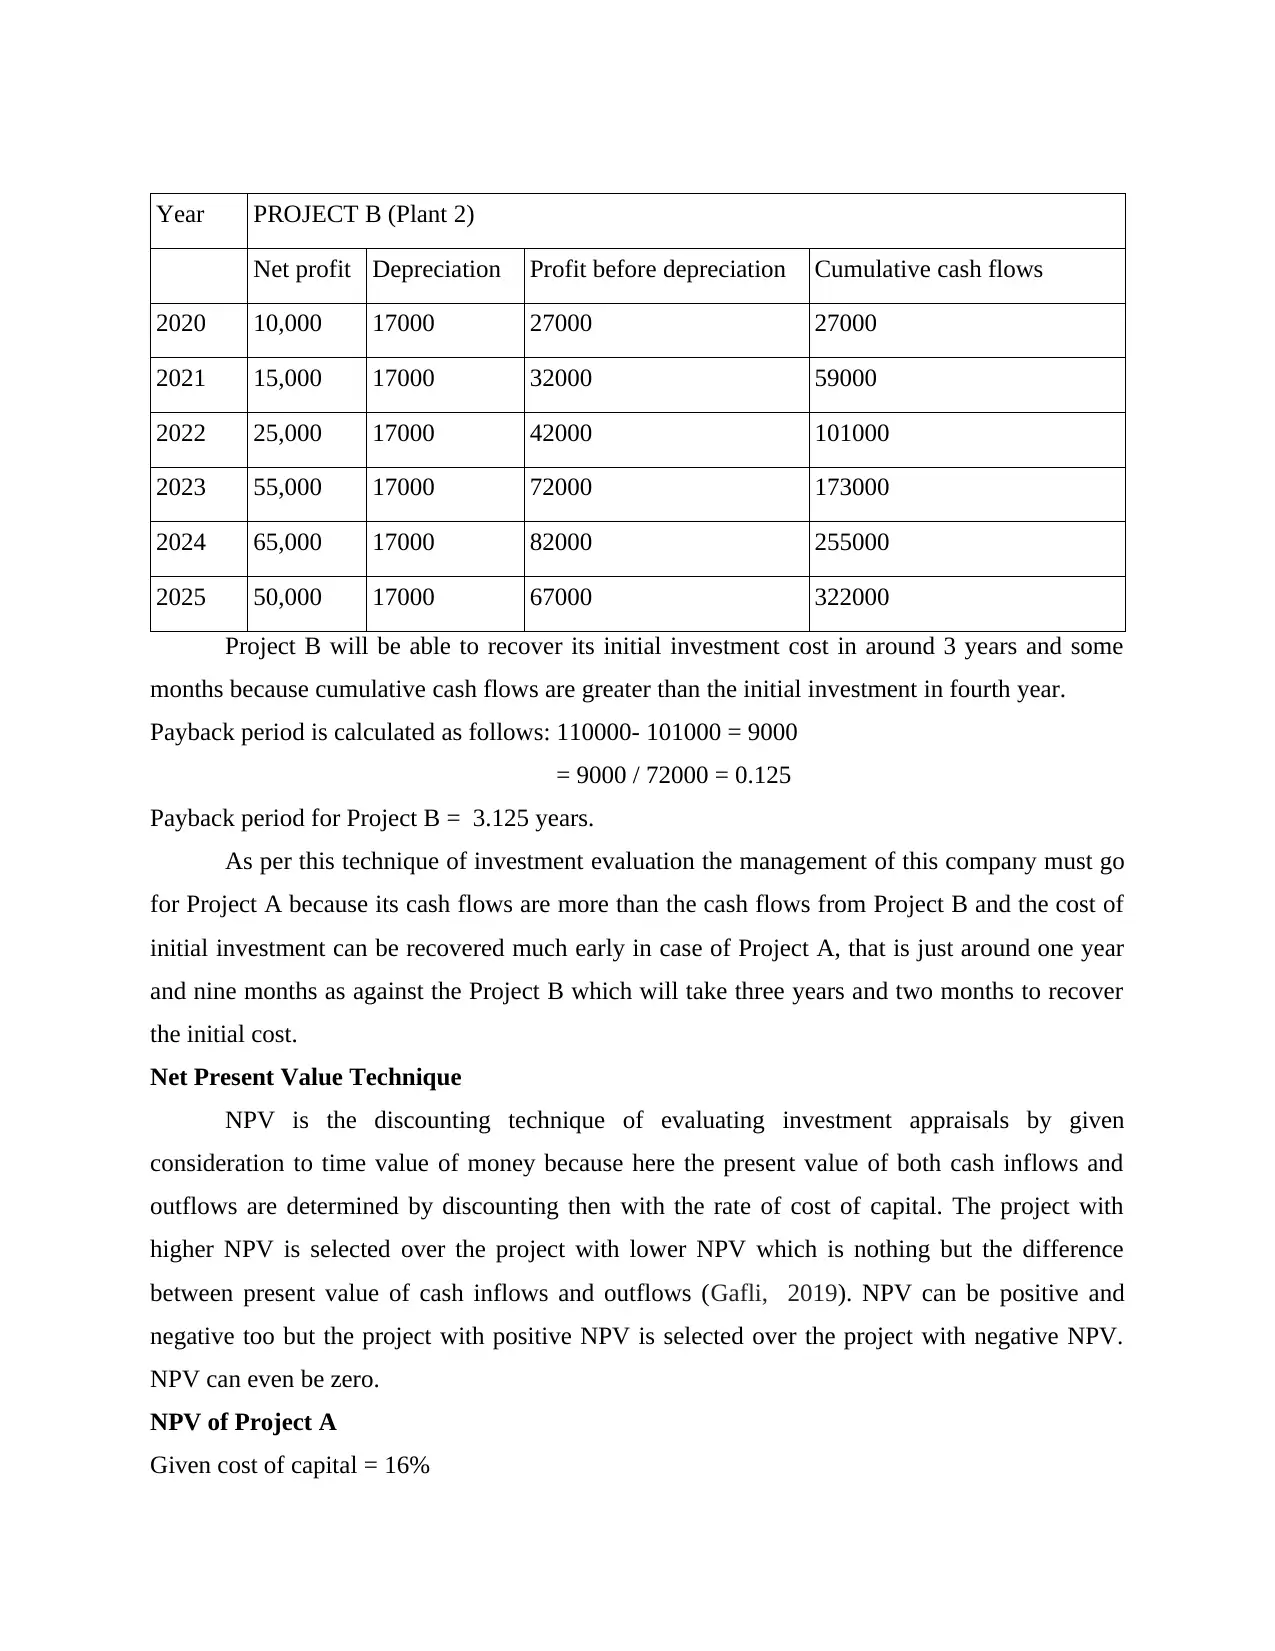
Year PROJECT B (Plant 2)
Net profit Depreciation Profit before depreciation Cumulative cash flows
2020 10,000 17000 27000 27000
2021 15,000 17000 32000 59000
2022 25,000 17000 42000 101000
2023 55,000 17000 72000 173000
2024 65,000 17000 82000 255000
2025 50,000 17000 67000 322000
Project B will be able to recover its initial investment cost in around 3 years and some
months because cumulative cash flows are greater than the initial investment in fourth year.
Payback period is calculated as follows: 110000- 101000 = 9000
= 9000 / 72000 = 0.125
Payback period for Project B = 3.125 years.
As per this technique of investment evaluation the management of this company must go
for Project A because its cash flows are more than the cash flows from Project B and the cost of
initial investment can be recovered much early in case of Project A, that is just around one year
and nine months as against the Project B which will take three years and two months to recover
the initial cost.
Net Present Value Technique
NPV is the discounting technique of evaluating investment appraisals by given
consideration to time value of money because here the present value of both cash inflows and
outflows are determined by discounting then with the rate of cost of capital. The project with
higher NPV is selected over the project with lower NPV which is nothing but the difference
between present value of cash inflows and outflows (Gafli, 2019). NPV can be positive and
negative too but the project with positive NPV is selected over the project with negative NPV.
NPV can even be zero.
NPV of Project A
Given cost of capital = 16%
Paraphrase This Document
Need a fresh take? Get an instant paraphrase of this document with our AI Paraphraser
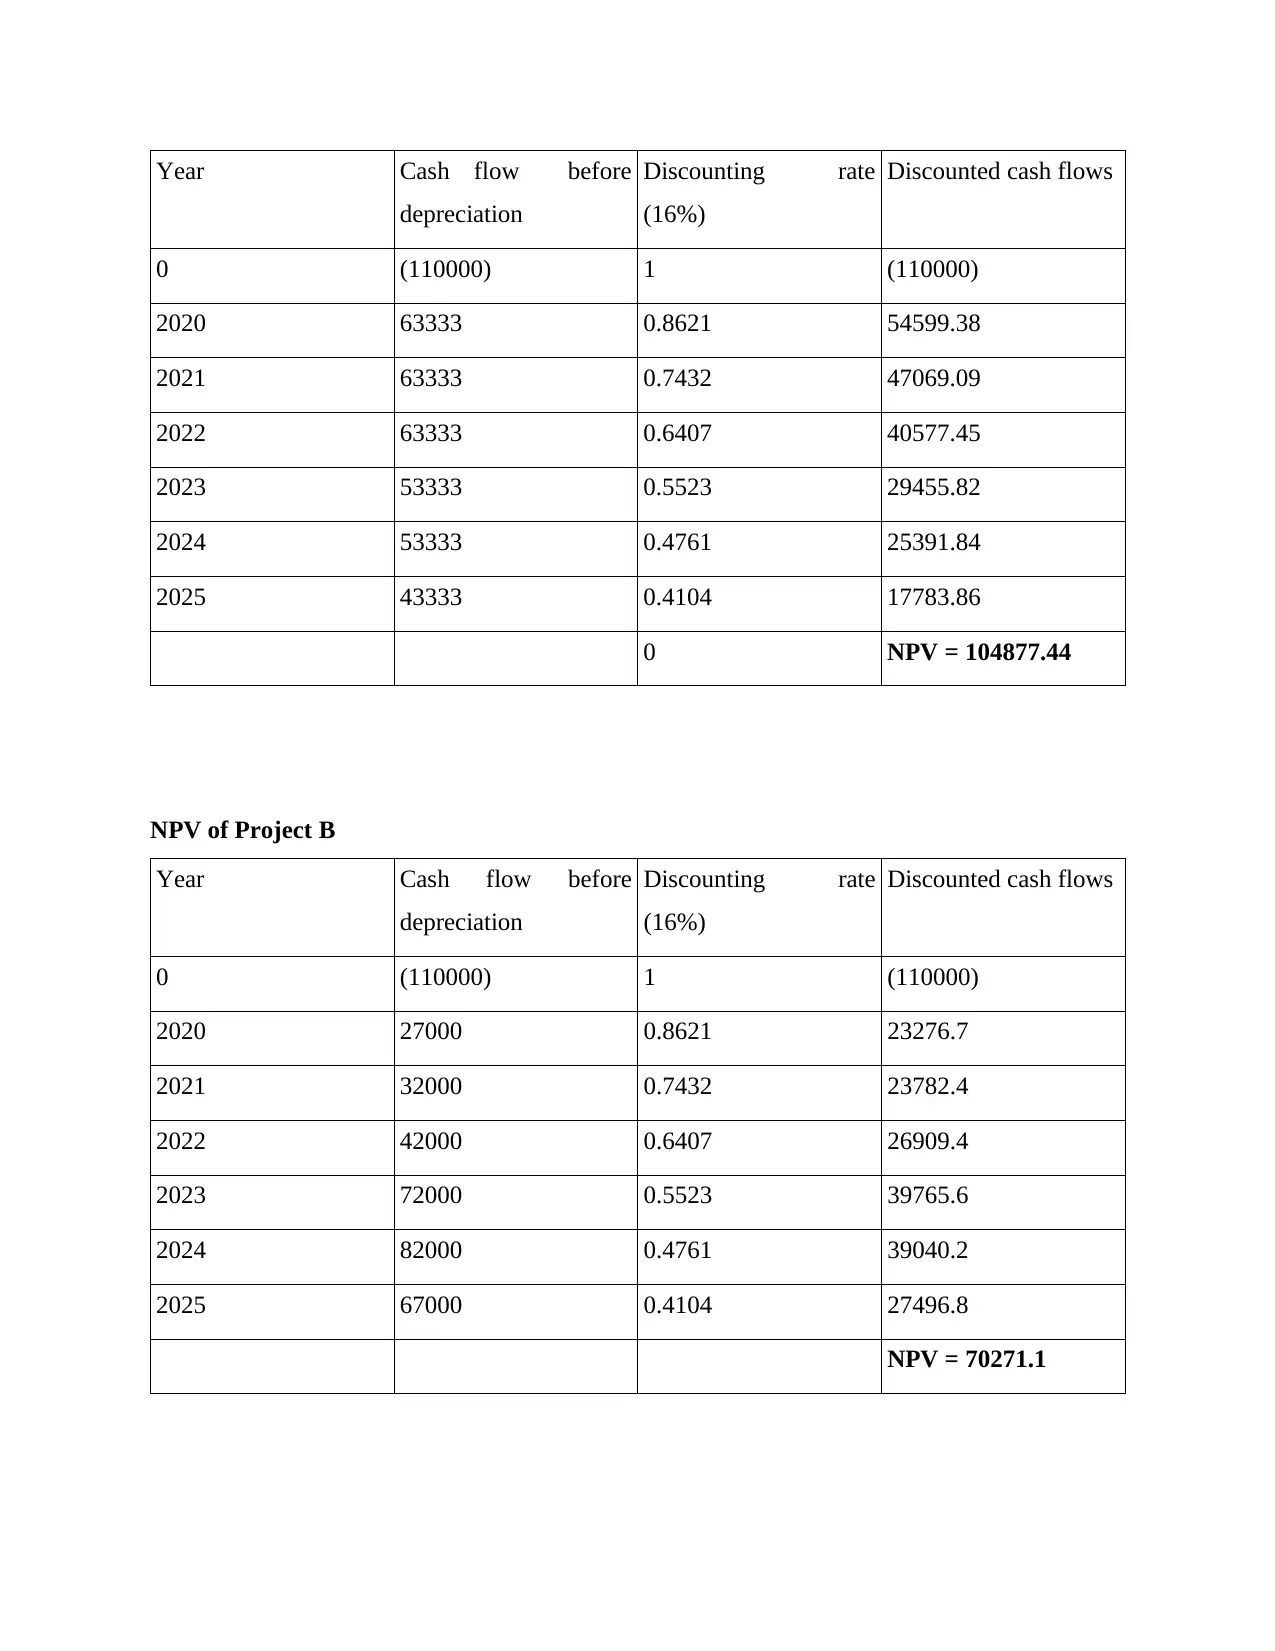
Year Cash flow before
depreciation
Discounting rate
(16%)
Discounted cash flows
0 (110000) 1 (110000)
2020 63333 0.8621 54599.38
2021 63333 0.7432 47069.09
2022 63333 0.6407 40577.45
2023 53333 0.5523 29455.82
2024 53333 0.4761 25391.84
2025 43333 0.4104 17783.86
0 NPV = 104877.44
NPV of Project B
Year Cash flow before
depreciation
Discounting rate
(16%)
Discounted cash flows
0 (110000) 1 (110000)
2020 27000 0.8621 23276.7
2021 32000 0.7432 23782.4
2022 42000 0.6407 26909.4
2023 72000 0.5523 39765.6
2024 82000 0.4761 39040.2
2025 67000 0.4104 27496.8
NPV = 70271.1
depreciation
Discounting rate
(16%)
Discounted cash flows
0 (110000) 1 (110000)
2020 63333 0.8621 54599.38
2021 63333 0.7432 47069.09
2022 63333 0.6407 40577.45
2023 53333 0.5523 29455.82
2024 53333 0.4761 25391.84
2025 43333 0.4104 17783.86
0 NPV = 104877.44
NPV of Project B
Year Cash flow before
depreciation
Discounting rate
(16%)
Discounted cash flows
0 (110000) 1 (110000)
2020 27000 0.8621 23276.7
2021 32000 0.7432 23782.4
2022 42000 0.6407 26909.4
2023 72000 0.5523 39765.6
2024 82000 0.4761 39040.2
2025 67000 0.4104 27496.8
NPV = 70271.1
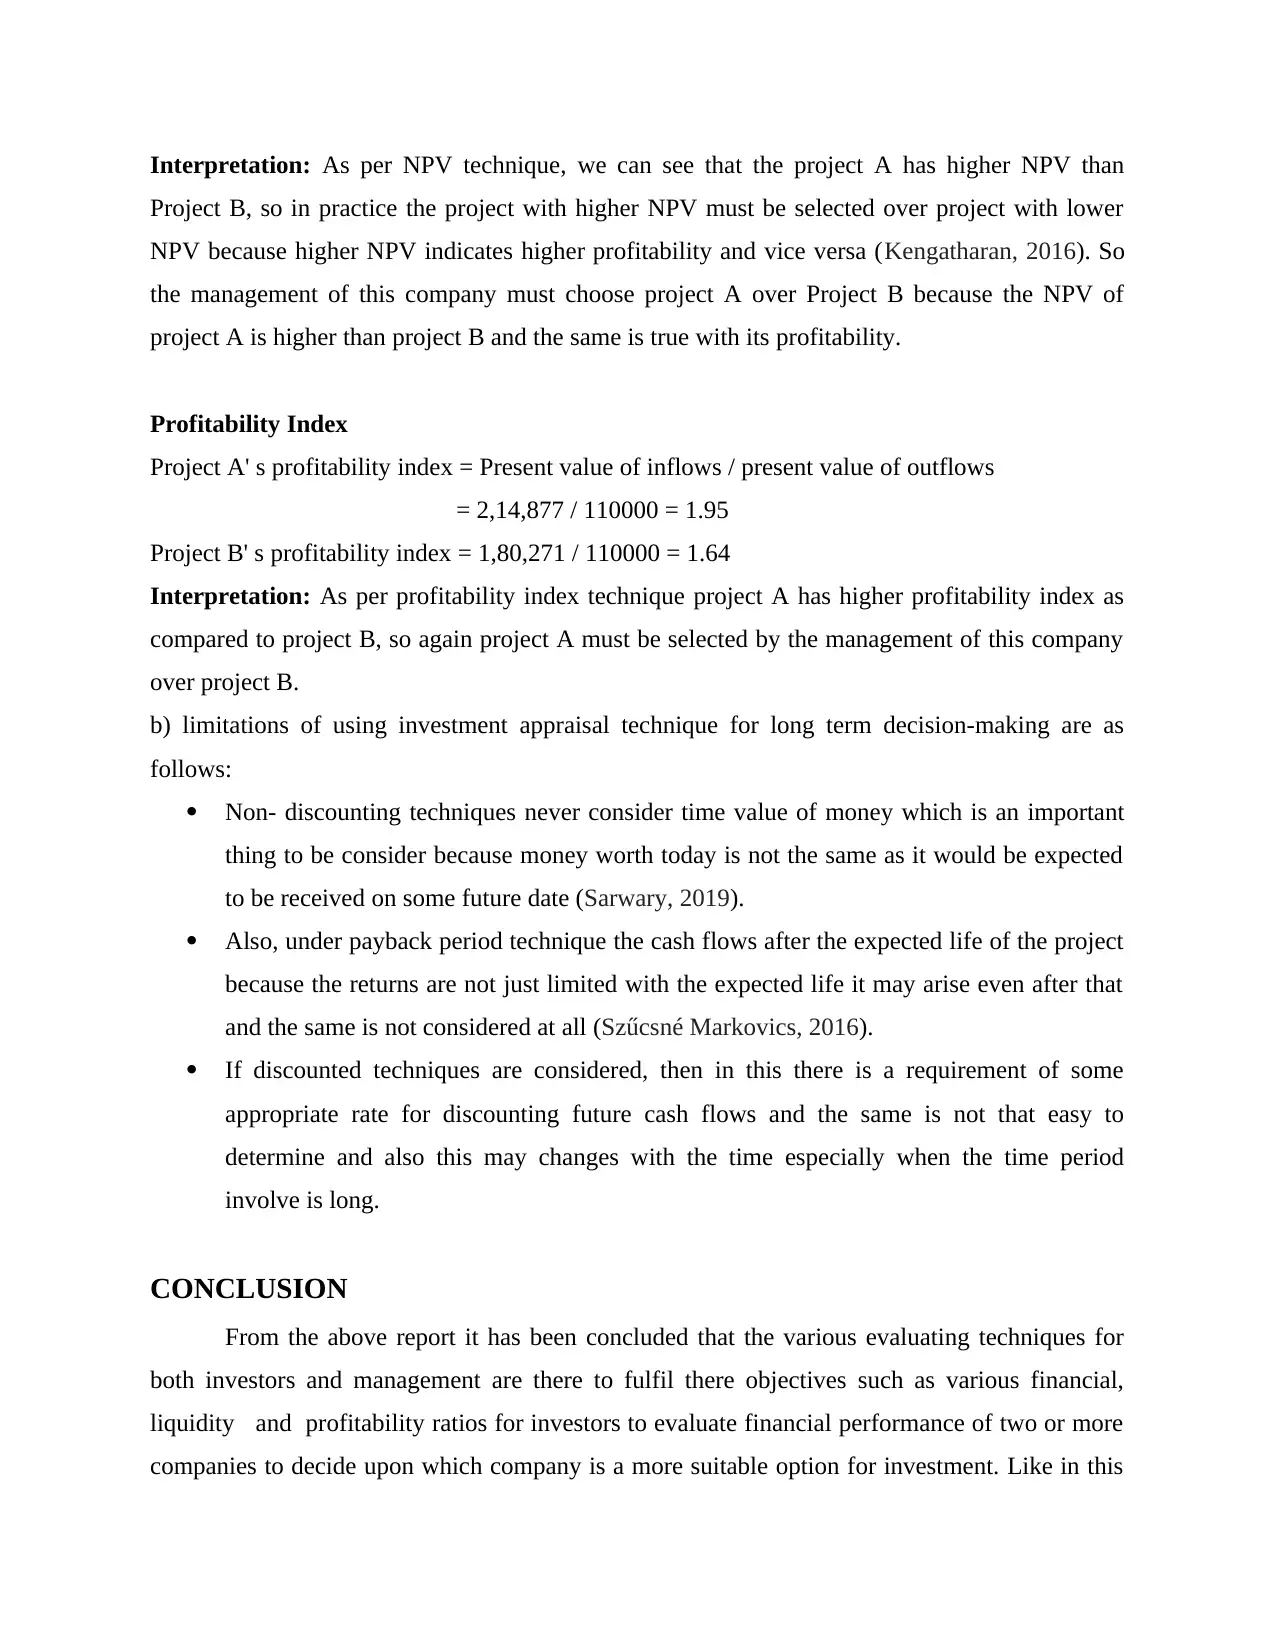
Interpretation: As per NPV technique, we can see that the project A has higher NPV than
Project B, so in practice the project with higher NPV must be selected over project with lower
NPV because higher NPV indicates higher profitability and vice versa (Kengatharan, 2016). So
the management of this company must choose project A over Project B because the NPV of
project A is higher than project B and the same is true with its profitability.
Profitability Index
Project A' s profitability index = Present value of inflows / present value of outflows
= 2,14,877 / 110000 = 1.95
Project B' s profitability index = 1,80,271 / 110000 = 1.64
Interpretation: As per profitability index technique project A has higher profitability index as
compared to project B, so again project A must be selected by the management of this company
over project B.
b) limitations of using investment appraisal technique for long term decision-making are as
follows:
Non- discounting techniques never consider time value of money which is an important
thing to be consider because money worth today is not the same as it would be expected
to be received on some future date (Sarwary, 2019).
Also, under payback period technique the cash flows after the expected life of the project
because the returns are not just limited with the expected life it may arise even after that
and the same is not considered at all (Szűcsné Markovics, 2016).
If discounted techniques are considered, then in this there is a requirement of some
appropriate rate for discounting future cash flows and the same is not that easy to
determine and also this may changes with the time especially when the time period
involve is long.
CONCLUSION
From the above report it has been concluded that the various evaluating techniques for
both investors and management are there to fulfil there objectives such as various financial,
liquidity and profitability ratios for investors to evaluate financial performance of two or more
companies to decide upon which company is a more suitable option for investment. Like in this
report various ratio are calculated to enable investors to choose from two companies on the basis
of their financial performance that is, Tesco and Sainsbury's. As such both are competitors of
each other in the supermarket industry of UK but for investment purpose their financial
performance must well evaluated. In the second portfolio, where Ross Hill limited with two
mutually exclusive projects has to decide upon which one is more suitable to invest in, so that the
project with higher profitability can be selected over the lower one. In this report both
discounting and non-discounting of capital-budgeting techniques are applied to both project A
and Project B, where in all the techniques like payback period, NPV and profitability index
Project A overrides project B. Through these techniques the management of Ross Hill gets an
idea about the profitability and suitability of both the projects in advance.
Secure Best Marks with AI Grader
Need help grading? Try our AI Grader for instant feedback on your assignments.
REFERENCES
Books and Journals
Assrani, D. and et.al., 2018. Penentuan Penerima Bantuan Siswa Miskin Menerapkan Metode
Multi Objective Optimization on The Basis of Ratio Analysis (MOORA). JURIKOM
(Jurnal Riset Komputer). 5(1). pp.1-5.
Camin, F. and et.al., 2016. Stable isotope ratio analysis for assessing the authenticity of food of
animal origin. Comprehensive Reviews in Food Science and Food Safety.15(5). pp.868-
877.
Choi, K.B. and et.al.,2018. Amplification ratio analysis of a bridge-type mechanical
amplification mechanism based on a fully compliant model. Mechanism and Machine
Theory. 121. pp.355-372.
Gafli, G. F. M., 2019. The Extent of Capital Budgeting Techniques In Evaluating Capital
Investment Decision Case Study: Development of Photovoltaic Power Plant
Project(Doctoral dissertation, Sekolah Tinggi Bisnis IPMI).
Kengatharan, L., 2016. Capital budgeting theory and practice: a review and agenda for future
research. Applied Economics and Finance, 3(2), pp.15-38.
Michelon, P. D. S., Lunkes, R. J. and Bornia, A. C., 2020. Capital budgeting: a systematic
review of the literature. Production, 30.
Morgado, F.F. and et.al., 2017. Scale development: ten main limitations and recommendations
to improve future research practices. Psicologia: Reflexão e Crítica.30.
Nadezhdina, S. and et.al., 2020. OPPORTUNITIES AND LIMITATIONS OF THE
INDICATOR SYSTEM FOR FINANCIAL DIAGNOSTICS AND BANKRUPTCY
FORECASTING. Economic and Social Development: Book of Proceedings. pp.473-481.
Rashid, C. A., 2018. Efficiency of Financial Ratios Analysis for Evaluating Companies’
Liquidity. International Journal of Social Sciences & Educational Studies. 4(4). p.110.
Sarwary, Z., 2019. Capital budgeting techniques in SMEs: A literature review. Journal of
Accounting and Finance, 19(3).
Szűcsné Markovics, K., 2016. Capital budgeting methods used in some European countries and
in the United States. Universal Journal of Management, 4(6), pp.348-360.
Zolfani, S.H., Yazdani, M. and Zavadskas, E.K., 2018. An extended stepwise weight assessment
ratio analysis (SWARA) method for improving criteria prioritization process. Soft
Computing. 22(22). pp.7399-7405.
Online:
Financial performance of Tesco Company, 2020. [Online]. Available Through:
<https://tools.morningstar.co.uk/uk/stockreport/default.aspx?
tab=10&vw=bs&SecurityToken=0P00007OYV%5D3%5D0%5DE0WWE
%24%24ALL&Id=0P00007OYV&ClientFund=0&CurrencyId=BAS>.
Financial performance of Sainsbury Company, 2020. [Online]. Available Through:

<http://tools.morningstar.co.uk/uk/stockreport/default.aspx?
tab=10&vw=is&SecurityToken=0P000090N6%5D3%5D0%5DE0WWE
%24%24ALL&Id=0P000090N6&ClientFund=0&CurrencyId=BAS>.
tab=10&vw=is&SecurityToken=0P000090N6%5D3%5D0%5DE0WWE
%24%24ALL&Id=0P000090N6&ClientFund=0&CurrencyId=BAS>.
1 out of 18
Related Documents


Your All-in-One AI-Powered Toolkit for Academic Success.
+13062052269
info@desklib.com
Available 24*7 on WhatsApp / Email
![[object Object]](/_next/static/media/star-bottom.7253800d.svg)
Unlock your academic potential
© 2024 | Zucol Services PVT LTD | All rights reserved.