LSBM203 Managerial Finance: Comparative Financial Performance Report
VerifiedAdded on 2023/01/16
|21
|4250
|1
Report
AI Summary
This report presents a comprehensive analysis of the financial performance of GlaxoSmithKline (GSK) and Reckitt Benckiser (RB) using various financial ratios. The introduction provides an overview of managerial finance, emphasizing its role in decision-making and financial structure. Task 1 involves calculating and analyzing key financial ratios, including current ratio, quick ratio, net profit margin, gross profit margin, gearing ratio, price-earning ratio, earning per share, return on capital employed, average inventory turnover period, and dividend payout ratio for both companies over two years (2017-2018). The analysis compares the performance of GSK and RB, highlighting their strengths and weaknesses, and includes recommendations for improving the financial performance of the poorly performing business. Task 2 focuses on investment appraisal techniques, calculating relevant ratios, and discussing their limitations. The conclusion summarizes the findings and overall financial health of the companies.

Managerial Finance
Paraphrase This Document
Need a fresh take? Get an instant paraphrase of this document with our AI Paraphraser
Table of Contents
INTRODUCTION...........................................................................................................................1
TASK 1............................................................................................................................................1
(a) Calculation of different financial ratios for two years (2017 – 2018):..................................1
(b) Analysis of performance of both of companies.....................................................................5
...................................................................................................................................................10
(c). Recommendations of how the financial performance of the poorly performing business
can be improved:.......................................................................................................................11
(d) Limitations of financial ratios:............................................................................................11
TASK 2..........................................................................................................................................12
(a). Calculation of financial ratios for two years (2017 – 2018):..............................................12
(b) Limitations of using investment appraisal techniques.........................................................16
CONCLUSION..............................................................................................................................17
REFERENCES..............................................................................................................................19
INTRODUCTION
Managerial finance is way of finance which is an interdisciplinary approach that carry out
both types of accounting management and corporate. Through financial management develop
values and business eligibility based on the resources amongst competing business possibilities.
It is related with the term of financial activities that focus on the financial structure of an
organisation. On the basis of different roles and tasks management can take appropriate decision
and according that manage all the financial activities (Huang, Shieh and Kao, 2016). The
particular project study mainly based on the Glaxo smith Kline plc and Reckitt Benckiser Group
plc. Glaxo is British international Pharmaceutical production company which is established in
Brentford, England. On the other side, Reckitt plc is UK's international consumer goods
organisation the headquarter of the company is situated at Slough, England (About Reckitt
Benckiser Group plc, 2019). Both are manufacturing organisation and aware for hygiene, health
care and home products which is offer to customers. The main aim of this study that provide help
to all investors in decision making procedure which is related with the business which is more
viable as per the investment purpose. Along with there are defined about the different investment
appraisal techniques and compute all the relevant calculations in the context in decision making
procedure.
TASK 1
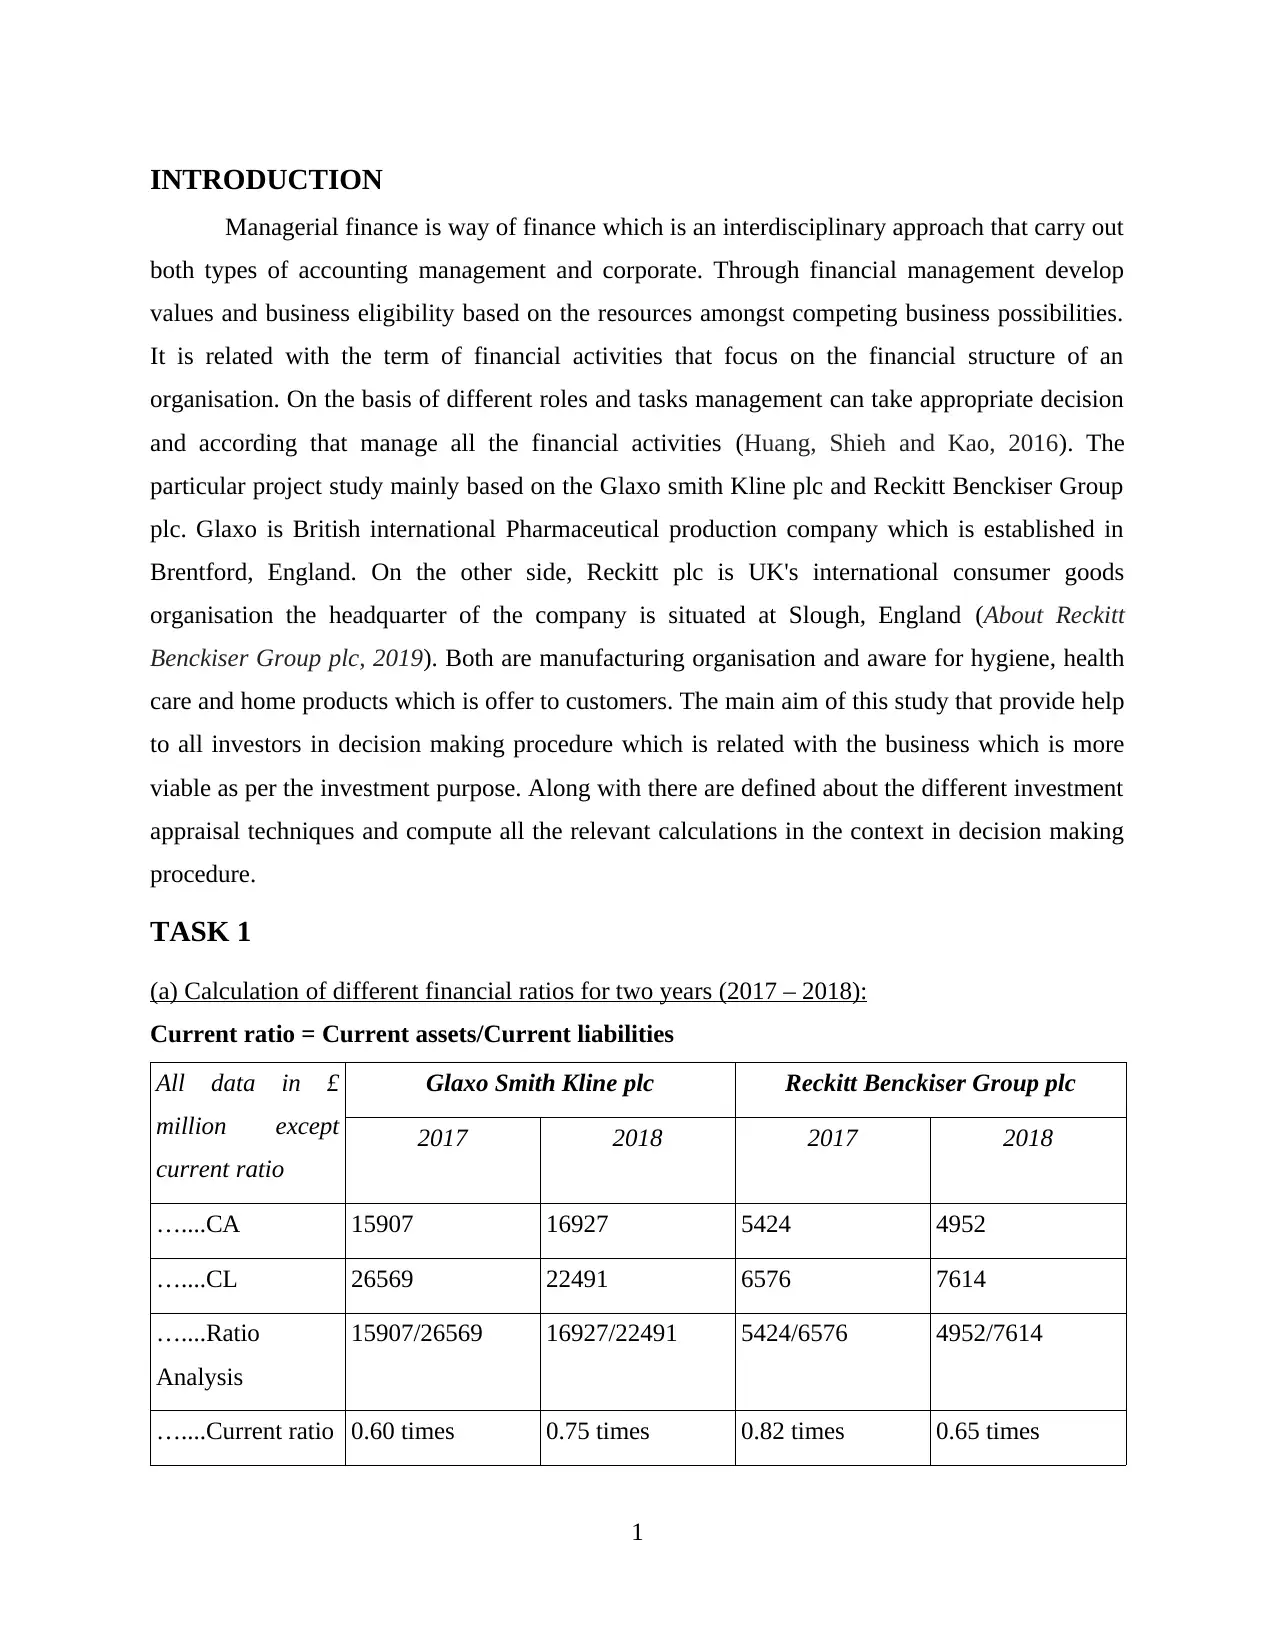
(a) Calculation of different financial ratios for two years (2017 – 2018):
Current ratio = Current assets/Current liabilities
All data in £
million except
current ratio
Glaxo Smith Kline plc Reckitt Benckiser Group plc
2017 2018 2017 2018
…....CA 15907 16927 5424 4952
…....CL 26569 22491 6576 7614
…....Ratio
Analysis
15907/26569 16927/22491 5424/6576 4952/7614
…....Current ratio 0.60 times 0.75 times 0.82 times 0.65 times
1
Managerial finance is way of finance which is an interdisciplinary approach that carry out
both types of accounting management and corporate. Through financial management develop
values and business eligibility based on the resources amongst competing business possibilities.
It is related with the term of financial activities that focus on the financial structure of an
organisation. On the basis of different roles and tasks management can take appropriate decision
and according that manage all the financial activities (Huang, Shieh and Kao, 2016). The
particular project study mainly based on the Glaxo smith Kline plc and Reckitt Benckiser Group
plc. Glaxo is British international Pharmaceutical production company which is established in
Brentford, England. On the other side, Reckitt plc is UK's international consumer goods
organisation the headquarter of the company is situated at Slough, England (About Reckitt
Benckiser Group plc, 2019). Both are manufacturing organisation and aware for hygiene, health
care and home products which is offer to customers. The main aim of this study that provide help
to all investors in decision making procedure which is related with the business which is more
viable as per the investment purpose. Along with there are defined about the different investment
appraisal techniques and compute all the relevant calculations in the context in decision making
procedure.
TASK 1
(a) Calculation of different financial ratios for two years (2017 – 2018):
Current ratio = Current assets/Current liabilities
All data in £
million except
current ratio
Glaxo Smith Kline plc Reckitt Benckiser Group plc
2017 2018 2017 2018
…....CA 15907 16927 5424 4952
…....CL 26569 22491 6576 7614
…....Ratio
Analysis
15907/26569 16927/22491 5424/6576 4952/7614
…....Current ratio 0.60 times 0.75 times 0.82 times 0.65 times
1
⊘ This is a preview!⊘
Do you want full access?
Subscribe today to unlock all pages.
Trusted by 1+ million students worldwide
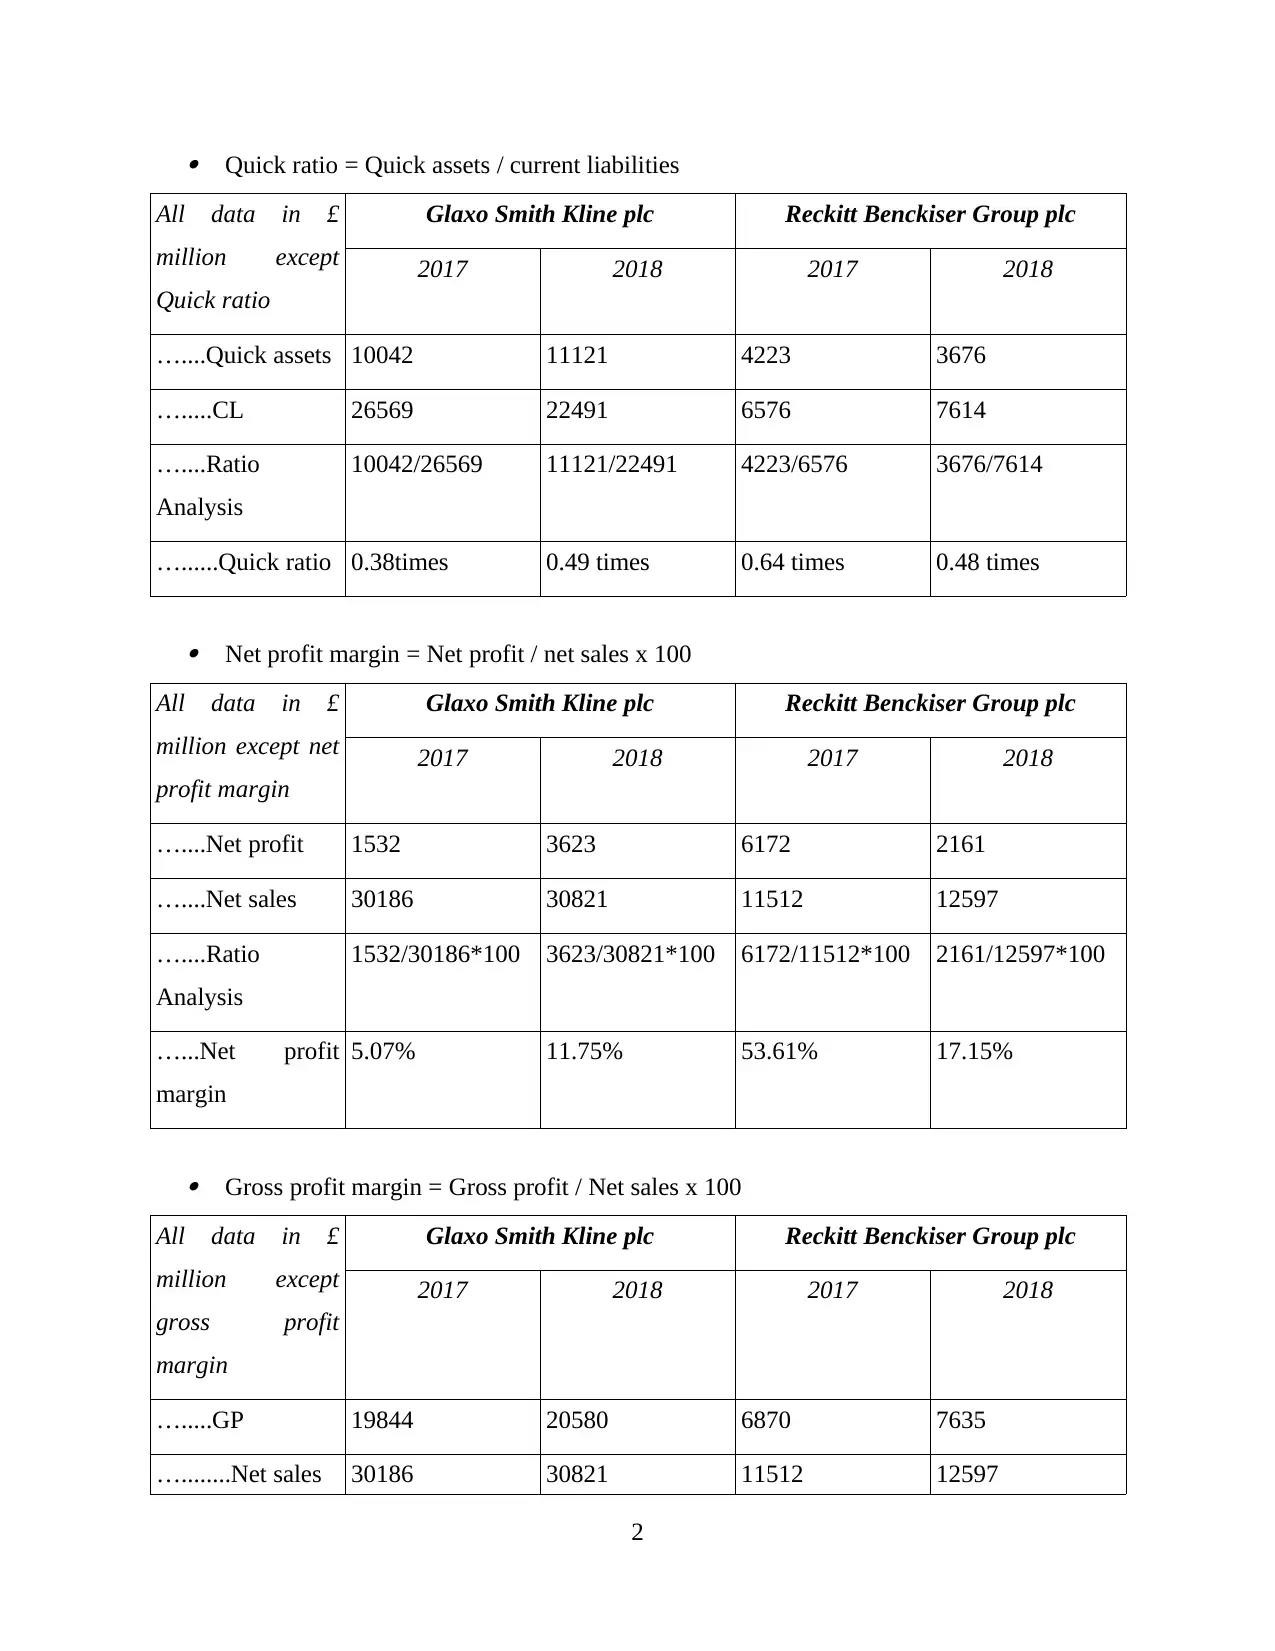
Quick ratio = Quick assets / current liabilities
All data in £
million except
Quick ratio
Glaxo Smith Kline plc Reckitt Benckiser Group plc
2017 2018 2017 2018
…....Quick assets 10042 11121 4223 3676
….....CL 26569 22491 6576 7614
…....Ratio
Analysis
10042/26569 11121/22491 4223/6576 3676/7614
…......Quick ratio 0.38times 0.49 times 0.64 times 0.48 times
Net profit margin = Net profit / net sales x 100
All data in £
million except net
profit margin
Glaxo Smith Kline plc Reckitt Benckiser Group plc
2017 2018 2017 2018
…....Net profit 1532 3623 6172 2161
…....Net sales 30186 30821 11512 12597
…....Ratio
Analysis
1532/30186*100 3623/30821*100 6172/11512*100 2161/12597*100
…...Net profit
margin
5.07% 11.75% 53.61% 17.15%
Gross profit margin = Gross profit / Net sales x 100
All data in £
million except
gross profit
margin
Glaxo Smith Kline plc Reckitt Benckiser Group plc
2017 2018 2017 2018
….....GP 19844 20580 6870 7635
…........Net sales 30186 30821 11512 12597
2
All data in £
million except
Quick ratio
Glaxo Smith Kline plc Reckitt Benckiser Group plc
2017 2018 2017 2018
…....Quick assets 10042 11121 4223 3676
….....CL 26569 22491 6576 7614
…....Ratio
Analysis
10042/26569 11121/22491 4223/6576 3676/7614
…......Quick ratio 0.38times 0.49 times 0.64 times 0.48 times
Net profit margin = Net profit / net sales x 100
All data in £
million except net
profit margin
Glaxo Smith Kline plc Reckitt Benckiser Group plc
2017 2018 2017 2018
…....Net profit 1532 3623 6172 2161
…....Net sales 30186 30821 11512 12597
…....Ratio
Analysis
1532/30186*100 3623/30821*100 6172/11512*100 2161/12597*100
…...Net profit
margin
5.07% 11.75% 53.61% 17.15%
Gross profit margin = Gross profit / Net sales x 100
All data in £
million except
gross profit
margin
Glaxo Smith Kline plc Reckitt Benckiser Group plc
2017 2018 2017 2018
….....GP 19844 20580 6870 7635
…........Net sales 30186 30821 11512 12597
2
Paraphrase This Document
Need a fresh take? Get an instant paraphrase of this document with our AI Paraphraser
…....Ratio
analysis
19844/30186*100 20580/30821*100 6870/11512*100 7635/12597*100
…....Gross profit
margin
65.74% 66.77% 59.68% 60.61%
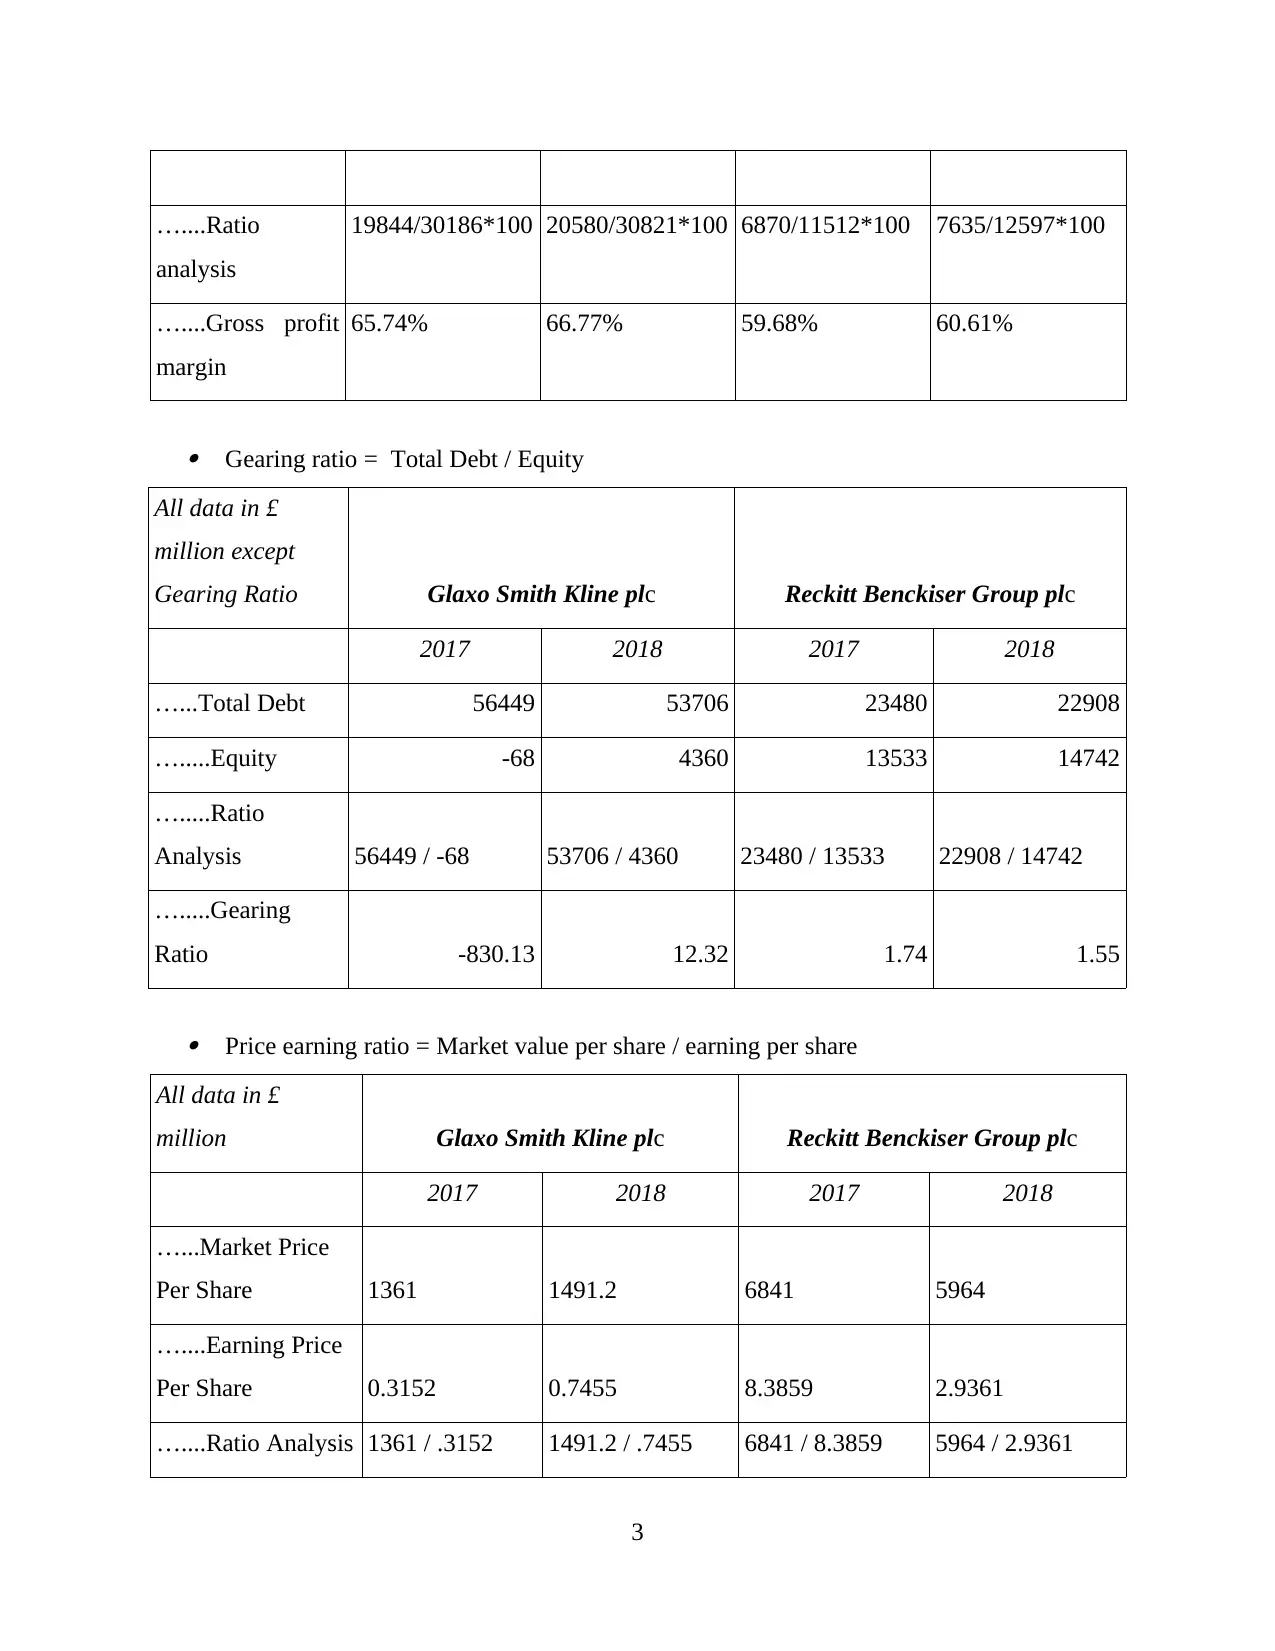
Gearing ratio = Total Debt / Equity
All data in £
million except
Gearing Ratio Glaxo Smith Kline plc Reckitt Benckiser Group plc
2017 2018 2017 2018
…...Total Debt 56449 53706 23480 22908
….....Equity -68 4360 13533 14742
….....Ratio
Analysis 56449 / -68 53706 / 4360 23480 / 13533 22908 / 14742
….....Gearing
Ratio -830.13 12.32 1.74 1.55
Price earning ratio = Market value per share / earning per share
All data in £
million Glaxo Smith Kline plc Reckitt Benckiser Group plc
2017 2018 2017 2018
…...Market Price
Per Share 1361 1491.2 6841 5964
…....Earning Price
Per Share 0.3152 0.7455 8.3859 2.9361
…....Ratio Analysis 1361 / .3152 1491.2 / .7455 6841 / 8.3859 5964 / 2.9361
3
analysis
19844/30186*100 20580/30821*100 6870/11512*100 7635/12597*100
…....Gross profit
margin
65.74% 66.77% 59.68% 60.61%
Gearing ratio = Total Debt / Equity
All data in £
million except
Gearing Ratio Glaxo Smith Kline plc Reckitt Benckiser Group plc
2017 2018 2017 2018
…...Total Debt 56449 53706 23480 22908
….....Equity -68 4360 13533 14742
….....Ratio
Analysis 56449 / -68 53706 / 4360 23480 / 13533 22908 / 14742
….....Gearing
Ratio -830.13 12.32 1.74 1.55
Price earning ratio = Market value per share / earning per share
All data in £
million Glaxo Smith Kline plc Reckitt Benckiser Group plc
2017 2018 2017 2018
…...Market Price
Per Share 1361 1491.2 6841 5964
…....Earning Price
Per Share 0.3152 0.7455 8.3859 2.9361
…....Ratio Analysis 1361 / .3152 1491.2 / .7455 6841 / 8.3859 5964 / 2.9361
3
…...Price Earning
Ratio 4317.89 2000.27 815.77 2031.26
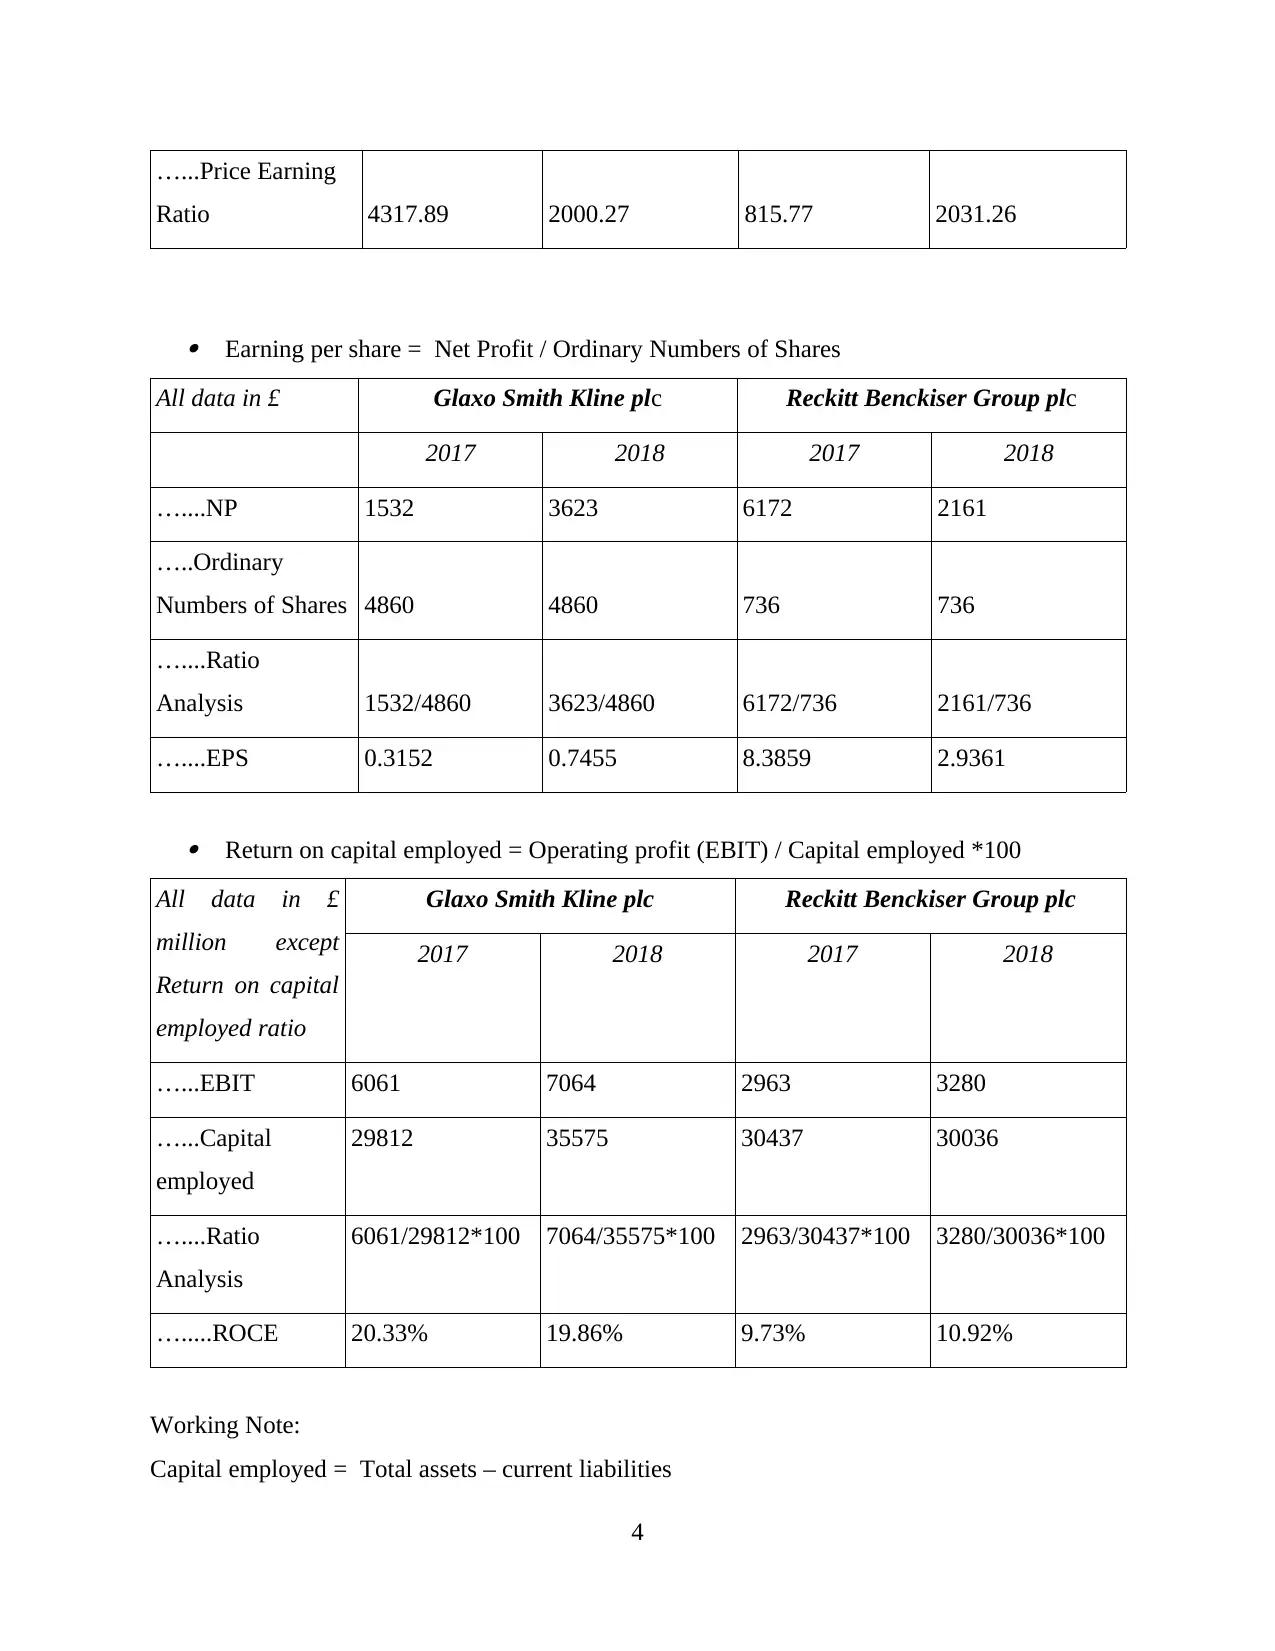
Earning per share = Net Profit / Ordinary Numbers of Shares
All data in £ Glaxo Smith Kline plc Reckitt Benckiser Group plc
2017 2018 2017 2018
…....NP 1532 3623 6172 2161
…..Ordinary
Numbers of Shares 4860 4860 736 736
…....Ratio
Analysis 1532/4860 3623/4860 6172/736 2161/736
…....EPS 0.3152 0.7455 8.3859 2.9361
Return on capital employed = Operating profit (EBIT) / Capital employed *100
All data in £
million except
Return on capital
employed ratio
Glaxo Smith Kline plc Reckitt Benckiser Group plc
2017 2018 2017 2018
…...EBIT 6061 7064 2963 3280
…...Capital
employed
29812 35575 30437 30036
…....Ratio
Analysis
6061/29812*100 7064/35575*100 2963/30437*100 3280/30036*100
….....ROCE 20.33% 19.86% 9.73% 10.92%
Working Note:
Capital employed = Total assets – current liabilities
4
Ratio 4317.89 2000.27 815.77 2031.26
Earning per share = Net Profit / Ordinary Numbers of Shares
All data in £ Glaxo Smith Kline plc Reckitt Benckiser Group plc
2017 2018 2017 2018
…....NP 1532 3623 6172 2161
…..Ordinary
Numbers of Shares 4860 4860 736 736
…....Ratio
Analysis 1532/4860 3623/4860 6172/736 2161/736
…....EPS 0.3152 0.7455 8.3859 2.9361
Return on capital employed = Operating profit (EBIT) / Capital employed *100
All data in £
million except
Return on capital
employed ratio
Glaxo Smith Kline plc Reckitt Benckiser Group plc
2017 2018 2017 2018
…...EBIT 6061 7064 2963 3280
…...Capital
employed
29812 35575 30437 30036
…....Ratio
Analysis
6061/29812*100 7064/35575*100 2963/30437*100 3280/30036*100
….....ROCE 20.33% 19.86% 9.73% 10.92%
Working Note:
Capital employed = Total assets – current liabilities
4
⊘ This is a preview!⊘
Do you want full access?
Subscribe today to unlock all pages.
Trusted by 1+ million students worldwide
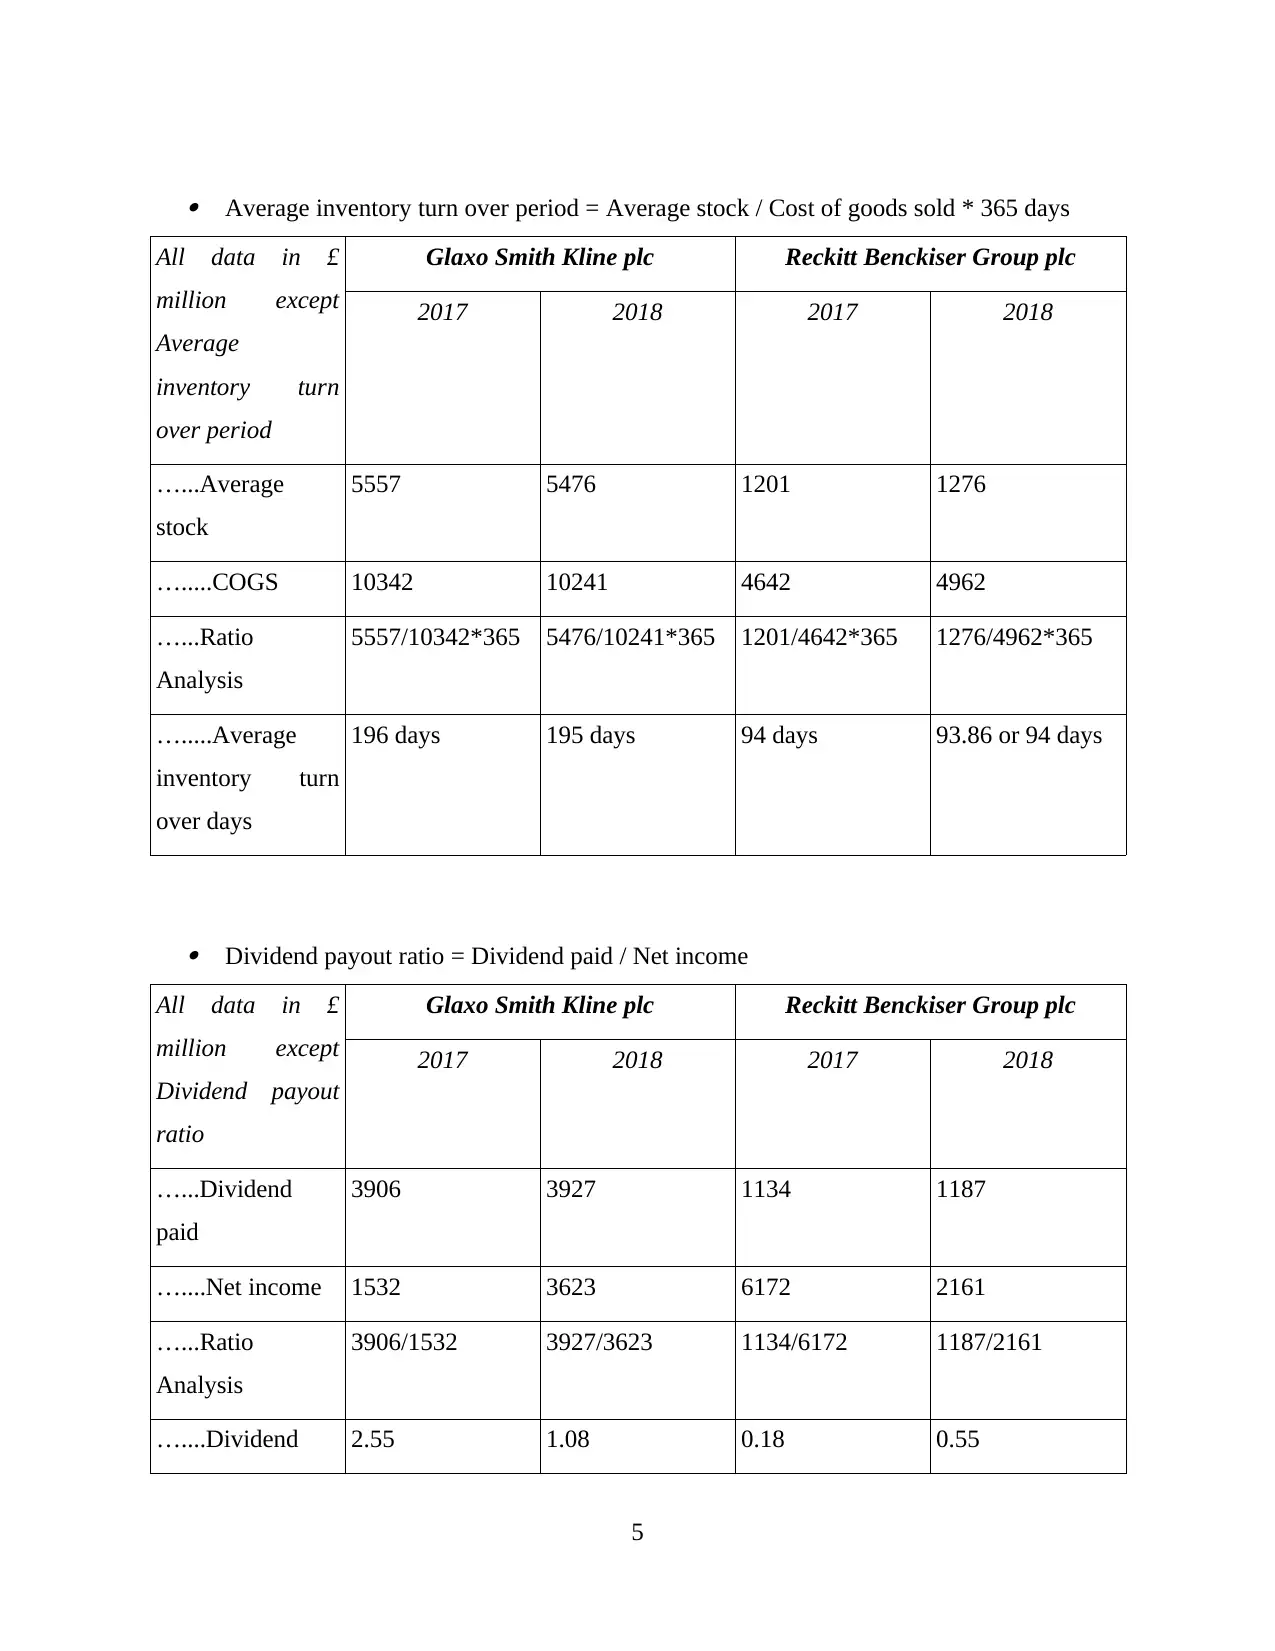
Average inventory turn over period = Average stock / Cost of goods sold * 365 days
All data in £
million except
Average
inventory turn
over period
Glaxo Smith Kline plc Reckitt Benckiser Group plc
2017 2018 2017 2018
…...Average
stock
5557 5476 1201 1276
….....COGS 10342 10241 4642 4962
…...Ratio
Analysis
5557/10342*365 5476/10241*365 1201/4642*365 1276/4962*365
….....Average
inventory turn
over days
196 days 195 days 94 days 93.86 or 94 days
Dividend payout ratio = Dividend paid / Net income
All data in £
million except
Dividend payout
ratio
Glaxo Smith Kline plc Reckitt Benckiser Group plc
2017 2018 2017 2018
…...Dividend
paid
3906 3927 1134 1187
…....Net income 1532 3623 6172 2161
…...Ratio
Analysis
3906/1532 3927/3623 1134/6172 1187/2161
…....Dividend 2.55 1.08 0.18 0.55
5
All data in £
million except
Average
inventory turn
over period
Glaxo Smith Kline plc Reckitt Benckiser Group plc
2017 2018 2017 2018
…...Average
stock
5557 5476 1201 1276
….....COGS 10342 10241 4642 4962
…...Ratio
Analysis
5557/10342*365 5476/10241*365 1201/4642*365 1276/4962*365
….....Average
inventory turn
over days
196 days 195 days 94 days 93.86 or 94 days
Dividend payout ratio = Dividend paid / Net income
All data in £
million except
Dividend payout
ratio
Glaxo Smith Kline plc Reckitt Benckiser Group plc
2017 2018 2017 2018
…...Dividend
paid
3906 3927 1134 1187
…....Net income 1532 3623 6172 2161
…...Ratio
Analysis
3906/1532 3927/3623 1134/6172 1187/2161
…....Dividend 2.55 1.08 0.18 0.55
5
Paraphrase This Document
Need a fresh take? Get an instant paraphrase of this document with our AI Paraphraser
payout ratio
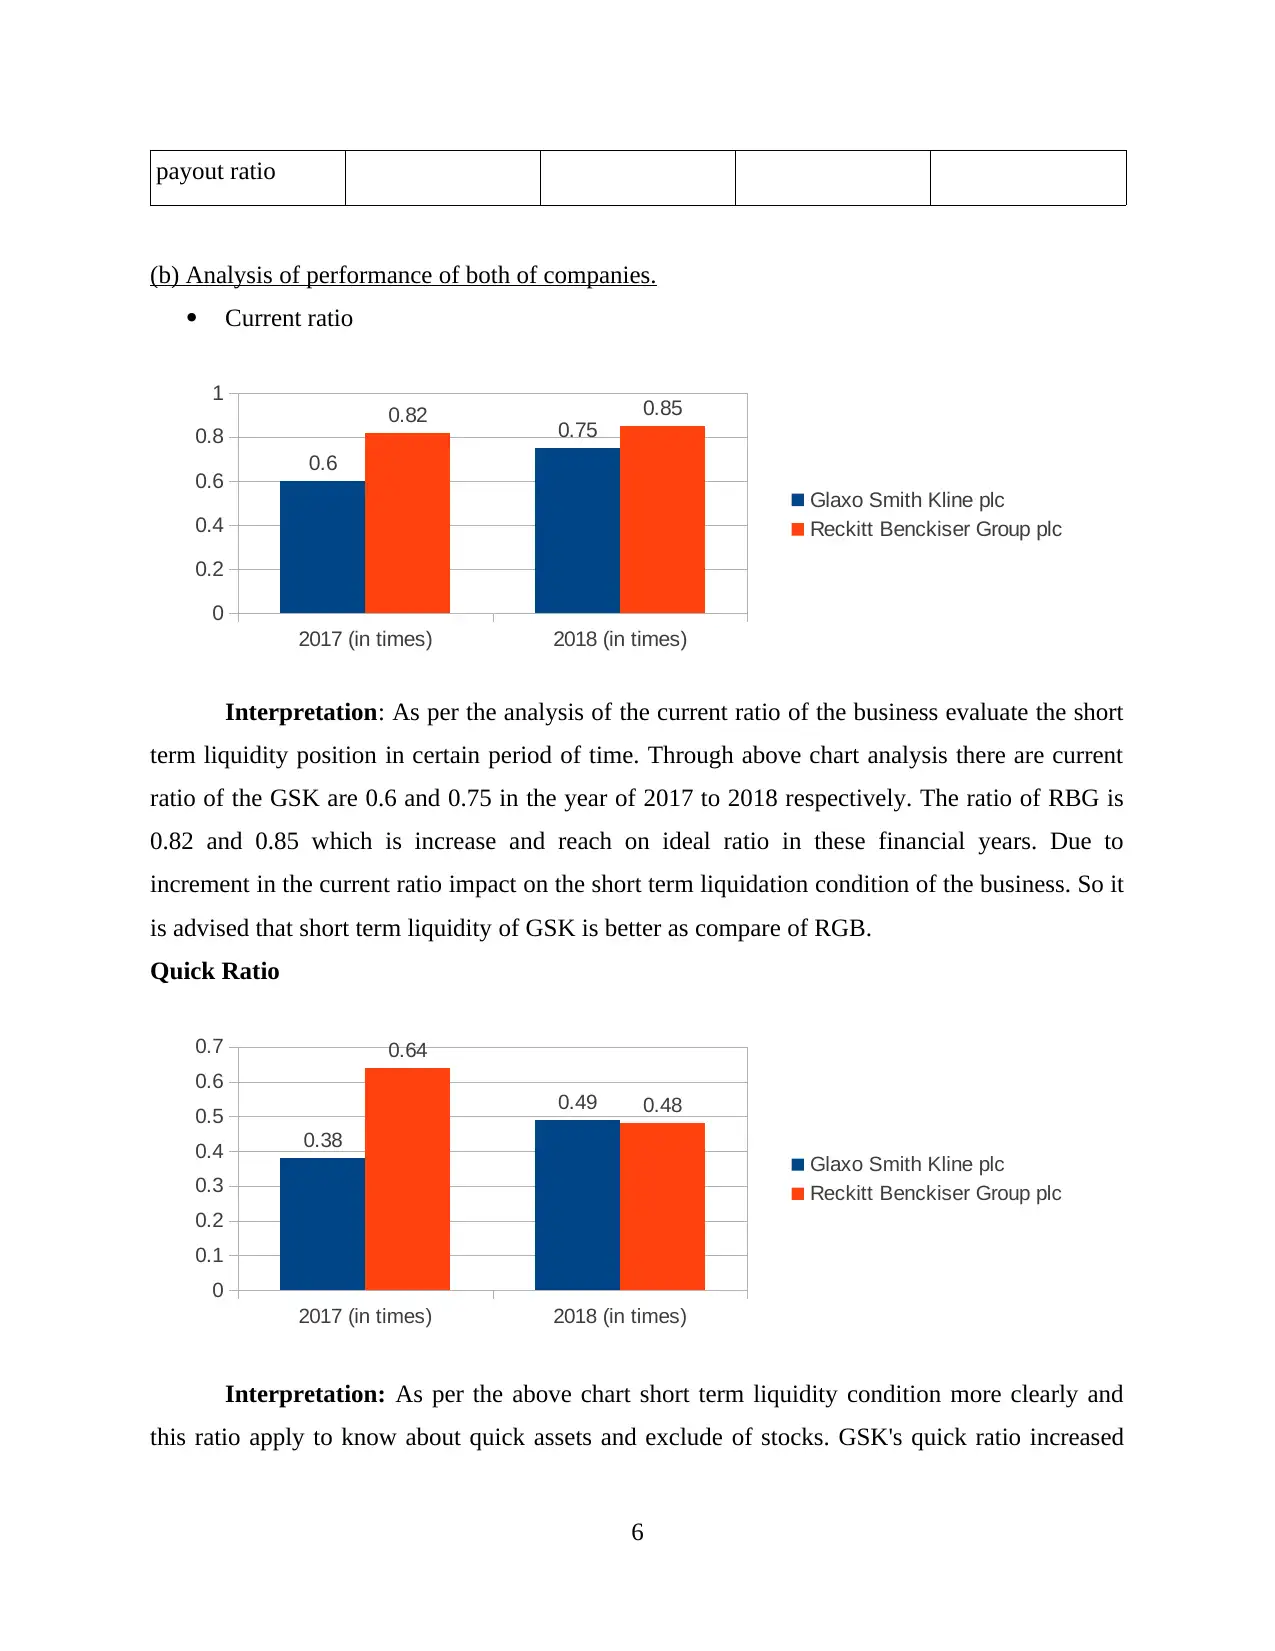
(b) Analysis of performance of both of companies.
Current ratio
2017 (in times) 2018 (in times)
0
0.2
0.4
0.6
0.8
1
0.6
0.75
0.82 0.85
Glaxo Smith Kline plc
Reckitt Benckiser Group plc
Interpretation: As per the analysis of the current ratio of the business evaluate the short
term liquidity position in certain period of time. Through above chart analysis there are current
ratio of the GSK are 0.6 and 0.75 in the year of 2017 to 2018 respectively. The ratio of RBG is
0.82 and 0.85 which is increase and reach on ideal ratio in these financial years. Due to
increment in the current ratio impact on the short term liquidation condition of the business. So it
is advised that short term liquidity of GSK is better as compare of RGB.
Quick Ratio
2017 (in times) 2018 (in times)
0
0.1
0.2
0.3
0.4
0.5
0.6
0.7
0.38
0.49
0.64
0.48
Glaxo Smith Kline plc
Reckitt Benckiser Group plc
Interpretation: As per the above chart short term liquidity condition more clearly and
this ratio apply to know about quick assets and exclude of stocks. GSK's quick ratio increased
6
from 0.38 to 0.49 in the year of 2017 to 2018. Due to RBG's quick ratio has been reduced in
2017 to 2018 which is 0.64 to 0.48 in particular period of time.
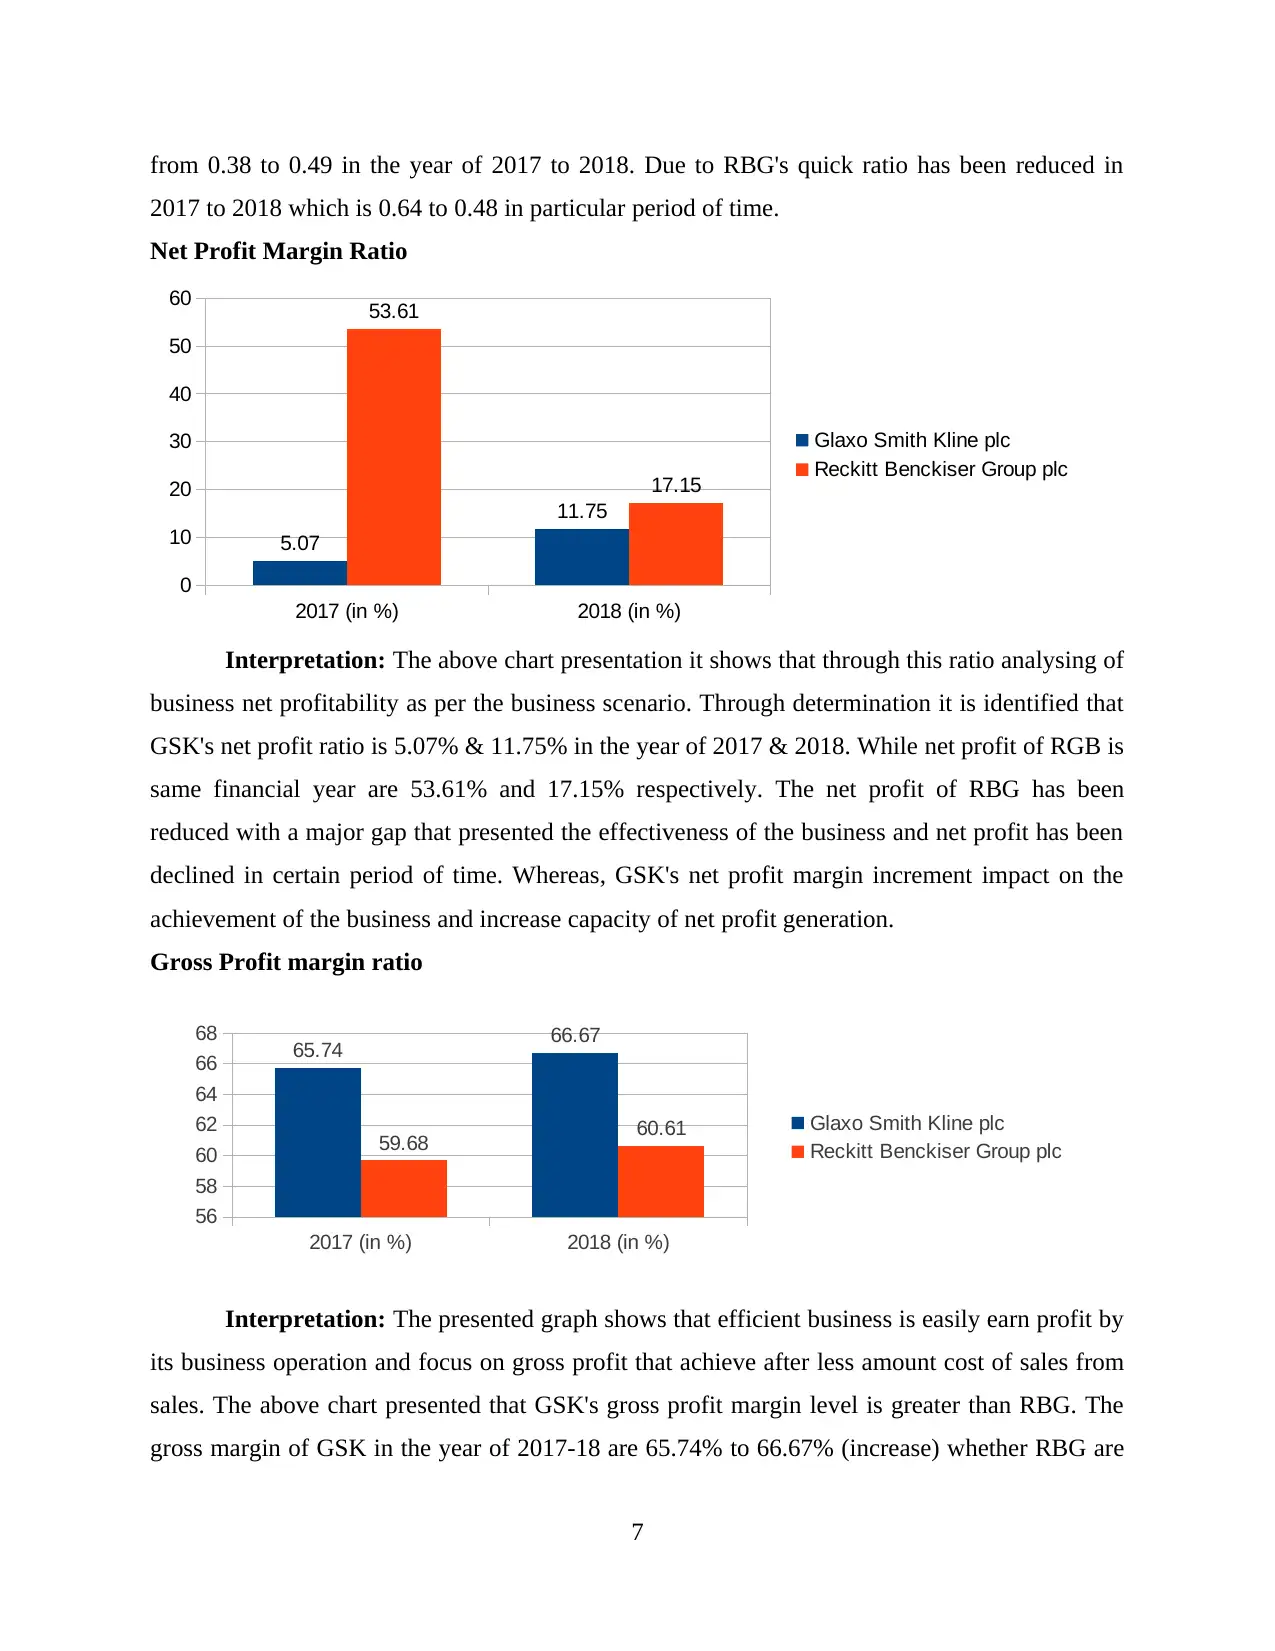
Net Profit Margin Ratio
2017 (in %) 2018 (in %)
0
10
20
30
40
50
60
5.07
11.75
53.61
17.15
Glaxo Smith Kline plc
Reckitt Benckiser Group plc
Interpretation: The above chart presentation it shows that through this ratio analysing of
business net profitability as per the business scenario. Through determination it is identified that
GSK's net profit ratio is 5.07% & 11.75% in the year of 2017 & 2018. While net profit of RGB is
same financial year are 53.61% and 17.15% respectively. The net profit of RBG has been
reduced with a major gap that presented the effectiveness of the business and net profit has been
declined in certain period of time. Whereas, GSK's net profit margin increment impact on the
achievement of the business and increase capacity of net profit generation.
Gross Profit margin ratio
2017 (in %) 2018 (in %)
56
58
60
62
64
66
68 65.74 66.67
59.68 60.61 Glaxo Smith Kline plc
Reckitt Benckiser Group plc
Interpretation: The presented graph shows that efficient business is easily earn profit by
its business operation and focus on gross profit that achieve after less amount cost of sales from
sales. The above chart presented that GSK's gross profit margin level is greater than RBG. The
gross margin of GSK in the year of 2017-18 are 65.74% to 66.67% (increase) whether RBG are
7
2017 to 2018 which is 0.64 to 0.48 in particular period of time.
Net Profit Margin Ratio
2017 (in %) 2018 (in %)
0
10
20
30
40
50
60
5.07
11.75
53.61
17.15
Glaxo Smith Kline plc
Reckitt Benckiser Group plc
Interpretation: The above chart presentation it shows that through this ratio analysing of
business net profitability as per the business scenario. Through determination it is identified that
GSK's net profit ratio is 5.07% & 11.75% in the year of 2017 & 2018. While net profit of RGB is
same financial year are 53.61% and 17.15% respectively. The net profit of RBG has been
reduced with a major gap that presented the effectiveness of the business and net profit has been
declined in certain period of time. Whereas, GSK's net profit margin increment impact on the
achievement of the business and increase capacity of net profit generation.
Gross Profit margin ratio
2017 (in %) 2018 (in %)
56
58
60
62
64
66
68 65.74 66.67
59.68 60.61 Glaxo Smith Kline plc
Reckitt Benckiser Group plc
Interpretation: The presented graph shows that efficient business is easily earn profit by
its business operation and focus on gross profit that achieve after less amount cost of sales from
sales. The above chart presented that GSK's gross profit margin level is greater than RBG. The
gross margin of GSK in the year of 2017-18 are 65.74% to 66.67% (increase) whether RBG are
7
⊘ This is a preview!⊘
Do you want full access?
Subscribe today to unlock all pages.
Trusted by 1+ million students worldwide
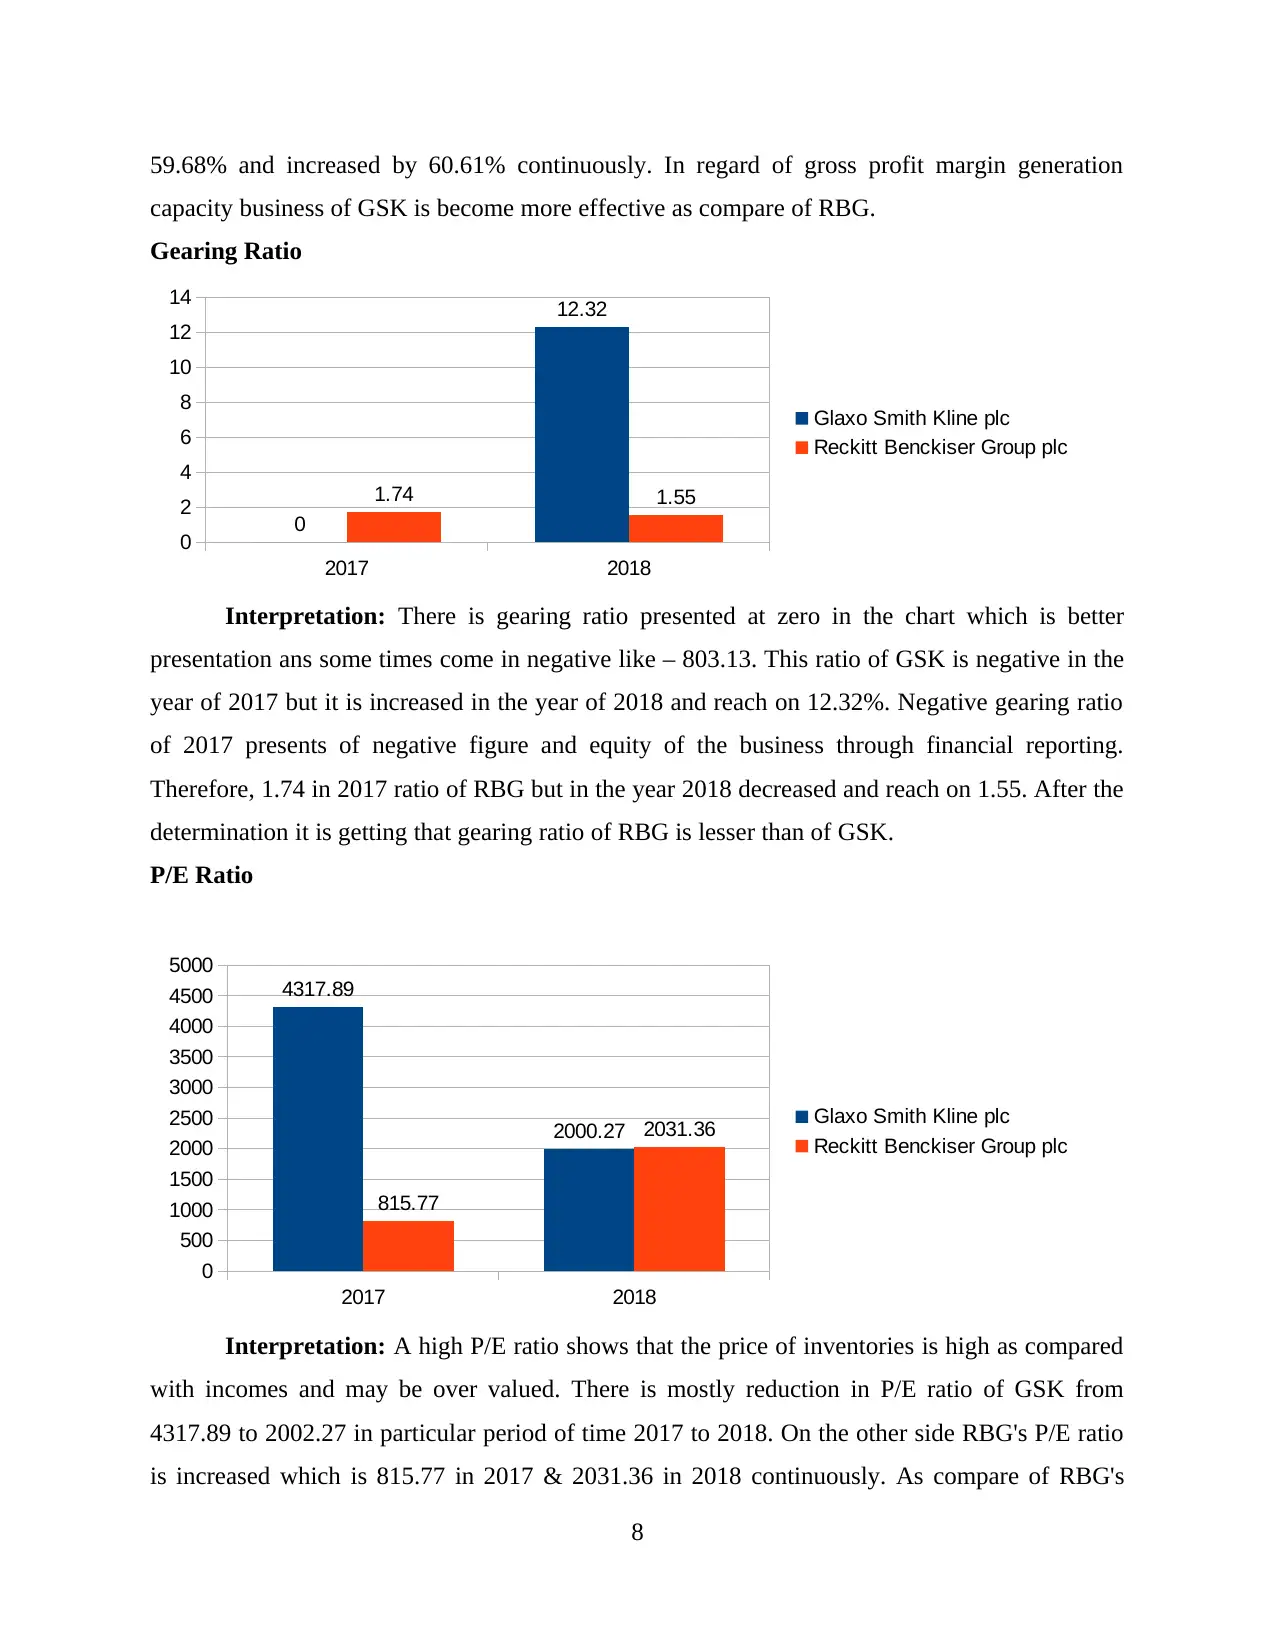
59.68% and increased by 60.61% continuously. In regard of gross profit margin generation
capacity business of GSK is become more effective as compare of RBG.
Gearing Ratio
2017 2018
0
2
4
6
8
10
12
14
0
12.32
1.74 1.55
Glaxo Smith Kline plc
Reckitt Benckiser Group plc
Interpretation: There is gearing ratio presented at zero in the chart which is better
presentation ans some times come in negative like – 803.13. This ratio of GSK is negative in the
year of 2017 but it is increased in the year of 2018 and reach on 12.32%. Negative gearing ratio
of 2017 presents of negative figure and equity of the business through financial reporting.
Therefore, 1.74 in 2017 ratio of RBG but in the year 2018 decreased and reach on 1.55. After the
determination it is getting that gearing ratio of RBG is lesser than of GSK.
P/E Ratio
2017 2018
0
500
1000
1500
2000
2500
3000
3500
4000
4500
5000
4317.89
2000.27
815.77
2031.36 Glaxo Smith Kline plc
Reckitt Benckiser Group plc
Interpretation: A high P/E ratio shows that the price of inventories is high as compared
with incomes and may be over valued. There is mostly reduction in P/E ratio of GSK from
4317.89 to 2002.27 in particular period of time 2017 to 2018. On the other side RBG's P/E ratio
is increased which is 815.77 in 2017 & 2031.36 in 2018 continuously. As compare of RBG's
8
Paraphrase This Document
Need a fresh take? Get an instant paraphrase of this document with our AI Paraphraser
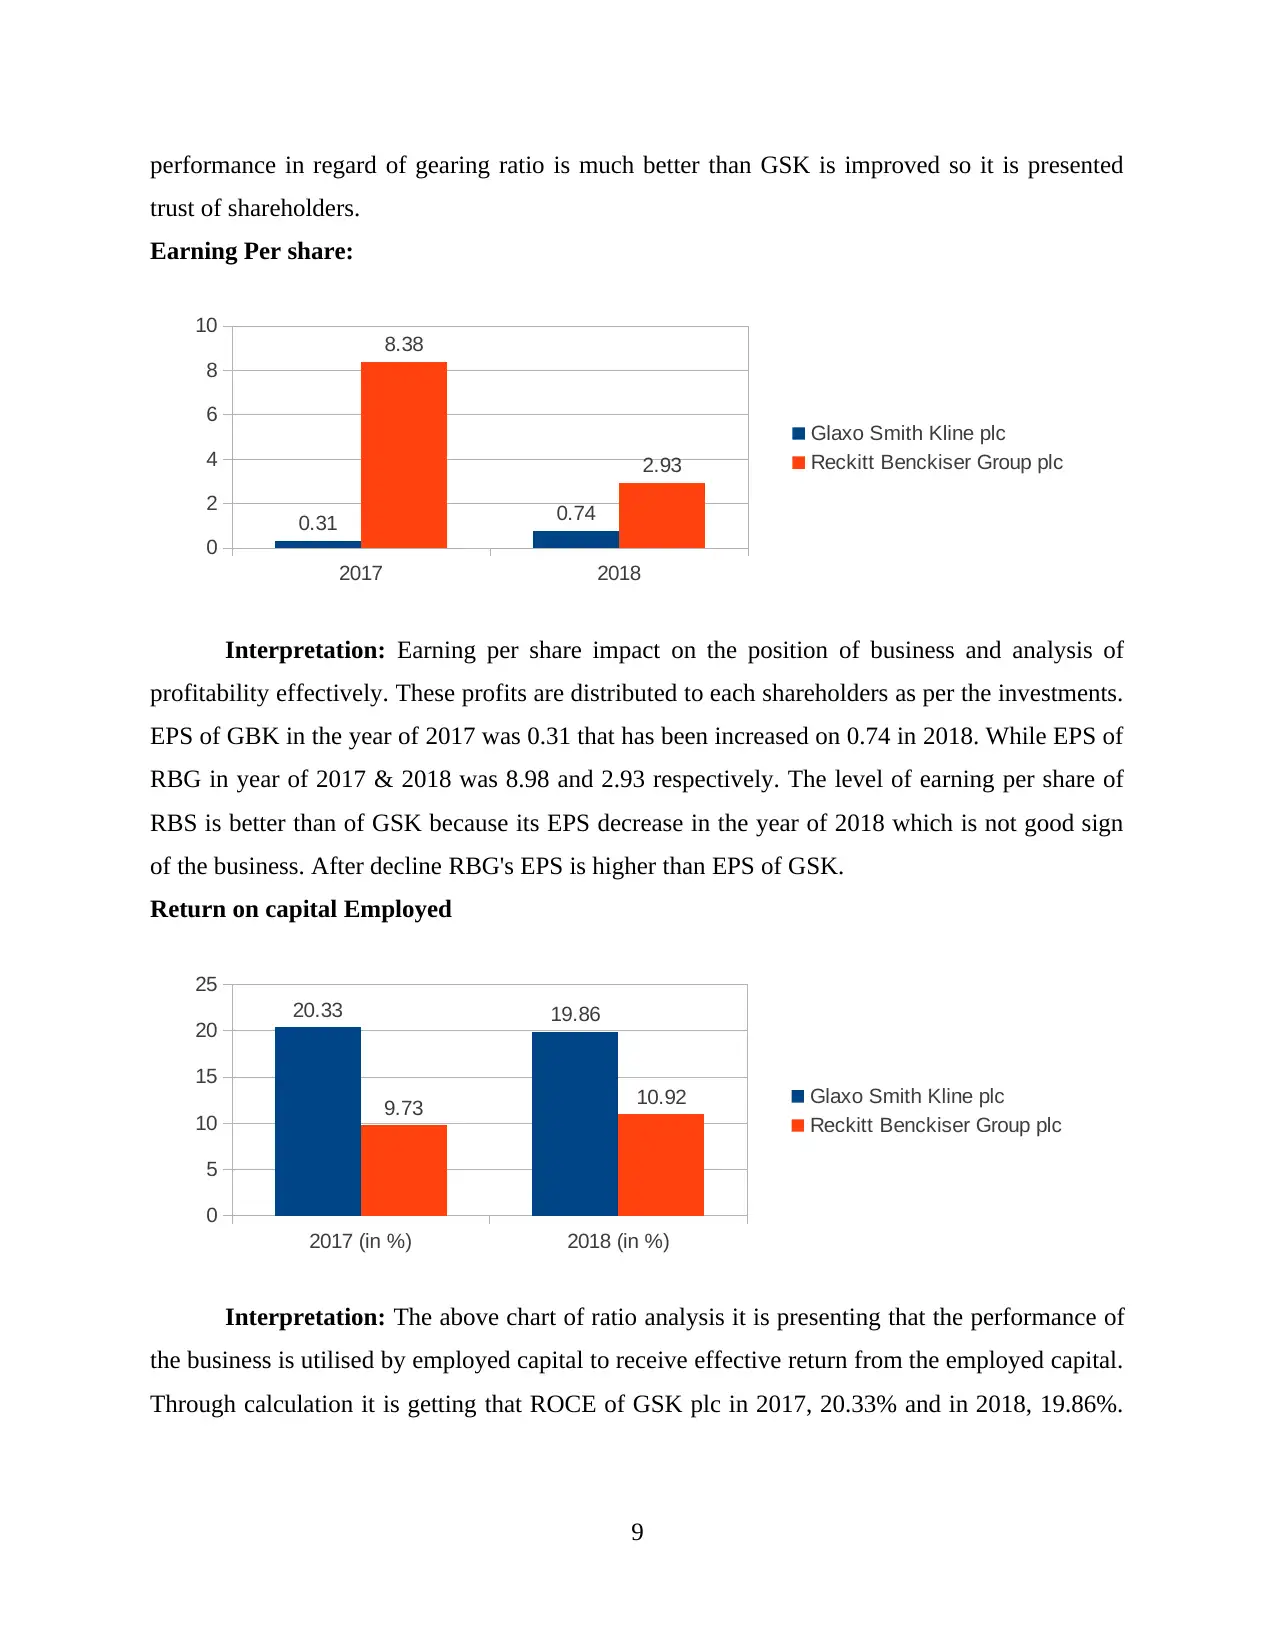
performance in regard of gearing ratio is much better than GSK is improved so it is presented
trust of shareholders.
Earning Per share:
2017 2018
0
2
4
6
8
10
0.31 0.74
8.38
2.93
Glaxo Smith Kline plc
Reckitt Benckiser Group plc
Interpretation: Earning per share impact on the position of business and analysis of
profitability effectively. These profits are distributed to each shareholders as per the investments.
EPS of GBK in the year of 2017 was 0.31 that has been increased on 0.74 in 2018. While EPS of
RBG in year of 2017 & 2018 was 8.98 and 2.93 respectively. The level of earning per share of
RBS is better than of GSK because its EPS decrease in the year of 2018 which is not good sign
of the business. After decline RBG's EPS is higher than EPS of GSK.
Return on capital Employed
2017 (in %) 2018 (in %)
0
5
10
15
20
25
20.33 19.86
9.73 10.92 Glaxo Smith Kline plc
Reckitt Benckiser Group plc
Interpretation: The above chart of ratio analysis it is presenting that the performance of
the business is utilised by employed capital to receive effective return from the employed capital.
Through calculation it is getting that ROCE of GSK plc in 2017, 20.33% and in 2018, 19.86%.
9
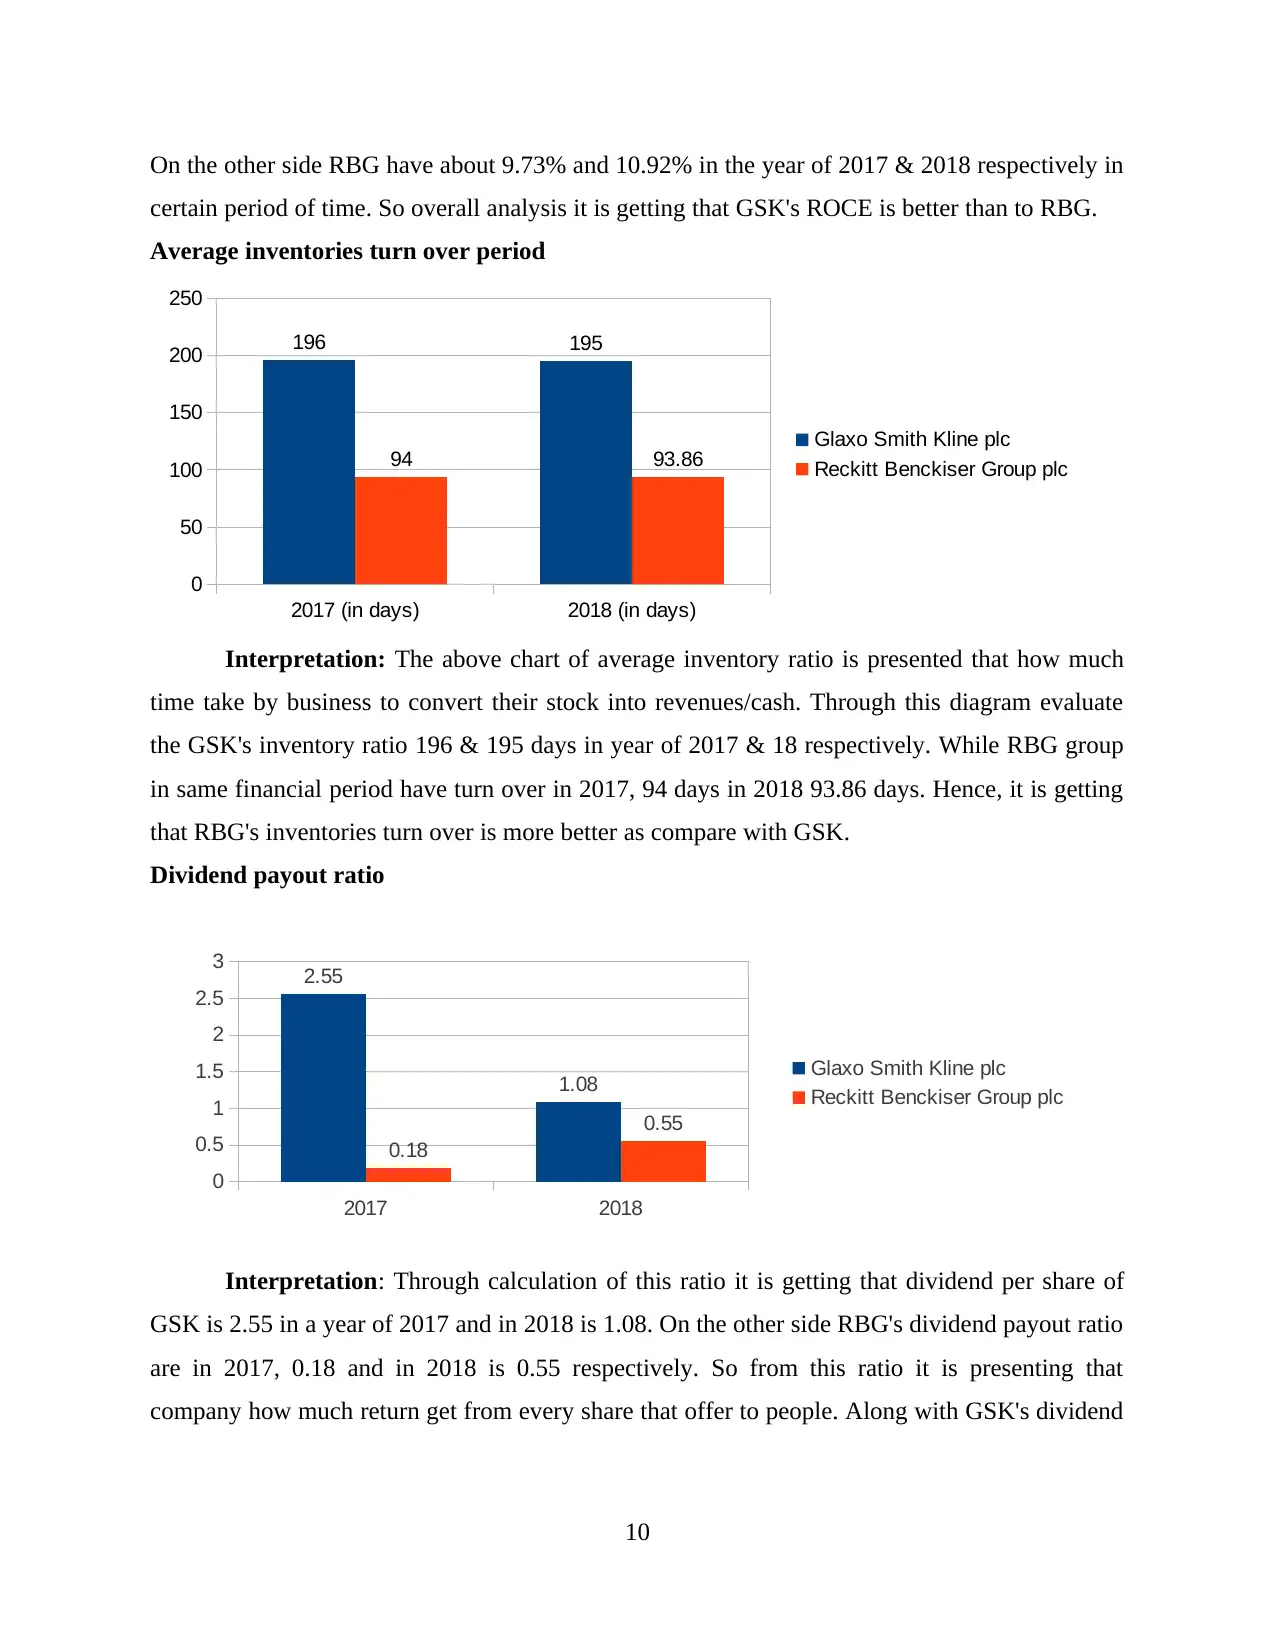
On the other side RBG have about 9.73% and 10.92% in the year of 2017 & 2018 respectively in
certain period of time. So overall analysis it is getting that GSK's ROCE is better than to RBG.
Average inventories turn over period
2017 (in days) 2018 (in days)
0
50
100
150
200
250
196 195
94 93.86 Glaxo Smith Kline plc
Reckitt Benckiser Group plc
Interpretation: The above chart of average inventory ratio is presented that how much
time take by business to convert their stock into revenues/cash. Through this diagram evaluate
the GSK's inventory ratio 196 & 195 days in year of 2017 & 18 respectively. While RBG group
in same financial period have turn over in 2017, 94 days in 2018 93.86 days. Hence, it is getting
that RBG's inventories turn over is more better as compare with GSK.
Dividend payout ratio
2017 2018
0
0.5
1
1.5
2
2.5
3 2.55
1.08
0.18
0.55
Glaxo Smith Kline plc
Reckitt Benckiser Group plc
Interpretation: Through calculation of this ratio it is getting that dividend per share of
GSK is 2.55 in a year of 2017 and in 2018 is 1.08. On the other side RBG's dividend payout ratio
are in 2017, 0.18 and in 2018 is 0.55 respectively. So from this ratio it is presenting that
company how much return get from every share that offer to people. Along with GSK's dividend
10
⊘ This is a preview!⊘
Do you want full access?
Subscribe today to unlock all pages.
Trusted by 1+ million students worldwide
1 out of 21
Related Documents


Your All-in-One AI-Powered Toolkit for Academic Success.
+13062052269
info@desklib.com
Available 24*7 on WhatsApp / Email
![[object Object]](/_next/static/media/star-bottom.7253800d.svg)
Unlock your academic potential
Copyright © 2020–2026 A2Z Services. All Rights Reserved. Developed and managed by ZUCOL.