Managerial Finance: Performance Analysis and Investment Potential
Added on 2023-01-17
17 Pages4009 Words20 Views
Managerial Finance

Table of Contents
INTRODUCTION...........................................................................................................................1
PORTFOLIO 1.................................................................................................................................1
a. Calculation of 10 different financial ratios..............................................................................1
b. Analysis of the performance, financial position and investment potential..............................4
c. Recommendation of the way in which financial performance of the poorly performing
business can be improved............................................................................................................9
d. Discussion of the limitation of relaying on financial ratios to interpret a company's
performance...............................................................................................................................10
PORTFOLIO 2...............................................................................................................................10
a. Use of appropriate investment appraisal techniques and advise to senior management on
whether project a or b should be selected..................................................................................10
b. Discussion of limitation of using investment appraisal technique to help in long term
decision making.........................................................................................................................13
CONCLUSION..............................................................................................................................13
REFERENCES..............................................................................................................................15
INTRODUCTION
Managerial finance can be defined as an approach which is used for the purpose of
managing monetary resources which are used by an organisation for the purpose of executing
business in systematic manner. With the help of it complexities in the process of allocation of
finance could be reduced as it guides to assure that funds are allocated properly to all the
operations according to their requirements (Ahmed and Malik, 2015). Present report is based
upon comparison of two different companies which are Reckitt Benckiser Group Plc and Glaxo
Smith Kline Plc. Both the enterprises are mainly established in United Kingdom. First one is
having headquarter in England and another one is having in London. This assignment cover
various topics such as calculation of financial ratios, analysis of performance, recommendations
and limitation of relaying upon financial ratios for interpreting position of a company in the
market. Additionally, advice is also provided to the senior manager to opt option A or B with the
help of investment appraisal techniques along with limitations of relaying upon them are also
covered in this report.
PORTFOLIO 1
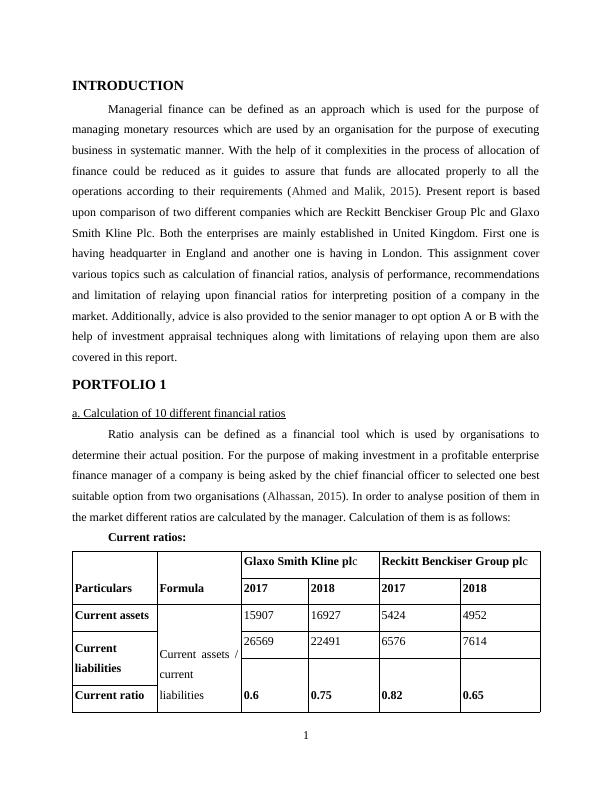
a. Calculation of 10 different financial ratios
Ratio analysis can be defined as a financial tool which is used by organisations to
determine their actual position. For the purpose of making investment in a profitable enterprise
finance manager of a company is being asked by the chief financial officer to selected one best
suitable option from two organisations (Alhassan, 2015). In order to analyse position of them in
the market different ratios are calculated by the manager. Calculation of them is as follows:
Current ratios:
Particulars Formula
Glaxo Smith Kline plc Reckitt Benckiser Group plc
2017 2018 2017 2018
Current assets
Current assets /
current
liabilities
15907 16927 5424 4952
Current
liabilities
26569 22491 6576 7614
0.6 0.75 0.82 0.65Current ratio
1
Managerial finance can be defined as an approach which is used for the purpose of
managing monetary resources which are used by an organisation for the purpose of executing
business in systematic manner. With the help of it complexities in the process of allocation of
finance could be reduced as it guides to assure that funds are allocated properly to all the
operations according to their requirements (Ahmed and Malik, 2015). Present report is based
upon comparison of two different companies which are Reckitt Benckiser Group Plc and Glaxo
Smith Kline Plc. Both the enterprises are mainly established in United Kingdom. First one is
having headquarter in England and another one is having in London. This assignment cover
various topics such as calculation of financial ratios, analysis of performance, recommendations
and limitation of relaying upon financial ratios for interpreting position of a company in the
market. Additionally, advice is also provided to the senior manager to opt option A or B with the
help of investment appraisal techniques along with limitations of relaying upon them are also
covered in this report.
PORTFOLIO 1
a. Calculation of 10 different financial ratios
Ratio analysis can be defined as a financial tool which is used by organisations to
determine their actual position. For the purpose of making investment in a profitable enterprise
finance manager of a company is being asked by the chief financial officer to selected one best
suitable option from two organisations (Alhassan, 2015). In order to analyse position of them in
the market different ratios are calculated by the manager. Calculation of them is as follows:
Current ratios:
Particulars Formula
Glaxo Smith Kline plc Reckitt Benckiser Group plc
2017 2018 2017 2018
Current assets
Current assets /
current
liabilities
15907 16927 5424 4952
Current
liabilities
26569 22491 6576 7614
0.6 0.75 0.82 0.65Current ratio
1
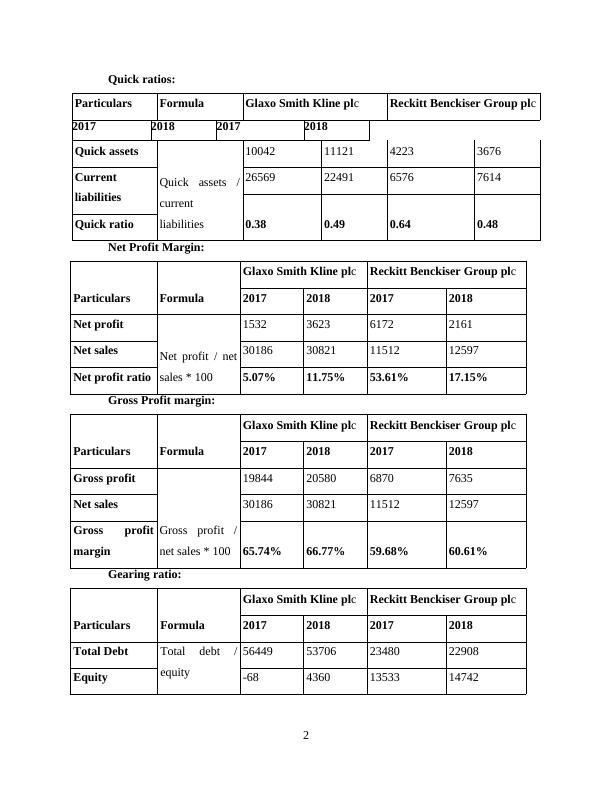
Quick ratios:
Particulars Formula Glaxo Smith Kline plc Reckitt Benckiser Group plc
2017 2018 2017 2018
Quick assets
Quick assets /
current
liabilities
10042 11121 4223 3676
Current
liabilities
26569 22491 6576 7614
0.38 0.49 0.64 0.48Quick ratio
Net Profit Margin:
Particulars Formula
Glaxo Smith Kline plc Reckitt Benckiser Group plc
2017 2018 2017 2018
Net profit
Net profit / net
sales * 100
1532 3623 6172 2161
Net sales 30186 30821 11512 12597
Net profit ratio 5.07% 11.75% 53.61% 17.15%
Gross Profit margin:
Particulars Formula
Glaxo Smith Kline plc Reckitt Benckiser Group plc
2017 2018 2017 2018
Gross profit
Gross profit /
net sales * 100
19844 20580 6870 7635
Net sales 30186 30821 11512 12597
Gross profit
margin 65.74% 66.77% 59.68% 60.61%
Gearing ratio:
Particulars Formula
Glaxo Smith Kline plc Reckitt Benckiser Group plc
2017 2018 2017 2018
Total Debt Total debt /
equity
56449 53706 23480 22908
Equity -68 4360 13533 14742
2
End of preview
Want to access all the pages? Upload your documents or become a member.
Related Documents
Managerial Finance: Performance Analysis of Glaxo Smith Kline plc and Reckitt Benckiser Group plclg...
|20
|4050
|97
Comparison of Financial Position of Glaxo Smith Kline plc and Reckitt Benckiser Group plclg...
|22
|4026
|36
Managerial Finance: Financial Ratios and Investment Appraisal Methodslg...
|20
|3987
|64
Managerial Finance: Financial Ratios and Performance Analysislg...
|21
|4250
|1
Financial Marketinglg...
|24
|3883
|42
Managerial Finance: Ratio Analysis, Performance Assessment, and Recommendationslg...
|17
|3445
|22