Practical Data Analysis for Business: BAME Employment Report

Verified

Added on  2022/12/22

|18
|2589
|76
Report
AI Summary
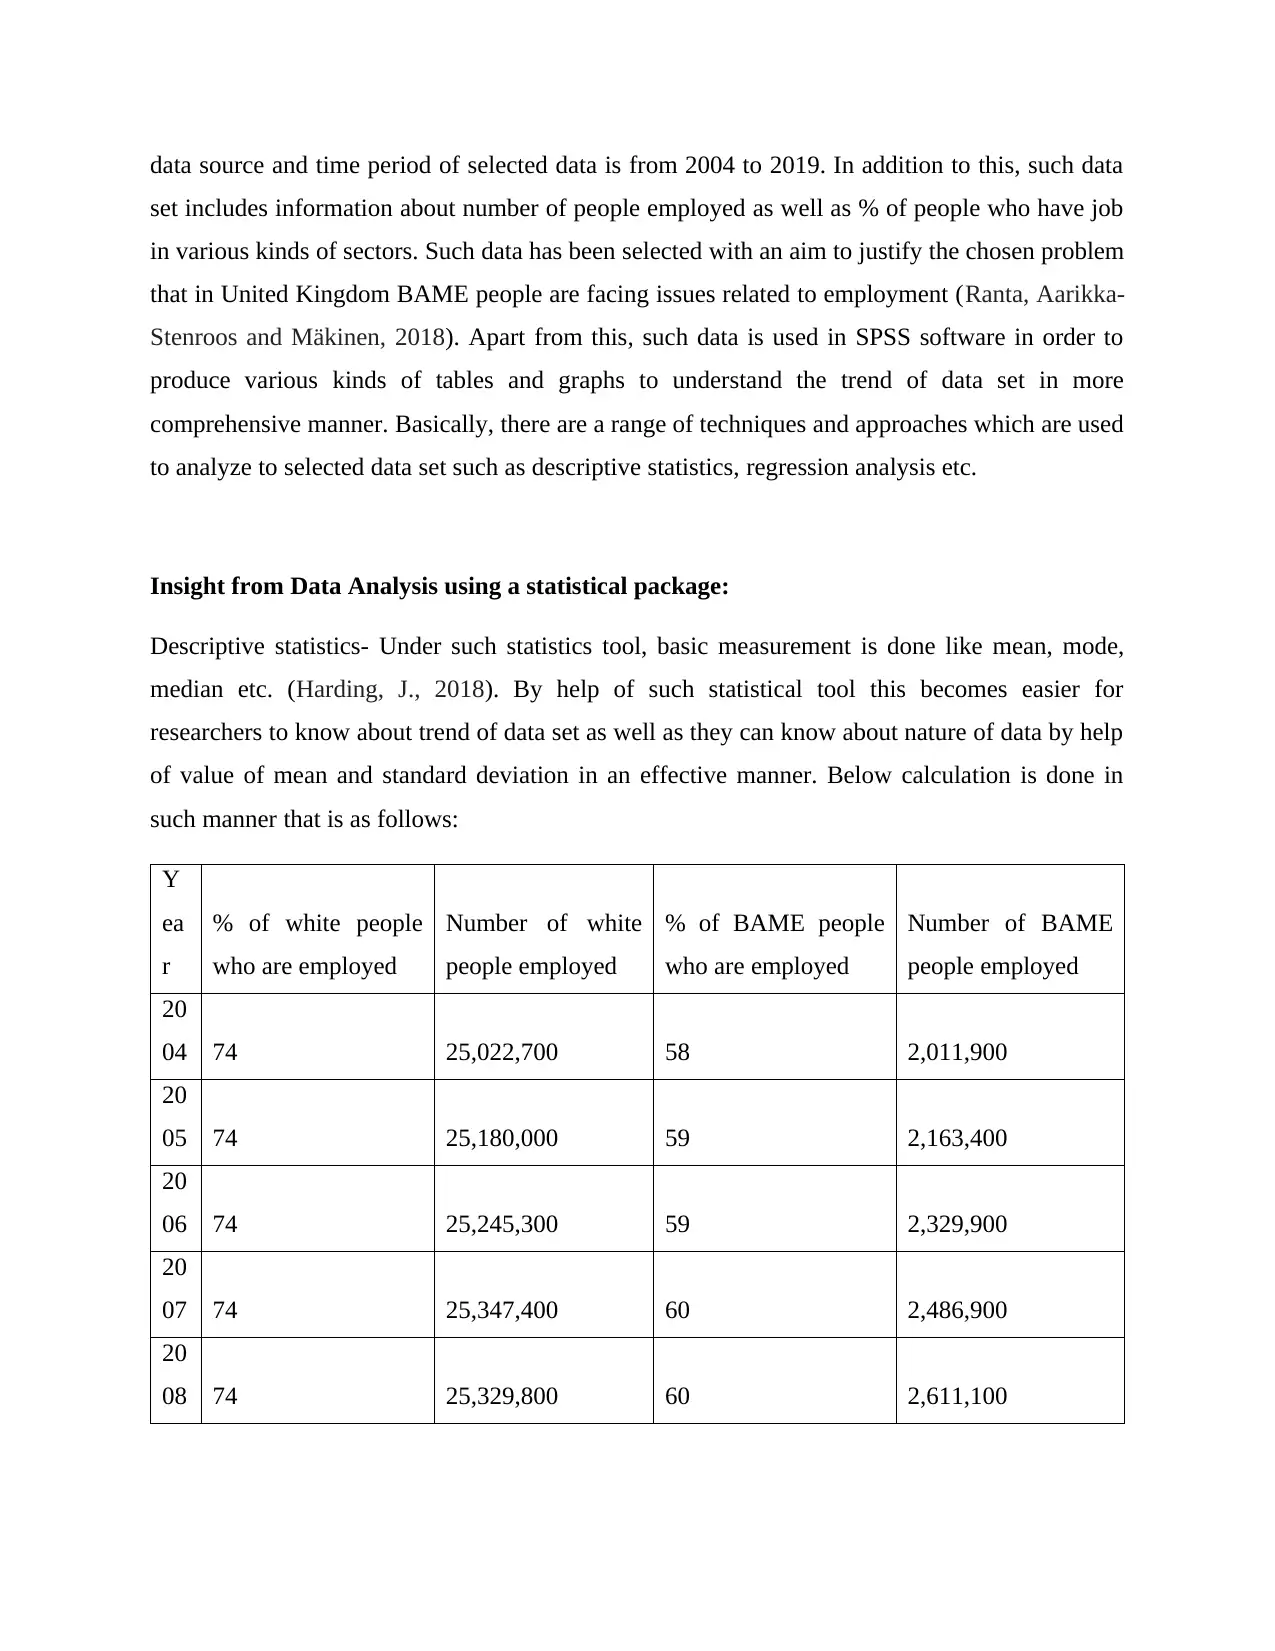
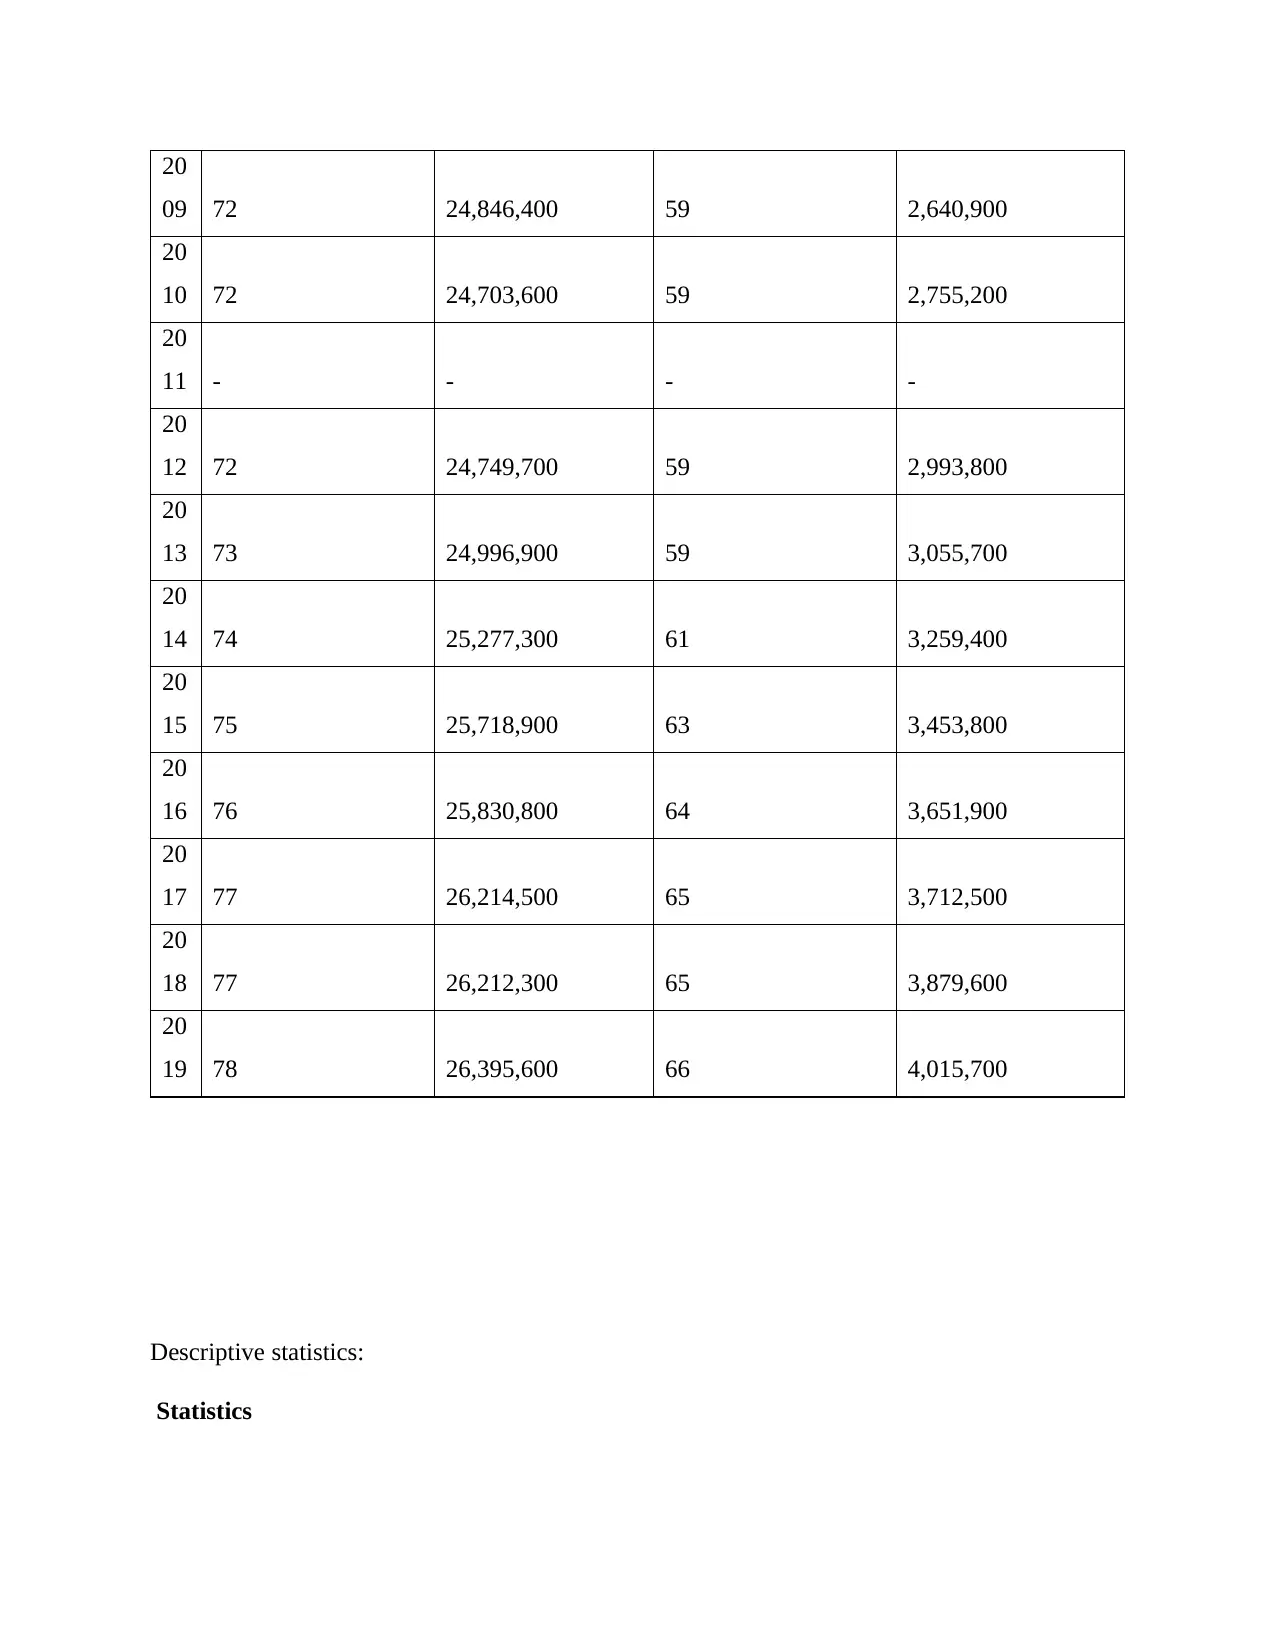
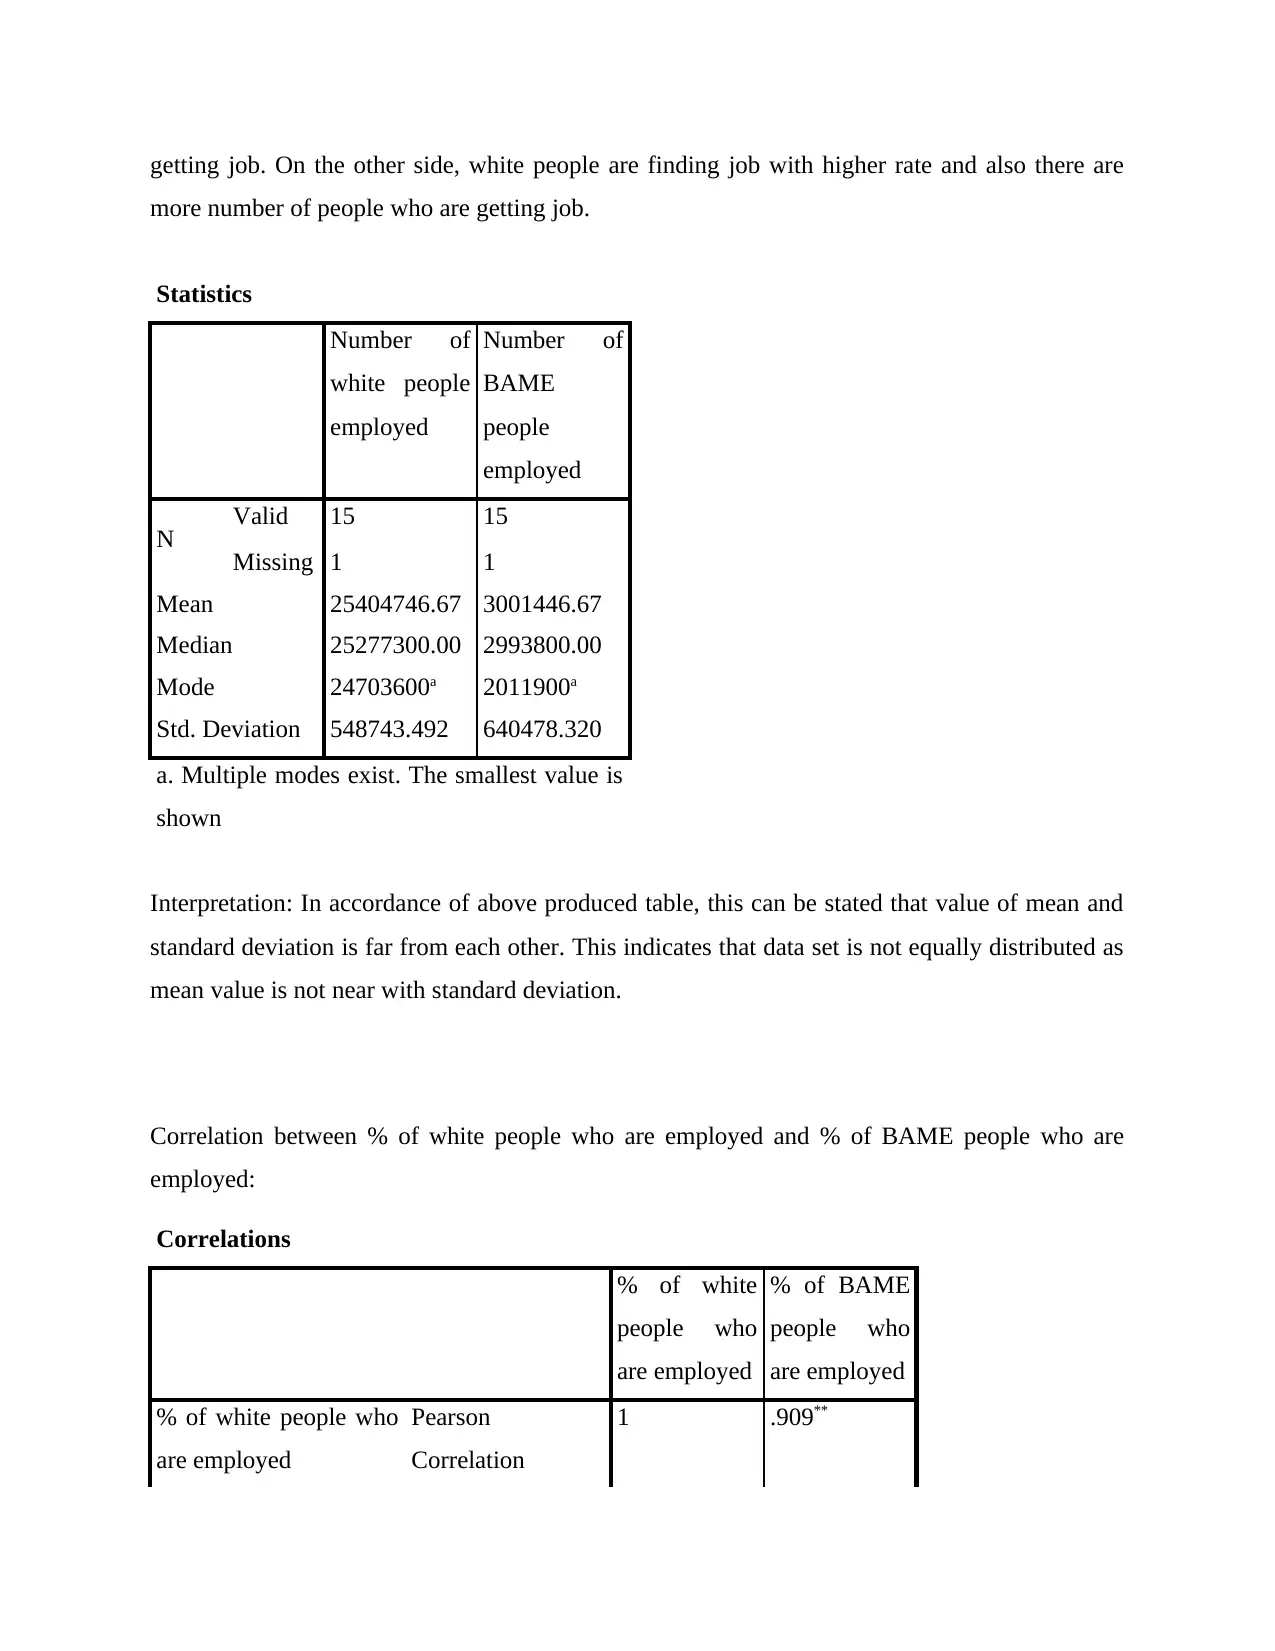
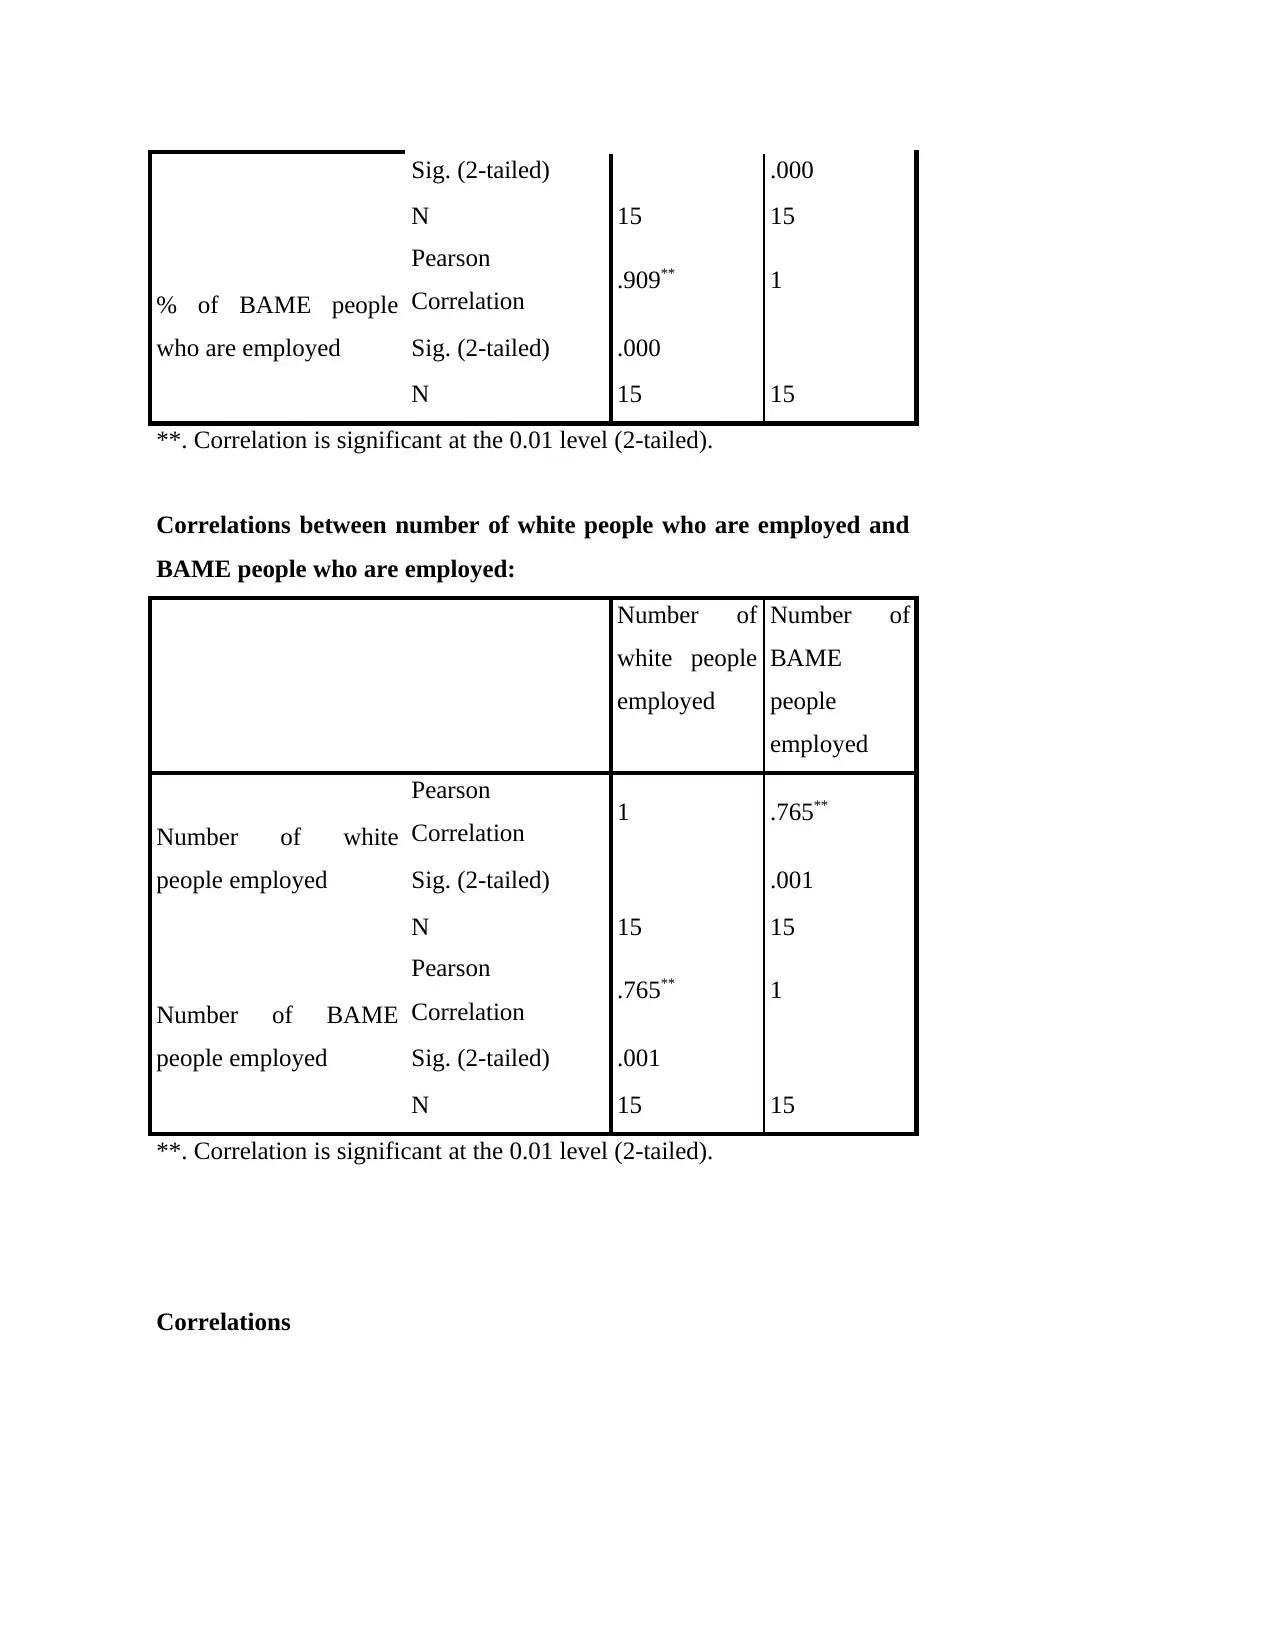
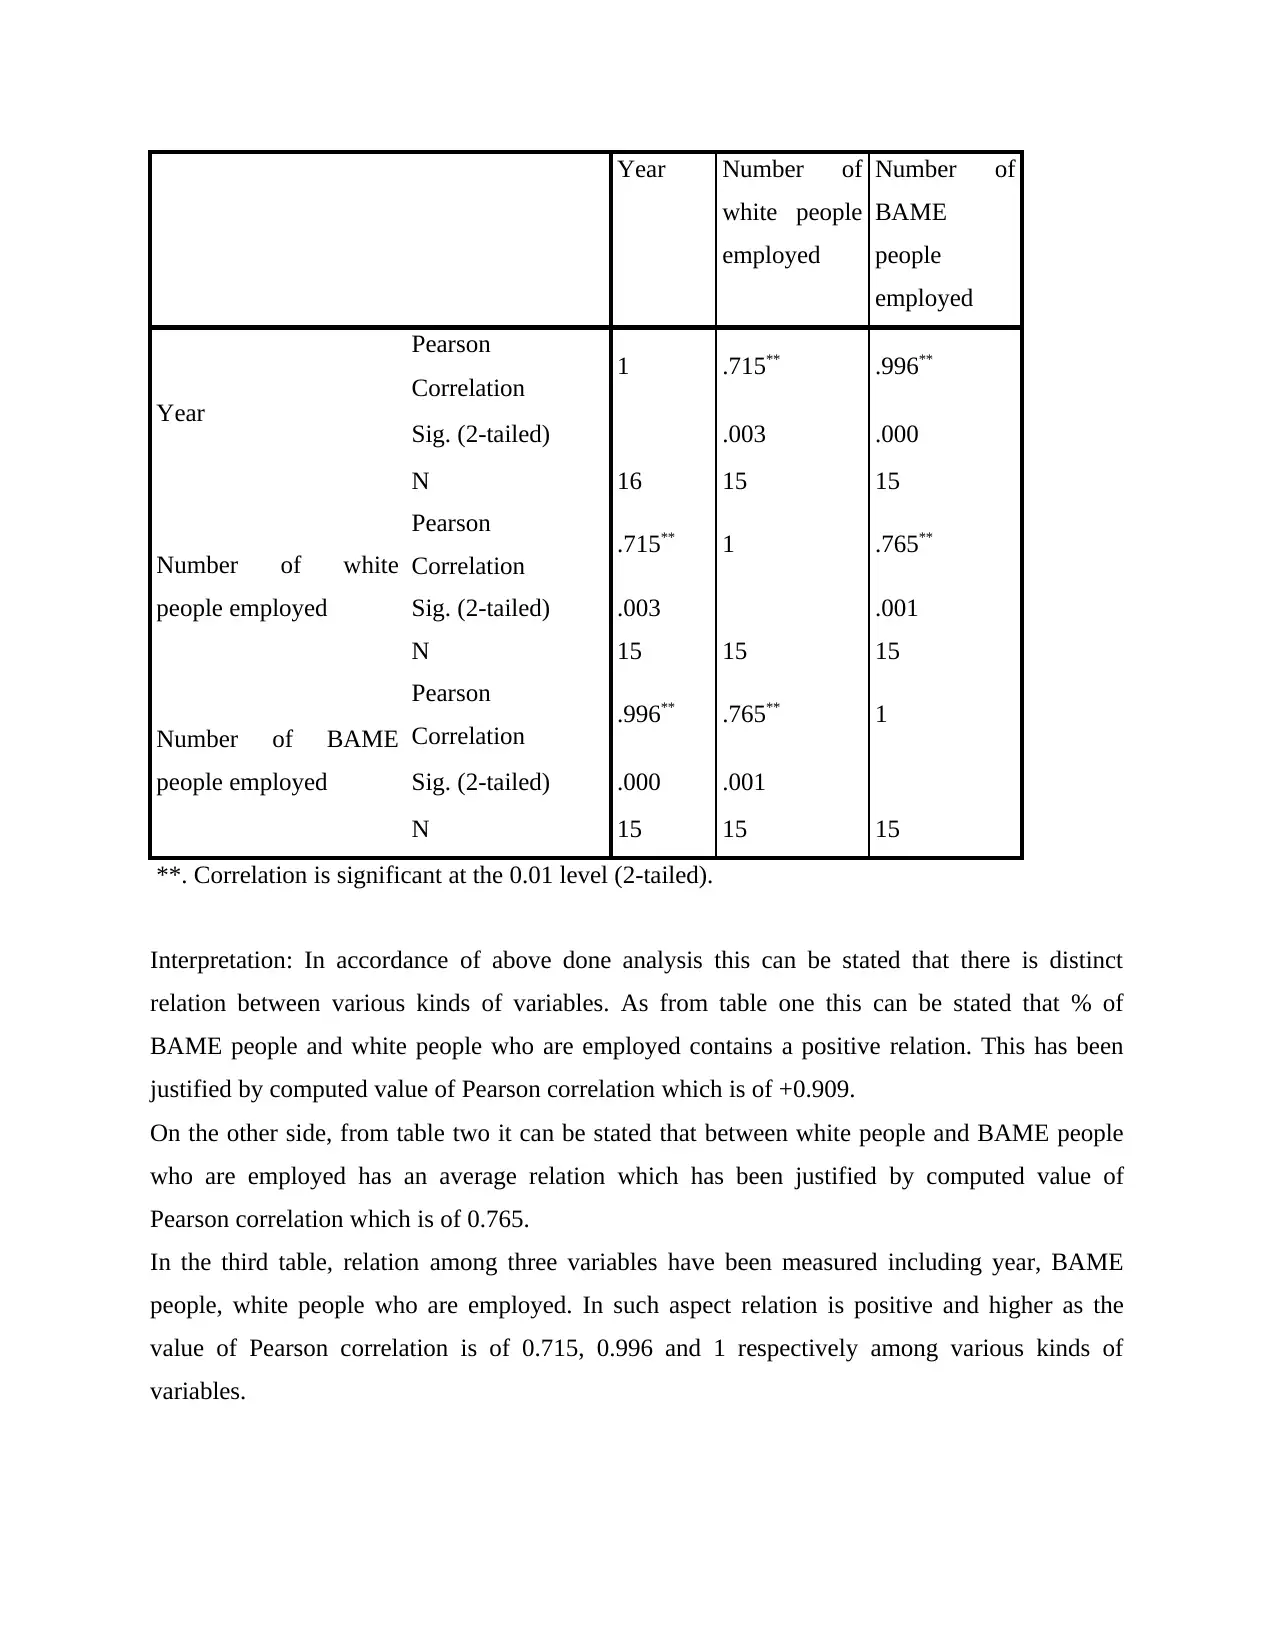
This report provides a detailed analysis of BAME (Black, Asian, and Minority Ethnic) employment in the United Kingdom, focusing on the disparities faced by BAME individuals compared to their white counterparts. The research utilizes data from 2004 to 2019, employing statistical tools such as descriptive statistics, correlation analysis, one-sample t-tests, and ANOVA tests, all conducted using SPSS software and Excel spreadsheets. The analysis reveals significant differences in employment rates and opportunities, with BAME individuals consistently facing lower employment percentages. The report includes graphical presentations to visualize the trends and correlations between variables. The findings highlight the need for effective laws and policies to ensure equal opportunities and address the barriers to BAME employee progression in the workplace, concluding with recommendations based on the data analysis.
Document Page
Practical Data Analysis for Business.
tabler-icon-diamond-filled.svg

Paraphrase This Document

Need a fresh take? Get an instant paraphrase of this document with our AI Paraphraser
Document Page
EXECUTIVE SUMMARY
The report summarizes about information about issues faced by BAME people and white people.
This has been done in an effective manner by proper data set using SPSS software and excel
spread sheet. Apart from this the further part of report abstracts about detailed information
related to statistical outcome which are produced by help of various kinds of approaches like one
sample t-test, ANOVA test and correlation. Each test’s outcome has been interpreted to find out
a suitable outcome so that this can be stated that reason due to which there is significance
difference between selected variables.
Document Page
Contents
EXECUTIVE SUMMARY.......................................................................................................................2
INTRODUCTION.....................................................................................................................................4
MAIN BODY.............................................................................................................................................4
Conclusion................................................................................................................................................16
Recommendation.....................................................................................................................................16
REFERENCES........................................................................................................................................17
Document Page
INTRODUCTION
The report is based on a research topic which is related to condition of BAME people in United
Kingdom in various kinds of aspect. The objective of this report to provide data to a research
company Mac Darwin solution limited as well as the entire project is concentrated on one issue
faced by BAME people. The report contains detailed information about selected issue as well as
relevant data is collected for better understanding of chosen topic and various types of SPSS tests
are also performed in an effective manner.
MAIN BODY
A brief review of the literature on the topic selected
“Barriers to BAME employees' employment and progression in your workplace”
As per the diversity United Kingdom in year 2018, 13.8% of UK population was from a minority
background and 40% of people in London were from BAME background (Carver, 2019). This
shows that majority of people in United Kingdom are from BAME and facing a range of issues
in different kinds of aspects whether it is education field, corporate field or any other.
Basically, everyone must be offered an equal chance to work and opportunities to reach at their
growth and identity at a particular work place. But in United Kingdom this scenario is
completely adverse (Mülle, Tex and Böhm, 2019). This is so because people are provided
opportunity at work place in accordance of their color and religion. Like people who are white
and local are offered greater opportunities of growth at work place. On the other hands, people
who are BAME are not treated in an equal manner. As well as they do not get job as per their
potential and effectiveness. The key cause of such poor performance or behavior of British
companies with BAME people is due to any effective law and rules in United Kingdom. For
such aspect companies need to produce or implement a suitable law which can protect rights of
BAME people as well as can assure than each BAME people is having equal opportunity to
grow.
Review of the appropriate Data Sets:
The data set is related to number of employment which BAME people have in United Kingdom
with compared to white or local people in UK. This data set has been gathered from a relevant
tabler-icon-diamond-filled.svg

Paraphrase This Document

Need a fresh take? Get an instant paraphrase of this document with our AI Paraphraser
Document Page
data source and time period of selected data is from 2004 to 2019. In addition to this, such data
set includes information about number of people employed as well as % of people who have job
in various kinds of sectors. Such data has been selected with an aim to justify the chosen problem
that in United Kingdom BAME people are facing issues related to employment (Ranta, Aarikka-
Stenroos and Mäkinen, 2018). Apart from this, such data is used in SPSS software in order to
produce various kinds of tables and graphs to understand the trend of data set in more
comprehensive manner. Basically, there are a range of techniques and approaches which are used
to analyze to selected data set such as descriptive statistics, regression analysis etc.
Insight from Data Analysis using a statistical package:
Descriptive statistics- Under such statistics tool, basic measurement is done like mean, mode,
median etc. (Harding, J., 2018). By help of such statistical tool this becomes easier for
researchers to know about trend of data set as well as they can know about nature of data by help
of value of mean and standard deviation in an effective manner. Below calculation is done in
such manner that is as follows:
Y
ea
r
% of white people
who are employed
Number of white
people employed
% of BAME people
who are employed
Number of BAME
people employed
20
04 74 25,022,700 58 2,011,900
20
05 74 25,180,000 59 2,163,400
20
06 74 25,245,300 59 2,329,900
20
07 74 25,347,400 60 2,486,900
20
08 74 25,329,800 60 2,611,100
Document Page
20
09 72 24,846,400 59 2,640,900
20
10 72 24,703,600 59 2,755,200
20
11 - - - -
20
12 72 24,749,700 59 2,993,800
20
13 73 24,996,900 59 3,055,700
20
14 74 25,277,300 61 3,259,400
20
15 75 25,718,900 63 3,453,800
20
16 76 25,830,800 64 3,651,900
20
17 77 26,214,500 65 3,712,500
20
18 77 26,212,300 65 3,879,600
20
19 78 26,395,600 66 4,015,700
Descriptive statistics:
Statistics
Document Page
% of white people who are
employed
N Valid 15
Missing 1
Mean 74.40
Median 74.00
Mode 74
Std. Deviation 1.882
% of white people who are employed
Frequency Percent Valid
Percent
Cumulative
Percent
Valid
72 3 18.8 20.0 20.0
73 1 6.3 6.7 26.7
74 6 37.5 40.0 66.7
75 1 6.3 6.7 73.3
76 1 6.3 6.7 80.0
77 2 12.5 13.3 93.3
78 1 6.3 6.7 100.0
Total 15 93.8 100.0
Missing System 1 6.3
Total 16 100.0
tabler-icon-diamond-filled.svg

Paraphrase This Document

Need a fresh take? Get an instant paraphrase of this document with our AI Paraphraser
Document Page
Statistics
% of BAME people who
are employed
N Valid 15
Missing 1
Mean 61.07
Median 60.00
Mode 59
Std. Deviation 2.738
% of BAME people who are employed
Frequency Percent Valid
Percent
Cumulative
Percent
Valid
58 1 6.3 6.7 6.7
59 6 37.5 40.0 46.7
60 2 12.5 13.3 60.0
61 1 6.3 6.7 66.7
Document Page
63 1 6.3 6.7 73.3
64 1 6.3 6.7 80.0
65 2 12.5 13.3 93.3
66 1 6.3 6.7 100.0
Total 15 93.8 100.0
Missing System 1 6.3
Total 16 100.0
Analysis- In accordance of above produce tables, this can be stated that there is huge difference
in terms of number of people who got job which are BAME and white. In comparative manner, it
can be stated that BAME people are getting job at lower % and less number of people who are
Document Page
getting job. On the other side, white people are finding job with higher rate and also there are
more number of people who are getting job.
Statistics
Number of
white people
employed
Number of
BAME
people
employed
N Valid 15 15
Missing 1 1
Mean 25404746.67 3001446.67
Median 25277300.00 2993800.00
Mode 24703600a 2011900a
Std. Deviation 548743.492 640478.320
a. Multiple modes exist. The smallest value is
shown
Interpretation: In accordance of above produced table, this can be stated that value of mean and
standard deviation is far from each other. This indicates that data set is not equally distributed as
mean value is not near with standard deviation.
Correlation between % of white people who are employed and % of BAME people who are
employed:
Correlations
% of white
people who
are employed
% of BAME
people who
are employed
% of white people who
are employed
Pearson
Correlation
1 .909**
tabler-icon-diamond-filled.svg

Paraphrase This Document

Need a fresh take? Get an instant paraphrase of this document with our AI Paraphraser
Document Page
Sig. (2-tailed) .000
N 15 15
% of BAME people
who are employed
Pearson
Correlation .909** 1
Sig. (2-tailed) .000
N 15 15
**. Correlation is significant at the 0.01 level (2-tailed).
Correlations between number of white people who are employed and
BAME people who are employed:
Number of
white people
employed
Number of
BAME
people
employed
Number of white
people employed
Pearson
Correlation 1 .765**
Sig. (2-tailed) .001
N 15 15
Number of BAME
people employed
Pearson
Correlation .765** 1
Sig. (2-tailed) .001
N 15 15
**. Correlation is significant at the 0.01 level (2-tailed).
Correlations
Document Page
Year Number of
white people
employed
Number of
BAME
people
employed
Year
Pearson
Correlation 1 .715** .996**
Sig. (2-tailed) .003 .000
N 16 15 15
Number of white
people employed
Pearson
Correlation .715** 1 .765**
Sig. (2-tailed) .003 .001
N 15 15 15
Number of BAME
people employed
Pearson
Correlation .996** .765** 1
Sig. (2-tailed) .000 .001
N 15 15 15
**. Correlation is significant at the 0.01 level (2-tailed).
Interpretation: In accordance of above done analysis this can be stated that there is distinct
relation between various kinds of variables. As from table one this can be stated that % of
BAME people and white people who are employed contains a positive relation. This has been
justified by computed value of Pearson correlation which is of +0.909.
On the other side, from table two it can be stated that between white people and BAME people
who are employed has an average relation which has been justified by computed value of
Pearson correlation which is of 0.765.
In the third table, relation among three variables have been measured including year, BAME
people, white people who are employed. In such aspect relation is positive and higher as the
value of Pearson correlation is of 0.715, 0.996 and 1 respectively among various kinds of
variables.
chevron_up_icon
1 out of 18
circle_padding
hide_on_mobile
zoom_out_icon
[object Object]