COVID-19 Infection Rates: Statistical Analysis of UK Data (2023)
VerifiedAdded on 2023/01/04
|16
|2415
|97
Report
AI Summary
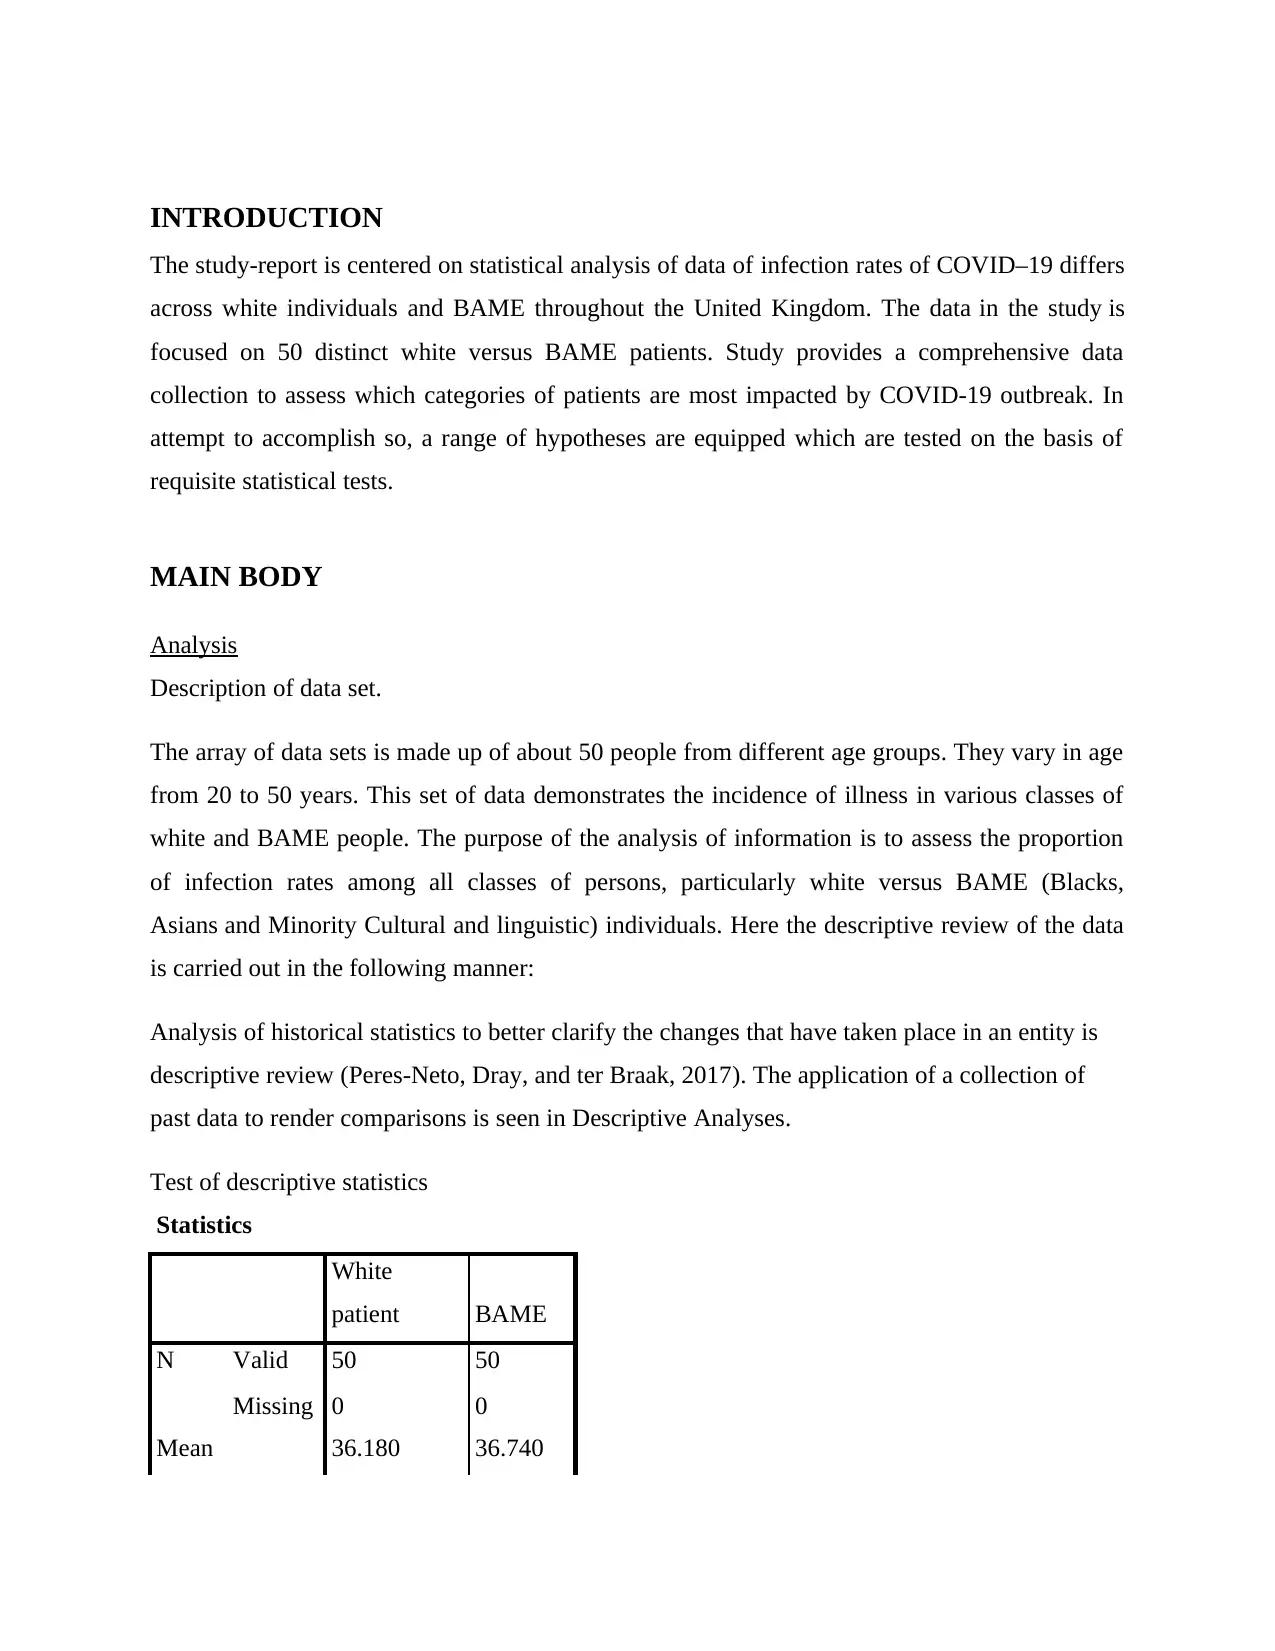
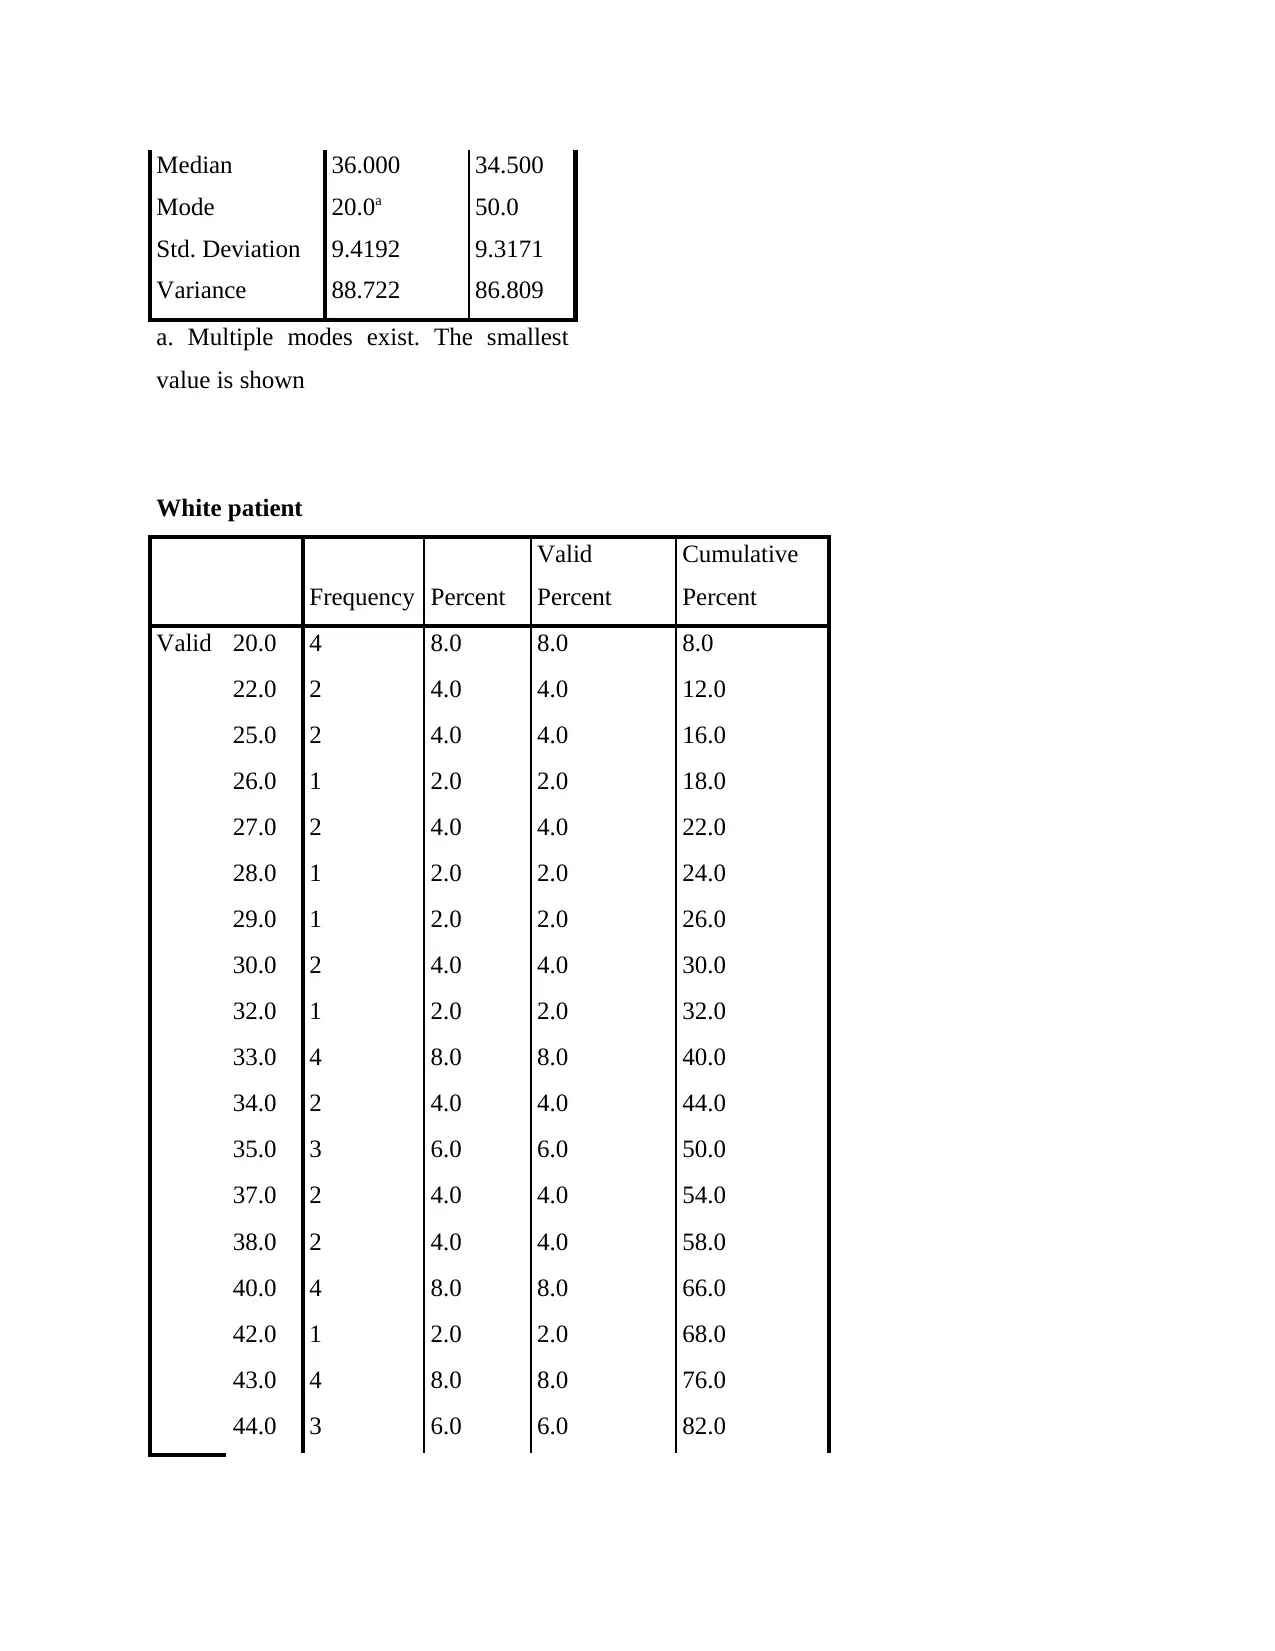
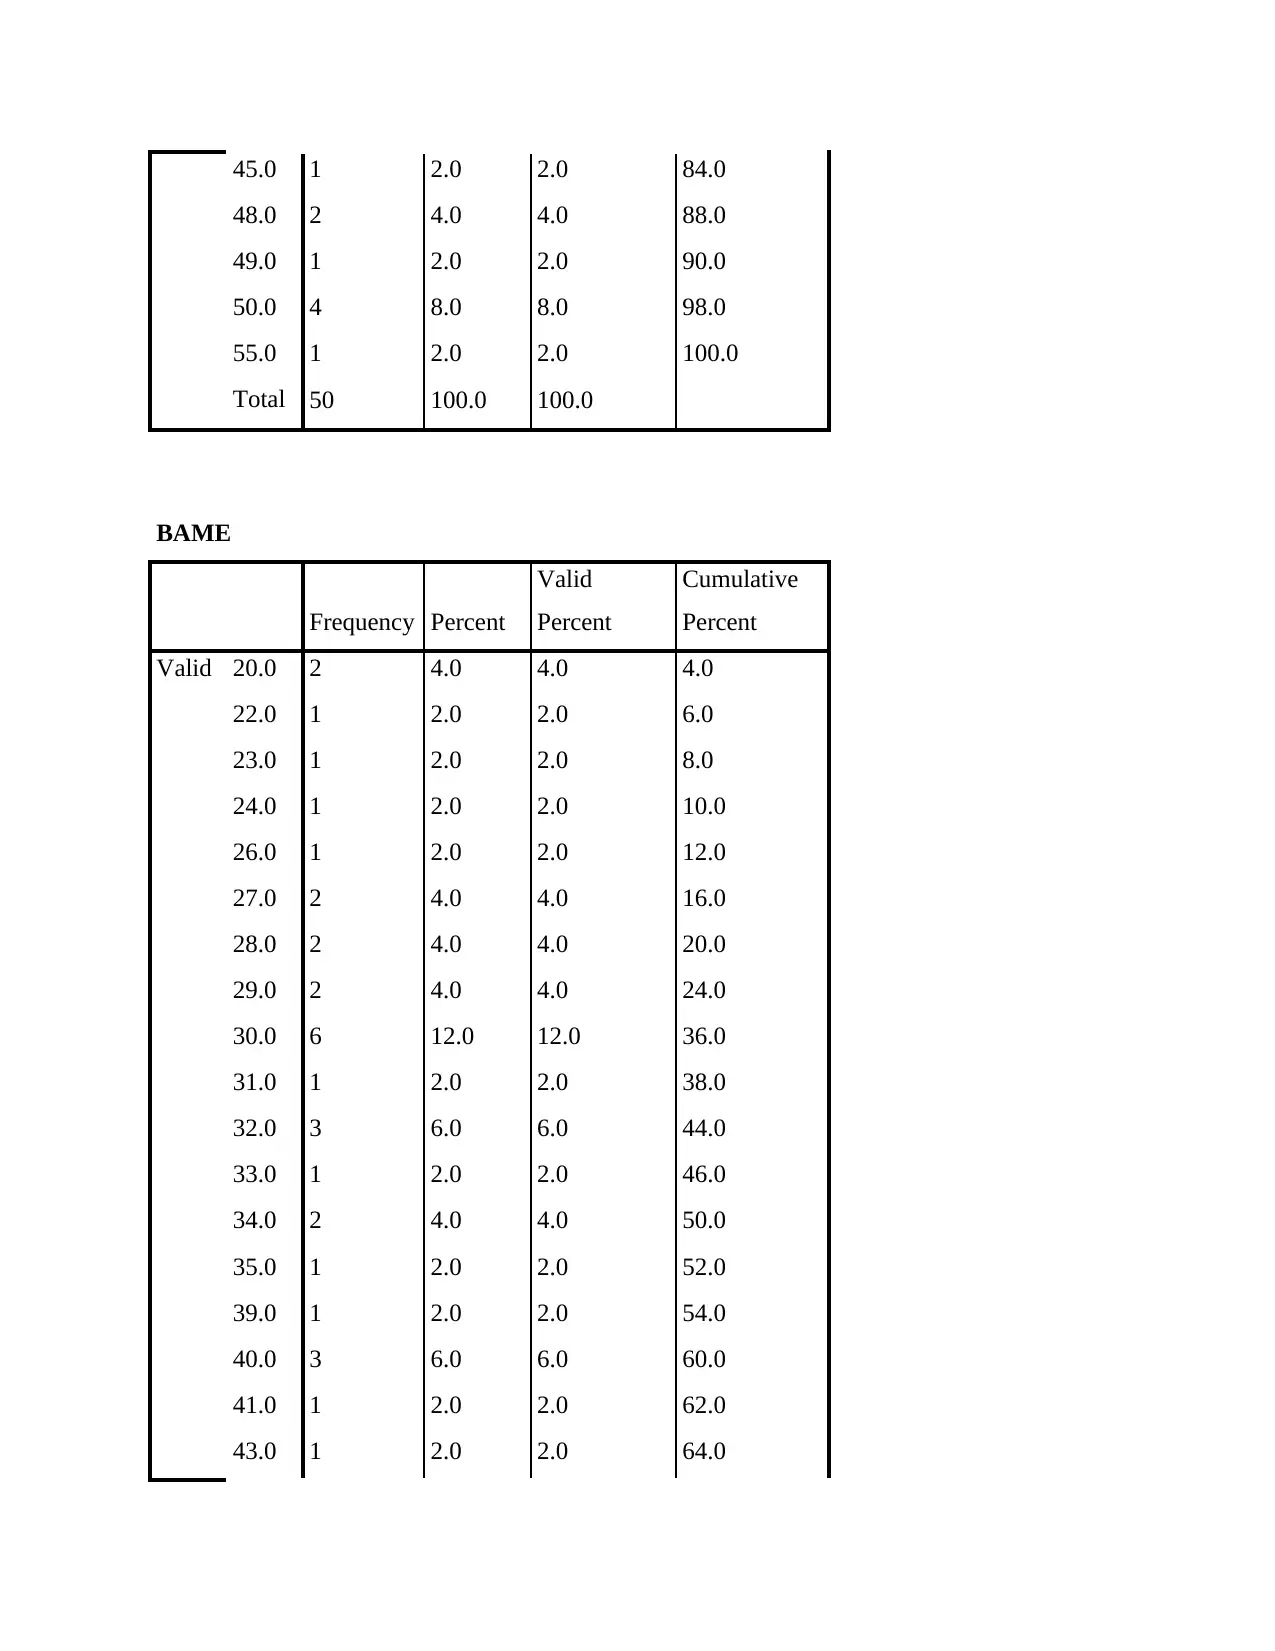
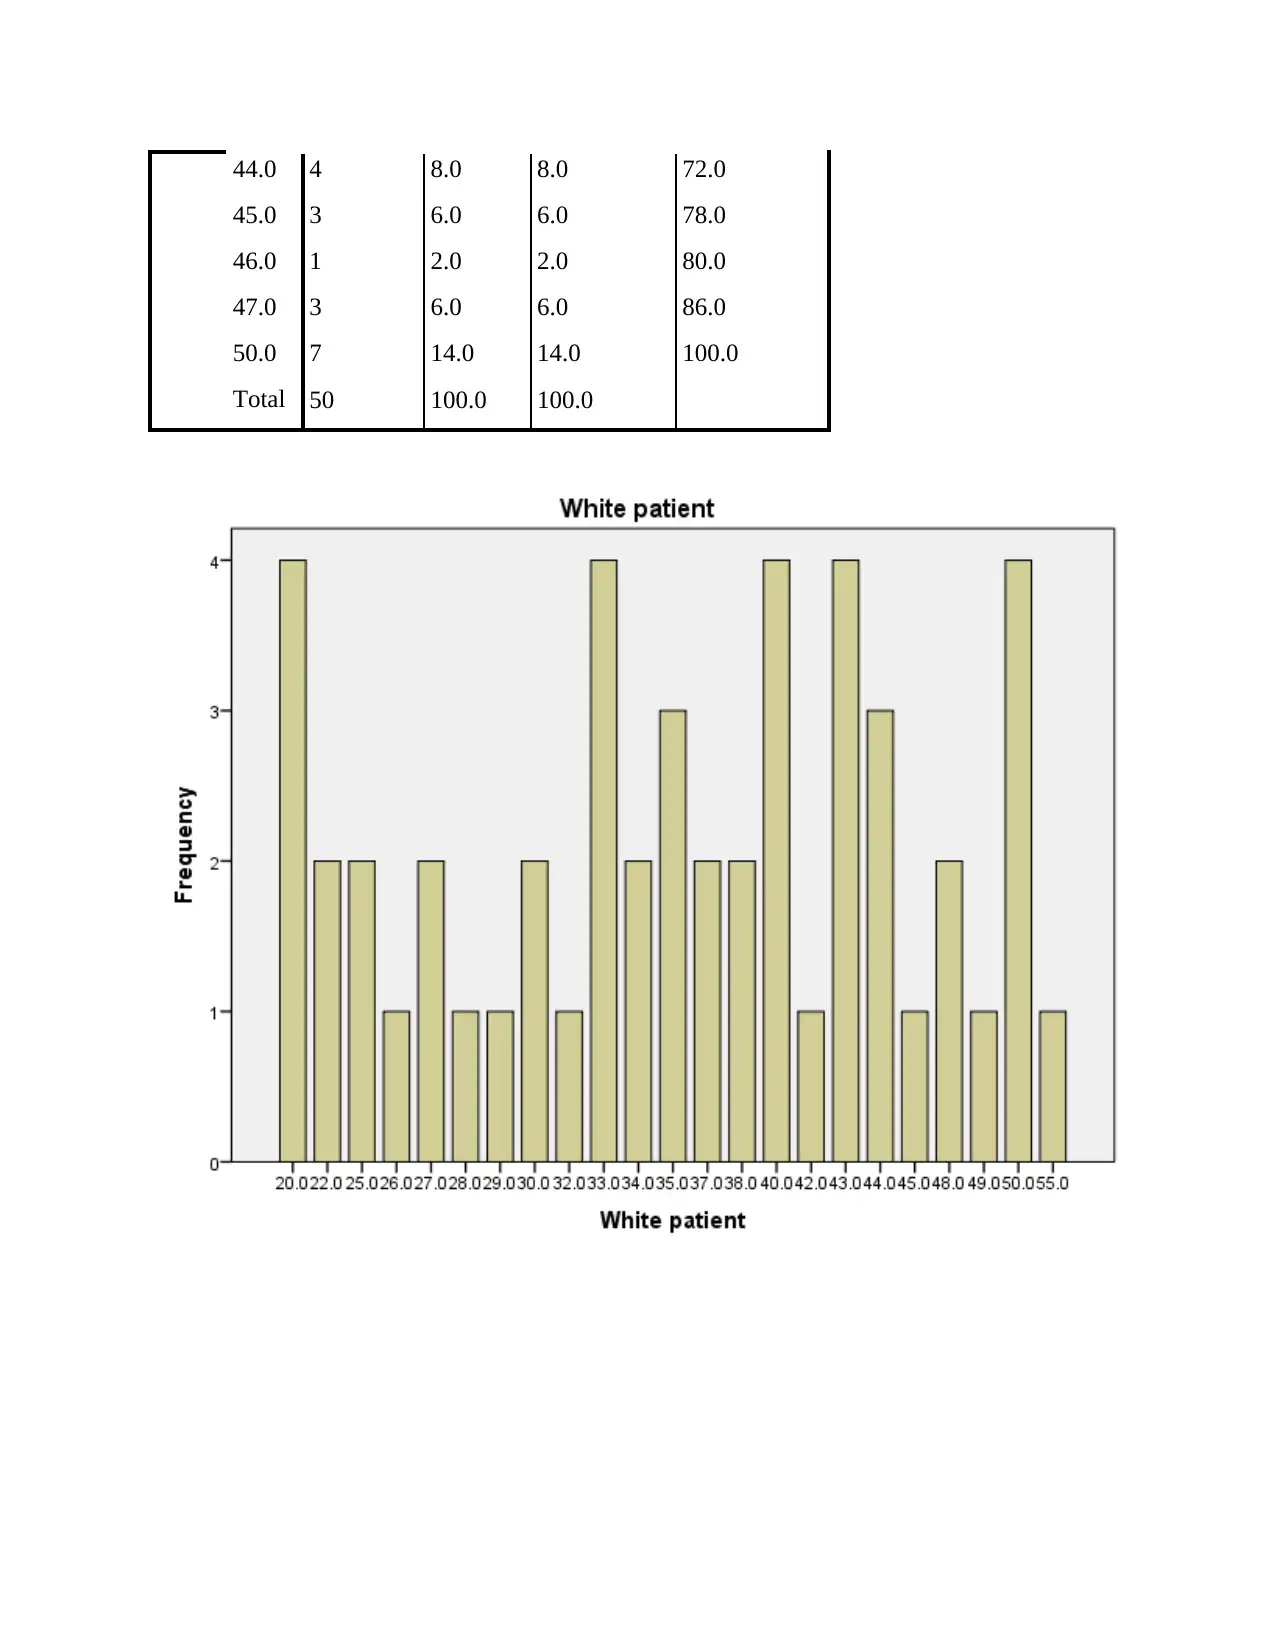
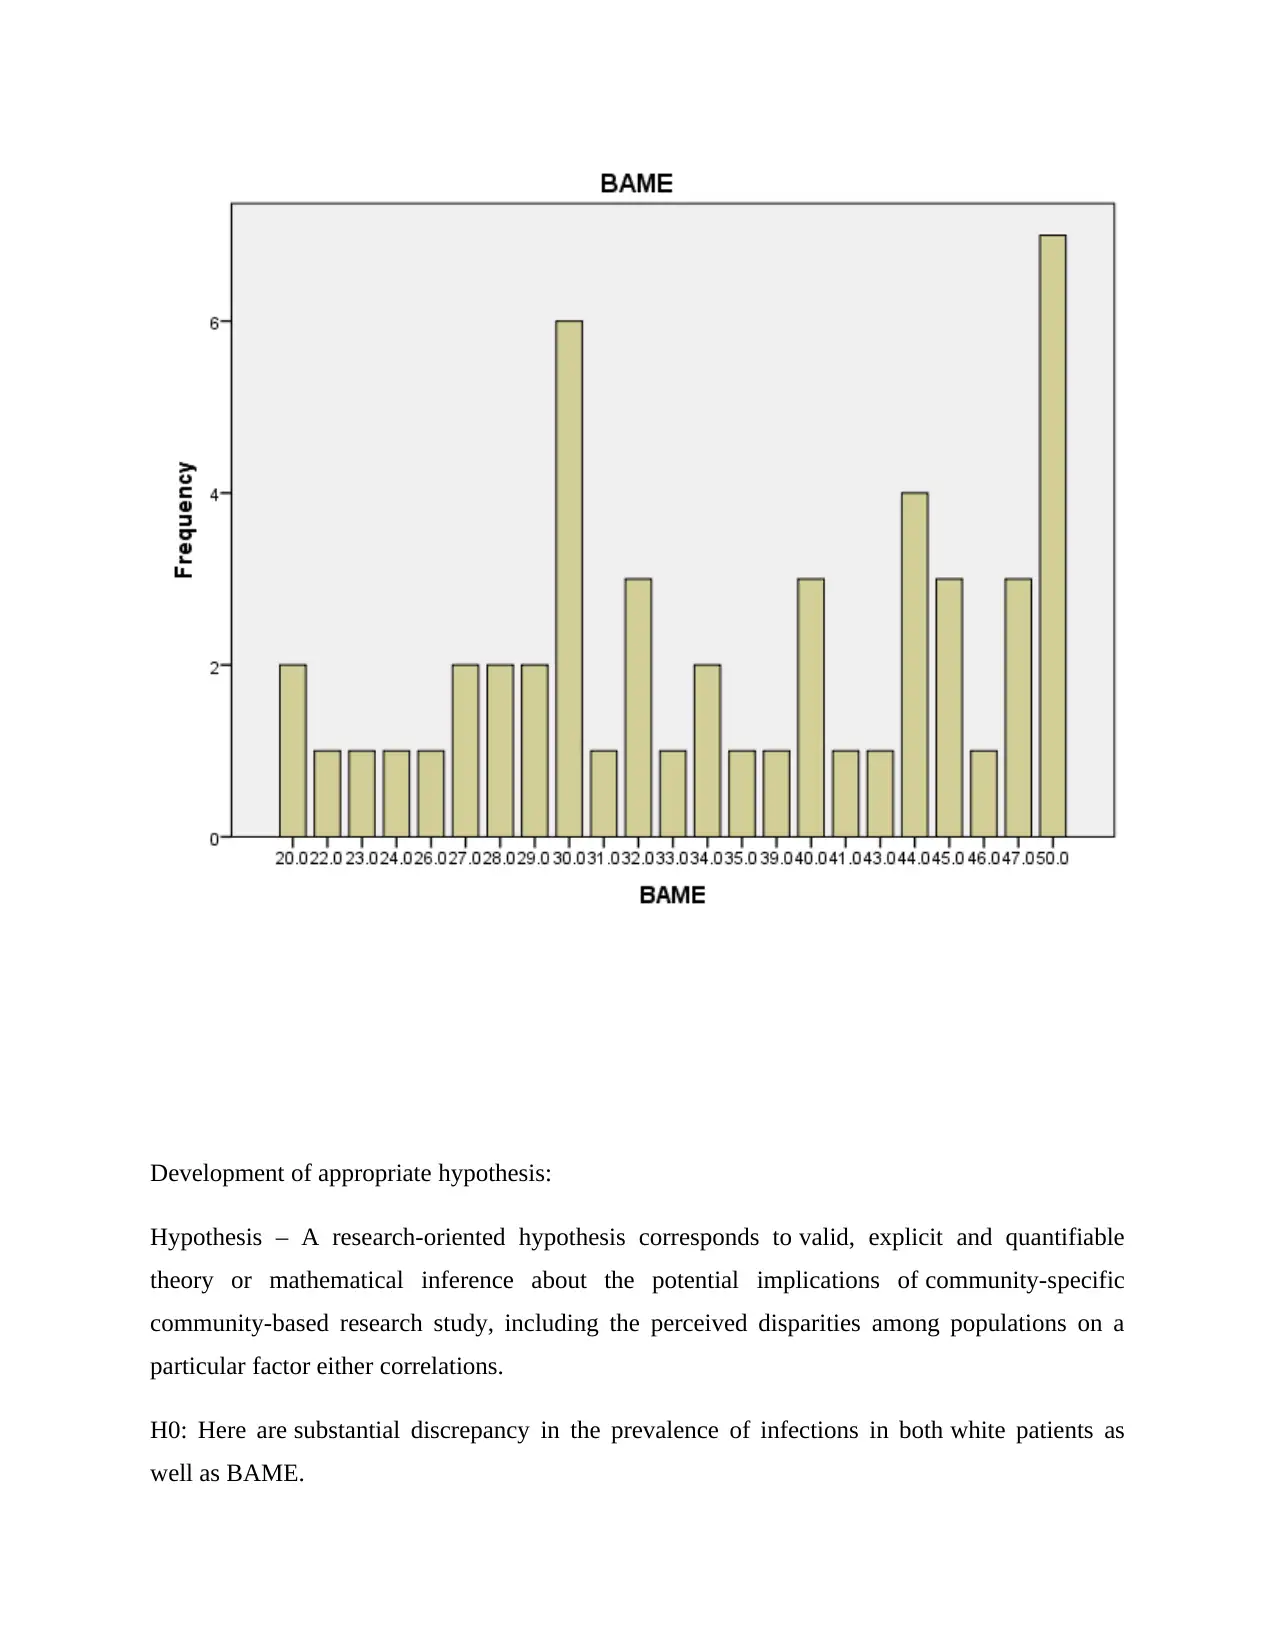
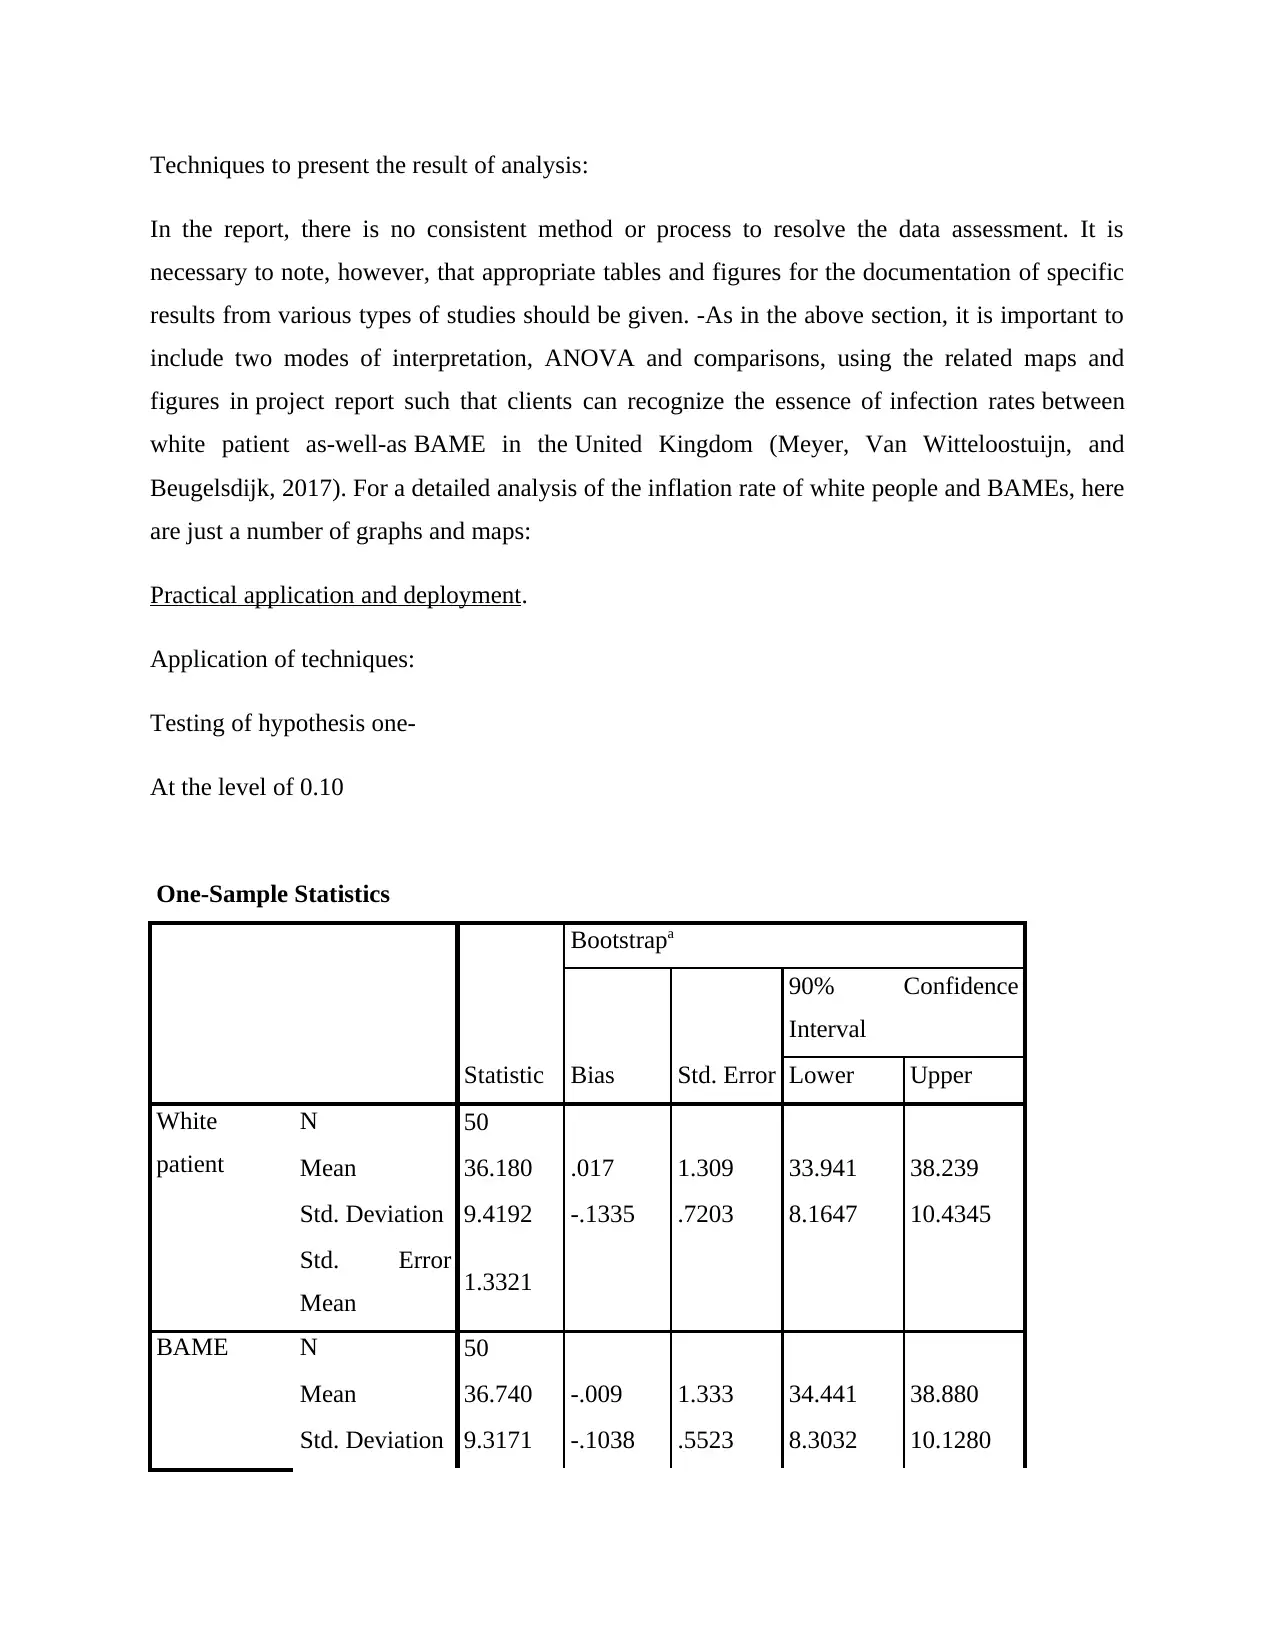
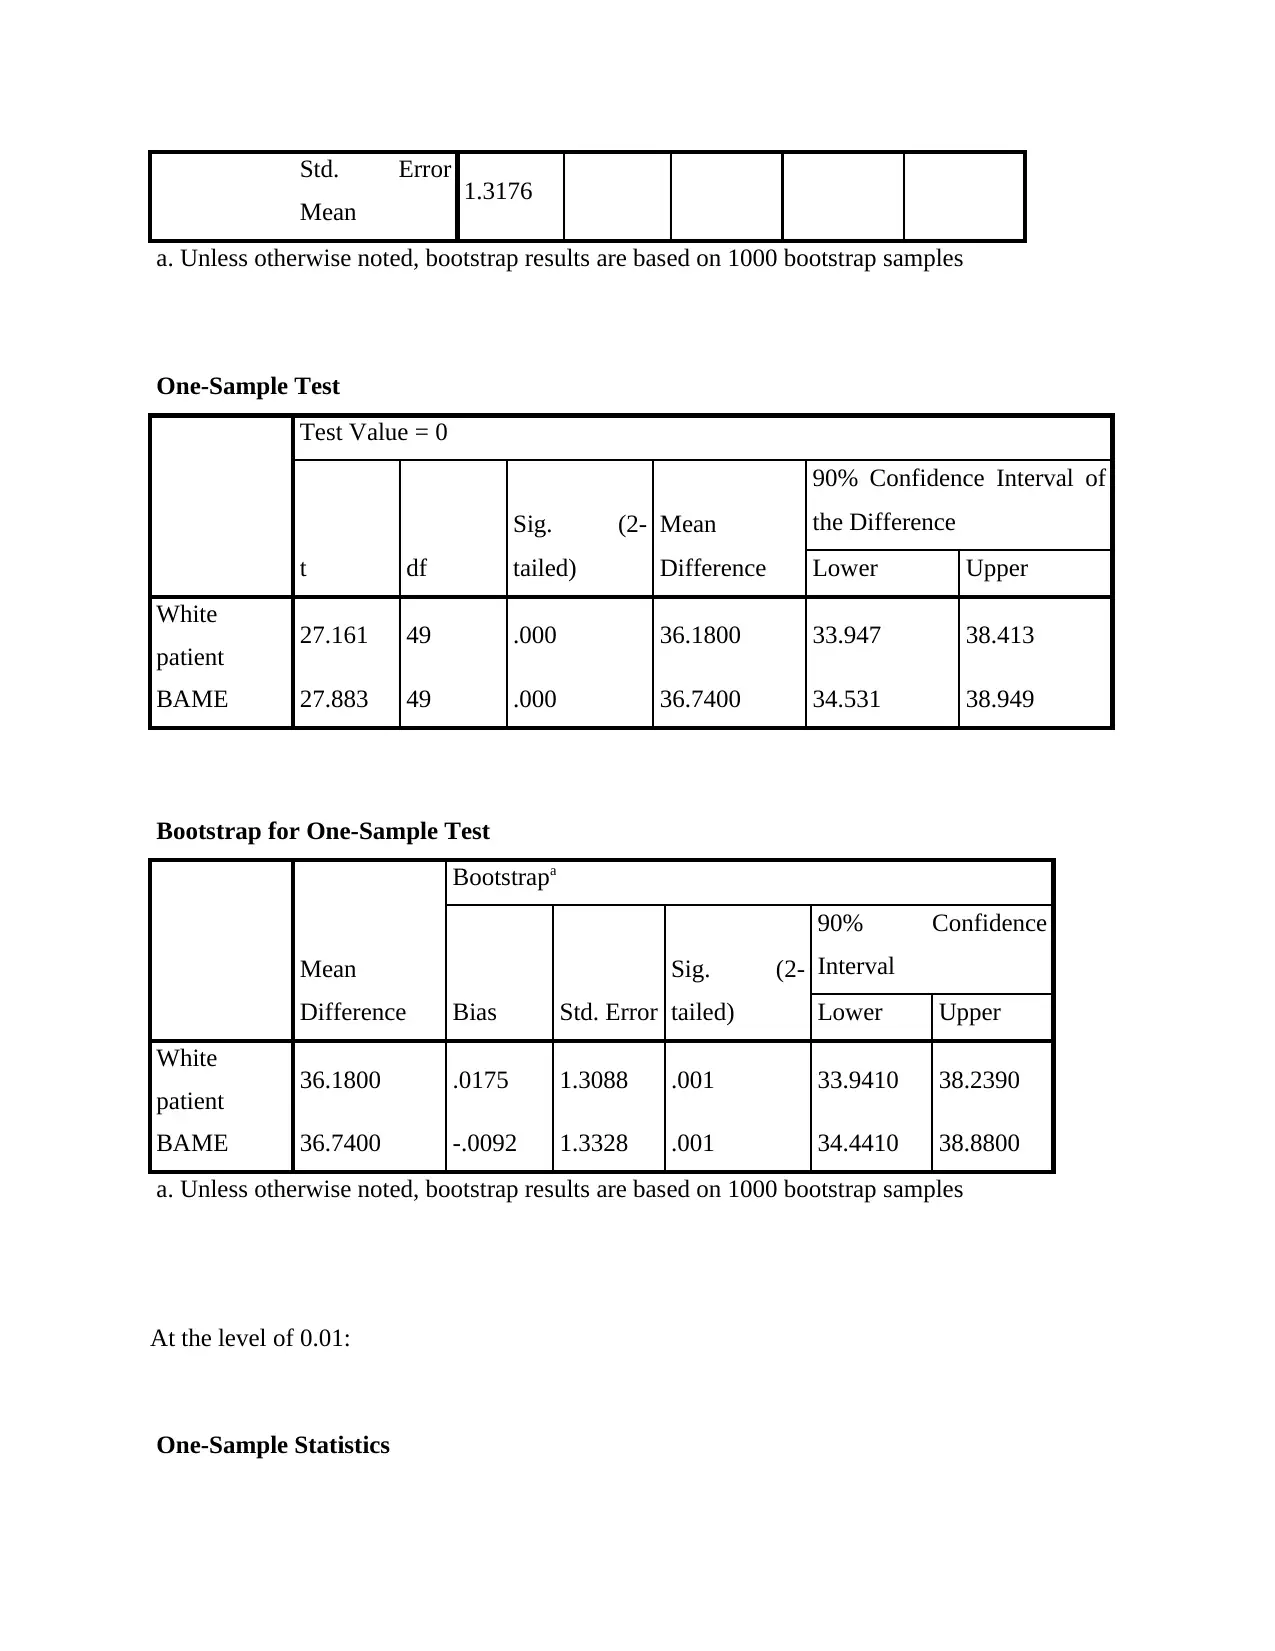
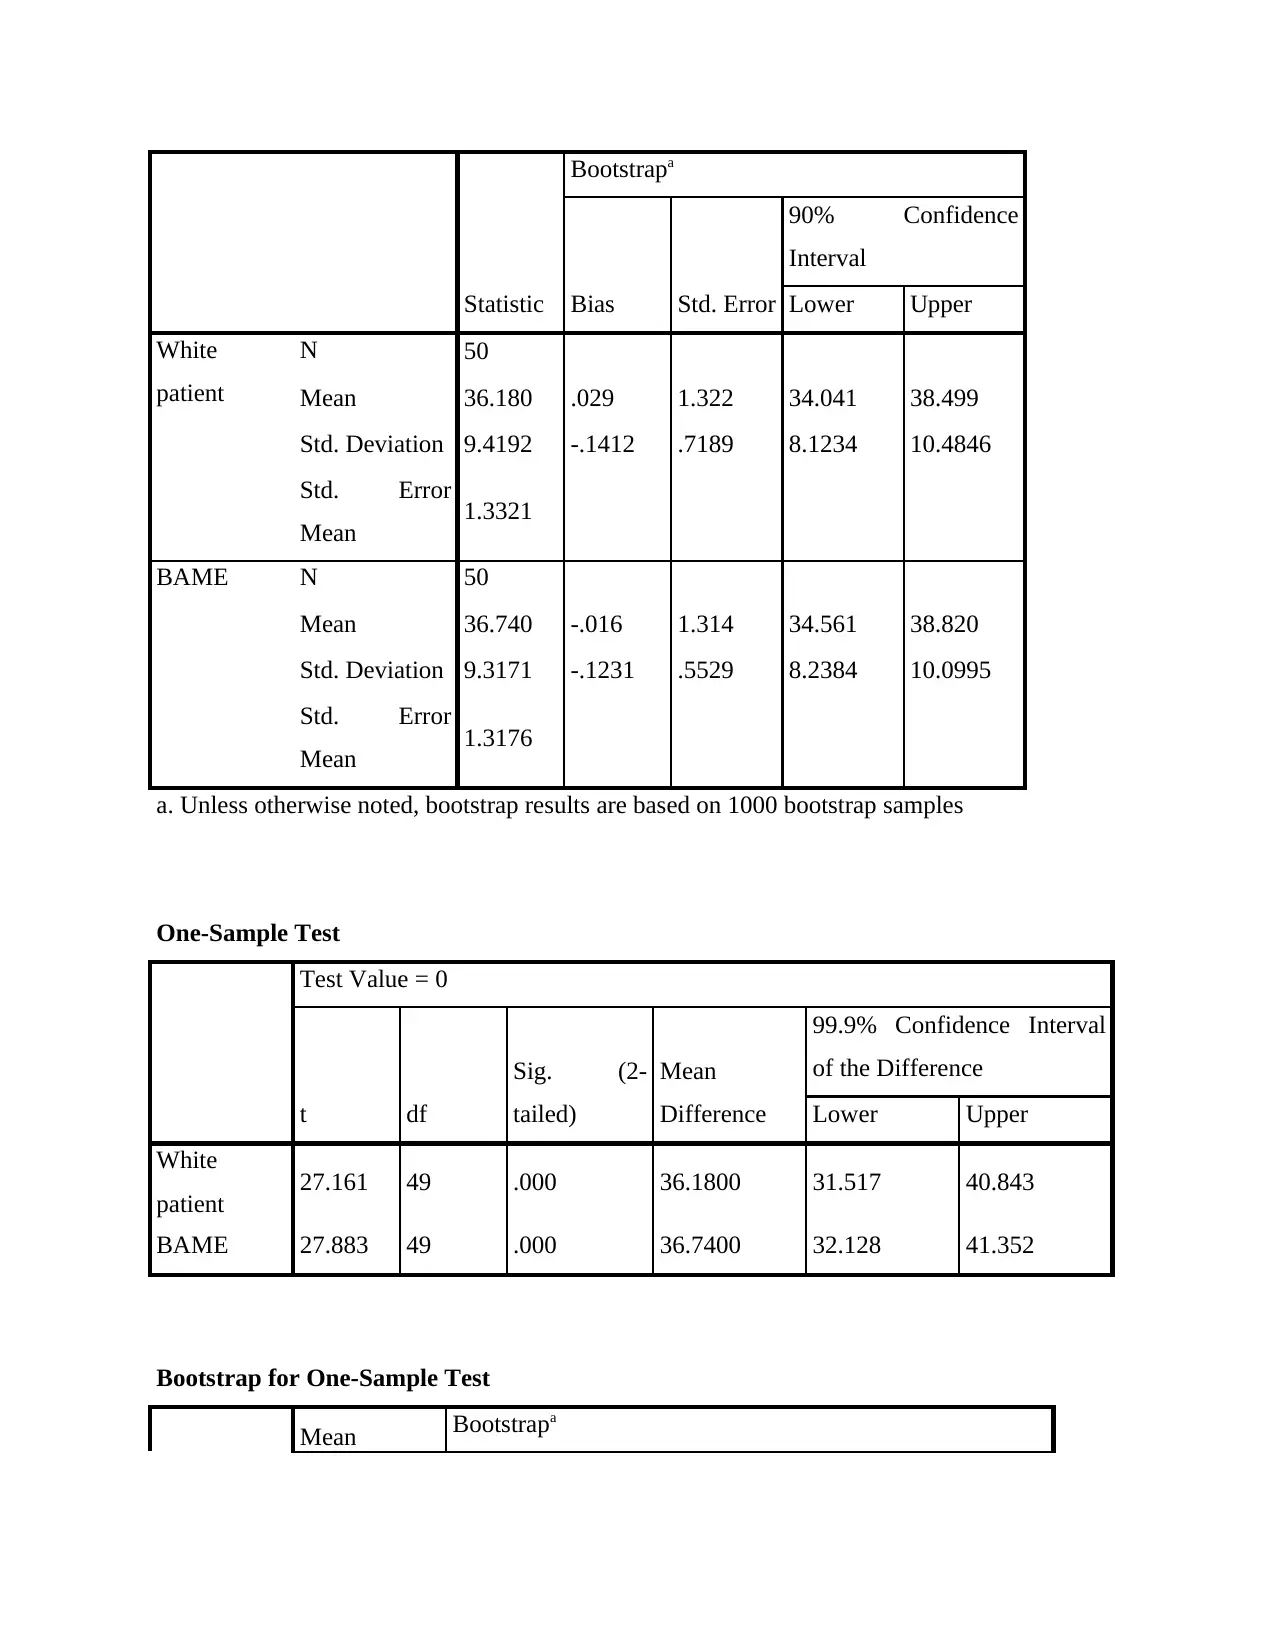
This report presents a statistical analysis of COVID-19 infection rates among white and BAME (Black, Asian, and Minority Ethnic) individuals in the United Kingdom, based on a dataset of 50 patients. The study investigates potential disparities in infection rates between the two groups, employing descriptive statistics, hypothesis testing (one-sample t-tests), and correlation analysis. The analysis includes the development and testing of hypotheses regarding infection rate differences and correlations, utilizing statistical methods to determine the significance of observed variations. The results, presented with statistical tables and interpretations, indicate a significant difference in infection rates between the two groups. Furthermore, a correlation was identified between the rates of infection, revealing insights into the impact of COVID-19 on different demographic groups. The report concludes with a discussion of the findings and their implications.

Data Analysis and Visualization
Paraphrase This Document
Need a fresh take? Get an instant paraphrase of this document with our AI Paraphraser

Contents
INTRODUCTION.......................................................................................................................................3
MAIN BODY..............................................................................................................................................3
Analysis...................................................................................................................................................3
Practical application and deployment......................................................................................................9
CONCLUSION.........................................................................................................................................15
REFERENCES..........................................................................................................................................16

INTRODUCTION
The study-report is centered on statistical analysis of data of infection rates of COVID–19 differs
across white individuals and BAME throughout the United Kingdom. The data in the study is
focused on 50 distinct white versus BAME patients. Study provides a comprehensive data
collection to assess which categories of patients are most impacted by COVID-19 outbreak. In
attempt to accomplish so, a range of hypotheses are equipped which are tested on the basis of
requisite statistical tests.
MAIN BODY
Analysis
Description of data set.
The array of data sets is made up of about 50 people from different age groups. They vary in age
from 20 to 50 years. This set of data demonstrates the incidence of illness in various classes of
white and BAME people. The purpose of the analysis of information is to assess the proportion
of infection rates among all classes of persons, particularly white versus BAME (Blacks,
Asians and Minority Cultural and linguistic) individuals. Here the descriptive review of the data
is carried out in the following manner:
Analysis of historical statistics to better clarify the changes that have taken place in an entity is
descriptive review (Peres‐Neto, Dray, and ter Braak, 2017). The application of a collection of
past data to render comparisons is seen in Descriptive Analyses.
Test of descriptive statistics
Statistics
White
patient BAME
N Valid 50 50
Missing 0 0
Mean 36.180 36.740
⊘ This is a preview!⊘
Do you want full access?
Subscribe today to unlock all pages.

Trusted by 1+ million students worldwide

Median 36.000 34.500
Mode 20.0a 50.0
Std. Deviation 9.4192 9.3171
Variance 88.722 86.809
a. Multiple modes exist. The smallest
value is shown
White patient
Frequency Percent
Valid
Percent
Cumulative
Percent
Valid 20.0 4 8.0 8.0 8.0
22.0 2 4.0 4.0 12.0
25.0 2 4.0 4.0 16.0
26.0 1 2.0 2.0 18.0
27.0 2 4.0 4.0 22.0
28.0 1 2.0 2.0 24.0
29.0 1 2.0 2.0 26.0
30.0 2 4.0 4.0 30.0
32.0 1 2.0 2.0 32.0
33.0 4 8.0 8.0 40.0
34.0 2 4.0 4.0 44.0
35.0 3 6.0 6.0 50.0
37.0 2 4.0 4.0 54.0
38.0 2 4.0 4.0 58.0
40.0 4 8.0 8.0 66.0
42.0 1 2.0 2.0 68.0
43.0 4 8.0 8.0 76.0
44.0 3 6.0 6.0 82.0
Paraphrase This Document
Need a fresh take? Get an instant paraphrase of this document with our AI Paraphraser

45.0 1 2.0 2.0 84.0
48.0 2 4.0 4.0 88.0
49.0 1 2.0 2.0 90.0
50.0 4 8.0 8.0 98.0
55.0 1 2.0 2.0 100.0
Total 50 100.0 100.0
BAME
Frequency Percent
Valid
Percent
Cumulative
Percent
Valid 20.0 2 4.0 4.0 4.0
22.0 1 2.0 2.0 6.0
23.0 1 2.0 2.0 8.0
24.0 1 2.0 2.0 10.0
26.0 1 2.0 2.0 12.0
27.0 2 4.0 4.0 16.0
28.0 2 4.0 4.0 20.0
29.0 2 4.0 4.0 24.0
30.0 6 12.0 12.0 36.0
31.0 1 2.0 2.0 38.0
32.0 3 6.0 6.0 44.0
33.0 1 2.0 2.0 46.0
34.0 2 4.0 4.0 50.0
35.0 1 2.0 2.0 52.0
39.0 1 2.0 2.0 54.0
40.0 3 6.0 6.0 60.0
41.0 1 2.0 2.0 62.0
43.0 1 2.0 2.0 64.0

44.0 4 8.0 8.0 72.0
45.0 3 6.0 6.0 78.0
46.0 1 2.0 2.0 80.0
47.0 3 6.0 6.0 86.0
50.0 7 14.0 14.0 100.0
Total 50 100.0 100.0
45.0 3 6.0 6.0 78.0
46.0 1 2.0 2.0 80.0
47.0 3 6.0 6.0 86.0
50.0 7 14.0 14.0 100.0
Total 50 100.0 100.0
⊘ This is a preview!⊘
Do you want full access?
Subscribe today to unlock all pages.

Trusted by 1+ million students worldwide

Development of appropriate hypothesis:
Hypothesis – A research-oriented hypothesis corresponds to valid, explicit and quantifiable
theory or mathematical inference about the potential implications of community-specific
community-based research study, including the perceived disparities among populations on a
particular factor either correlations.
H0: Here are substantial discrepancy in the prevalence of infections in both white patients as
well as BAME.
Paraphrase This Document
Need a fresh take? Get an instant paraphrase of this document with our AI Paraphraser

H1: There really is no substantial variation in the incidence of infections in the white patients as
well as BAME.
H0: There's indeed a link between the incidence of infections in white people and BAME.
H1: Here's no correlation between the rate/level of infections in white patients as well as BAME.
Techniques to perform the analysis:
There are a variety of methodologies and approaches for conducting the review, as well
as ANOVA test also is one of the effective approaches for calculating a large variation in a
specific data set. With the exception of such, association analysis may be a critical tool for
determining the relationship between the data collection of the white patients including BAMEs.
One-sample T-test could be employed to verify if the data collected is substantially
distinct from some degree of importance. -Everyone renders statements as to
how confidence intervals indicating μ is related to any degree of significance level-M.
Also, t-test is a form of descriptive review employed to determine if there are significant
contrasts here between various variables that could be applied to such attributes (Green,
2016). It is often used if the data sets perform as specified and may have unidentified
differences, such as the data sets recorded as a consequence of flipping dice hundred
times. Also a t-test is being employed as a fundamental test method which enables the
assessment of a group-specific inferences.
Correlation—In stats, any statistical relationship, either reciprocal or non-reciprocal,
amongst two or multiple factors or multivariate information is connection or dependence.
In the largest possible sense, correlations are any significant correlation, but it typically
represents the degree to which a set of requirements are linearly connected. Correlations
are useful since it is important to suggest a logical connection that could be easily used.
For example, demonstrate the relation between generating potential and climate that the
utility company would generate less electricity on a mild day. And then, in this case,
when cold weather allows people to have more energy for central heating, there is still a
causal correlation. In particular, although the structure of a partnership is not likely to be
sufficient for the presence of a causality that runs.

Techniques to present the result of analysis:
In the report, there is no consistent method or process to resolve the data assessment. It is
necessary to note, however, that appropriate tables and figures for the documentation of specific
results from various types of studies should be given. -As in the above section, it is important to
include two modes of interpretation, ANOVA and comparisons, using the related maps and
figures in project report such that clients can recognize the essence of infection rates between
white patient as-well-as BAME in the United Kingdom (Meyer, Van Witteloostuijn, and
Beugelsdijk, 2017). For a detailed analysis of the inflation rate of white people and BAMEs, here
are just a number of graphs and maps:
Practical application and deployment.
Application of techniques:
Testing of hypothesis one-
At the level of 0.10
One-Sample Statistics
Statistic
Bootstrapa
Bias Std. Error
90% Confidence
Interval
Lower Upper
White
patient
N 50
Mean 36.180 .017 1.309 33.941 38.239
Std. Deviation 9.4192 -.1335 .7203 8.1647 10.4345
Std. Error
Mean 1.3321
BAME N 50
Mean 36.740 -.009 1.333 34.441 38.880
Std. Deviation 9.3171 -.1038 .5523 8.3032 10.1280
⊘ This is a preview!⊘
Do you want full access?
Subscribe today to unlock all pages.

Trusted by 1+ million students worldwide

Std. Error
Mean 1.3176
a. Unless otherwise noted, bootstrap results are based on 1000 bootstrap samples
One-Sample Test
Test Value = 0
t df
Sig. (2-
tailed)
Mean
Difference
90% Confidence Interval of
the Difference
Lower Upper
White
patient 27.161 49 .000 36.1800 33.947 38.413
BAME 27.883 49 .000 36.7400 34.531 38.949
Bootstrap for One-Sample Test
Mean
Difference
Bootstrapa
Bias Std. Error
Sig. (2-
tailed)
90% Confidence
Interval
Lower Upper
White
patient 36.1800 .0175 1.3088 .001 33.9410 38.2390
BAME 36.7400 -.0092 1.3328 .001 34.4410 38.8800
a. Unless otherwise noted, bootstrap results are based on 1000 bootstrap samples
At the level of 0.01:
One-Sample Statistics
Paraphrase This Document
Need a fresh take? Get an instant paraphrase of this document with our AI Paraphraser

Statistic
Bootstrapa
Bias Std. Error
90% Confidence
Interval
Lower Upper
White
patient
N 50
Mean 36.180 .029 1.322 34.041 38.499
Std. Deviation 9.4192 -.1412 .7189 8.1234 10.4846
Std. Error
Mean 1.3321
BAME N 50
Mean 36.740 -.016 1.314 34.561 38.820
Std. Deviation 9.3171 -.1231 .5529 8.2384 10.0995
Std. Error
Mean 1.3176
a. Unless otherwise noted, bootstrap results are based on 1000 bootstrap samples
One-Sample Test
Test Value = 0
t df
Sig. (2-
tailed)
Mean
Difference
99.9% Confidence Interval
of the Difference
Lower Upper
White
patient 27.161 49 .000 36.1800 31.517 40.843
BAME 27.883 49 .000 36.7400 32.128 41.352
Bootstrap for One-Sample Test
Mean Bootstrapa

Difference Bias Std. Error
Sig. (2-
tailed)
90% Confidence
Interval
Lower Upper
White
patient 36.1800 .0294 1.3218 .001 34.0410 38.4990
BAME 36.7400 -.0160 1.3143 .001 34.5610 38.8200
a. Unless otherwise noted, bootstrap results are based on 1000 bootstrap samples
At the level of 0.02
One-Sample Statistics
Statistic
Bootstrapa
Bias Std. Error
90% Confidence
Interval
Lower Upper
White
patient
N 50
Mean 36.180 .004 1.258 34.140 38.299
Std. Deviation 9.4192 -.1164 .6726 8.1665 10.4398
Std. Error
Mean 1.3321
BAME N 50
Mean 36.740 -.008 1.305 34.501 38.840
Std. Deviation 9.3171 -.1215 .5635 8.1801 10.1315
Std. Error
Mean 1.3176
a. Unless otherwise noted, bootstrap results are based on 1000 bootstrap samples
⊘ This is a preview!⊘
Do you want full access?
Subscribe today to unlock all pages.

Trusted by 1+ million students worldwide
1 out of 16
Related Documents

Your All-in-One AI-Powered Toolkit for Academic Success.
+13062052269
info@desklib.com
Available 24*7 on WhatsApp / Email
Unlock your academic potential
© 2024 | Zucol Services PVT LTD | All rights reserved.