Predicting Selling Prices of Houses - Statistics Study
Added on 2023-04-23
17 Pages4445 Words319 Views
PREDICTING SELLING PRICES OF HOUSES
Statistics
Student Name:
Student Number:
Date: 14th January 2019
Statistics
Student Name:
Student Number:
Date: 14th January 2019
Table of Contents
Introduction......................................................................................................................................3
Methodology....................................................................................................................................3
Data..................................................................................................................................................4
Description of the variables.........................................................................................................6
Data Analysis...................................................................................................................................6
Descriptive Statistics....................................................................................................................6
Measure of association.................................................................................................................8
Regression analysis....................................................................................................................10
Conclusion.....................................................................................................................................13
List of tables
Table 1: Dataset...............................................................................................................................4
Table 2: Variable names..................................................................................................................5
Table 3: Description of variables.....................................................................................................6
Table 4: Descriptive statistics..........................................................................................................7
Table 5: Correlations.......................................................................................................................8
Table 6: SUMMARY OUTPUT....................................................................................................10
Table 7: ANOVA...........................................................................................................................11
Table 8: Coefficients table.............................................................................................................11
Introduction
Housing is an essential component of human beings. Every human being deserves a place to
shelter on (housing). The reason for our task was to try and analyze costs of homes in light of a
few factors. Among the factors or rather the parameters that we considered were the local selling
prices city area, the number of bathrooms, the area of the site in thousands of square feet, the size
of the living space in thousands of square feet, the number of garages, the number of rooms, the
number of bedrooms, the age of the house in years and the number of fire places (Vigenia &
Kritikos, 2004). The population of interest is the price of houses in Sydney Australia. A sample
population was drawn from the entire population of interest. The main desire of this report is to
show signs of improvement comprehension of how different elements of a home impact its
moving cost (Boddy & Smith, 2009). This study research is critical to property holders as well as
real estate brokers who are engaged with purchasing and moving houses and government
authorities who are included with controlling expenses (Kucukmehmetoglu & Geymen, 2008).
Methodology
Data for this study was retrieved from the following link
https://people.sc.fsu.edu/~jburkardt/datasets/regression/x26.txt. The data is a cross sectional data
with 28 observations and 10 variables. Both descriptive and inferential statistics were used to
analyze the relationship between the three variables. Pearson correlation test and regression
analysis model was performed to identify the strength and direction of relationship between the
variables.
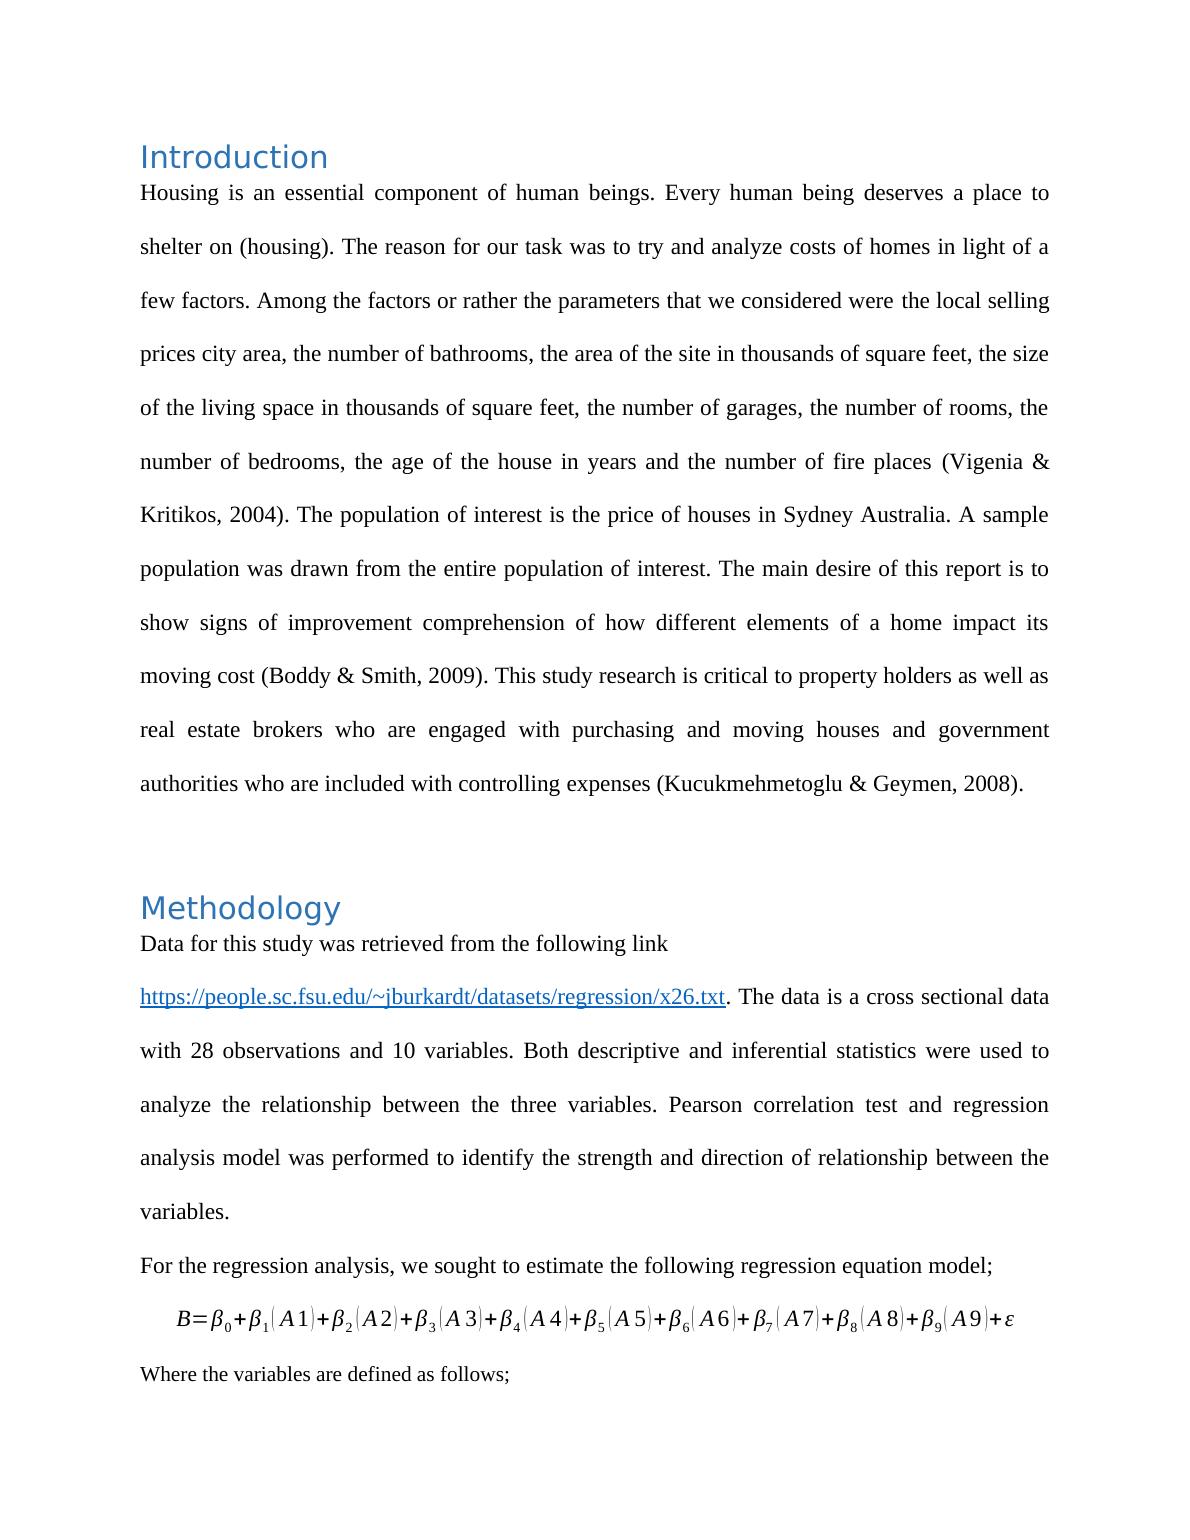
For the regression analysis, we sought to estimate the following regression equation model;
B=β0 + β1 ( A 1 ) + β2 ( A 2 ) + β3 ( A 3 ) + β4 ( A 4 ) + β5 ( A 5 ) + β6 ( A 6 ) + β7 ( A 7 ) + β8 ( A 8 ) + β9 ( A 9 ) +ε
Where the variables are defined as follows;
Housing is an essential component of human beings. Every human being deserves a place to
shelter on (housing). The reason for our task was to try and analyze costs of homes in light of a
few factors. Among the factors or rather the parameters that we considered were the local selling
prices city area, the number of bathrooms, the area of the site in thousands of square feet, the size
of the living space in thousands of square feet, the number of garages, the number of rooms, the
number of bedrooms, the age of the house in years and the number of fire places (Vigenia &
Kritikos, 2004). The population of interest is the price of houses in Sydney Australia. A sample
population was drawn from the entire population of interest. The main desire of this report is to
show signs of improvement comprehension of how different elements of a home impact its
moving cost (Boddy & Smith, 2009). This study research is critical to property holders as well as
real estate brokers who are engaged with purchasing and moving houses and government
authorities who are included with controlling expenses (Kucukmehmetoglu & Geymen, 2008).
Methodology
Data for this study was retrieved from the following link
https://people.sc.fsu.edu/~jburkardt/datasets/regression/x26.txt. The data is a cross sectional data
with 28 observations and 10 variables. Both descriptive and inferential statistics were used to
analyze the relationship between the three variables. Pearson correlation test and regression
analysis model was performed to identify the strength and direction of relationship between the
variables.
For the regression analysis, we sought to estimate the following regression equation model;
B=β0 + β1 ( A 1 ) + β2 ( A 2 ) + β3 ( A 3 ) + β4 ( A 4 ) + β5 ( A 5 ) + β6 ( A 6 ) + β7 ( A 7 ) + β8 ( A 8 ) + β9 ( A 9 ) +ε
Where the variables are defined as follows;
Variable code Variable name
A1 The local selling prices, in hundreds of dollars
A2 The number of bathrooms
A3 The area of the site in thousands of square
feet
A4 The size of the living space in thousands of
square feet
A5 The number of garages
A6 The number of rooms
A7 The number of bedrooms
A8 The age in years
A9 Number of fire places
B Selling price
Where, β0 is the constant coefficient (Intercept coefficient), β1 is the coefficient for the first
independent variable (A1), β2 is the coefficient for the second independent variable (A2), β3 is
the coefficient for the third independent variable (A3), β4 is the coefficient for the forth
independent variable (A4), β5 is the coefficient for the fifth independent variable (A5), β6 is the
coefficient for the sixth independent variable (A6), β7 is the coefficient for the seventh
independent variable (A7), β8 is the coefficient for the eight independent variable (A8) and β9 is
the coefficient for the ninth independent variable (A9) and ε is the error term.
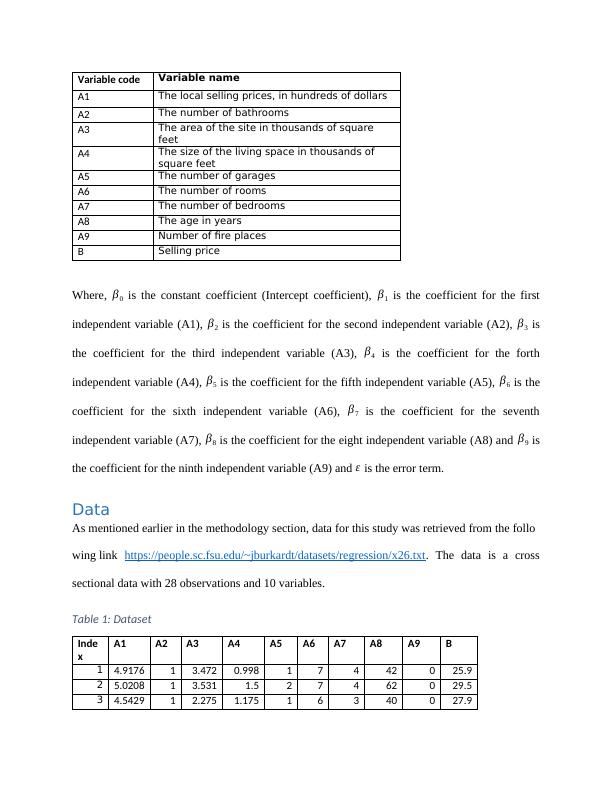
Data
As mentioned earlier in the methodology section, data for this study was retrieved from the follo
wing link https://people.sc.fsu.edu/~jburkardt/datasets/regression/x26.txt. The data is a cross
sectional data with 28 observations and 10 variables.
Table 1: Dataset
Inde
x
A1 A2 A3 A4 A5 A6 A7 A8 A9 B
1 4.9176 1 3.472 0.998 1 7 4 42 0 25.9
2 5.0208 1 3.531 1.5 2 7 4 62 0 29.5
3 4.5429 1 2.275 1.175 1 6 3 40 0 27.9
A1 The local selling prices, in hundreds of dollars
A2 The number of bathrooms
A3 The area of the site in thousands of square
feet
A4 The size of the living space in thousands of
square feet
A5 The number of garages
A6 The number of rooms
A7 The number of bedrooms
A8 The age in years
A9 Number of fire places
B Selling price
Where, β0 is the constant coefficient (Intercept coefficient), β1 is the coefficient for the first
independent variable (A1), β2 is the coefficient for the second independent variable (A2), β3 is
the coefficient for the third independent variable (A3), β4 is the coefficient for the forth
independent variable (A4), β5 is the coefficient for the fifth independent variable (A5), β6 is the
coefficient for the sixth independent variable (A6), β7 is the coefficient for the seventh
independent variable (A7), β8 is the coefficient for the eight independent variable (A8) and β9 is
the coefficient for the ninth independent variable (A9) and ε is the error term.
Data
As mentioned earlier in the methodology section, data for this study was retrieved from the follo
wing link https://people.sc.fsu.edu/~jburkardt/datasets/regression/x26.txt. The data is a cross
sectional data with 28 observations and 10 variables.
Table 1: Dataset
Inde
x
A1 A2 A3 A4 A5 A6 A7 A8 A9 B
1 4.9176 1 3.472 0.998 1 7 4 42 0 25.9
2 5.0208 1 3.531 1.5 2 7 4 62 0 29.5
3 4.5429 1 2.275 1.175 1 6 3 40 0 27.9
End of preview
Want to access all the pages? Upload your documents or become a member.
Related Documents
Regression Analysis for Price and Saleslg...
|13
|1581
|495
Factors Affecting Houses Price in Parramattalg...
|13
|2480
|69
Panama Canal Expansion Project | Reportlg...
|17
|1868
|21
Business Analytics and Big Data Research Paper PDF 2023lg...
|18
|2192
|21
Application of Multiple Linear Regression Model and Data Changeslg...
|12
|2374
|454
THE STATISTICAL ANALYSIS PROJECTlg...
|5
|881
|13