Predictive Analytics Project
VerifiedAdded on 2021/06/15
|7
|1034
|105
AI Summary
Contribute Materials
Your contribution can guide someone’s learning journey. Share your
documents today.

PREDICTIVE ANALYTICS
PROJECT
Student Name
[Pick the date]
PROJECT
Student Name
[Pick the date]
Secure Best Marks with AI Grader
Need help grading? Try our AI Grader for instant feedback on your assignments.
Part 1
1. The objective of this predictive analysis is to develop a model whereby the house price in
Minnesota can be predicted using various key variables such as size, number of bedrooms and
age. Using the sample data obtained in this regards, various statistical techniques have been
deployed in order to develop the above mentioned predictive model.
2. The dependent is shown below:
Dependent variable: House prices
3. The independent variables are highlighted below:
Independent variables: House size, Age, Number of bedrooms
Independent Variable
Summary of independent
variable
Categorical or
quantitative?
Argument for / description of the associates
with the dependent variable
House size Quantitative It is expected that house price should be directly
proportional to the house size
Age Quantitative It is expected that house price should be
inversely proportional to the house age
Number of bedrooms Quantitative
It is expected that house price should be directly
proportional to the number of bedrooms in the
house
Part 2
1. The scatter plot and regression equation for each of the case is highlighted below:
Candidate Independent variables
Independent
variable
Regression equation Screenshot of scatterplot
1
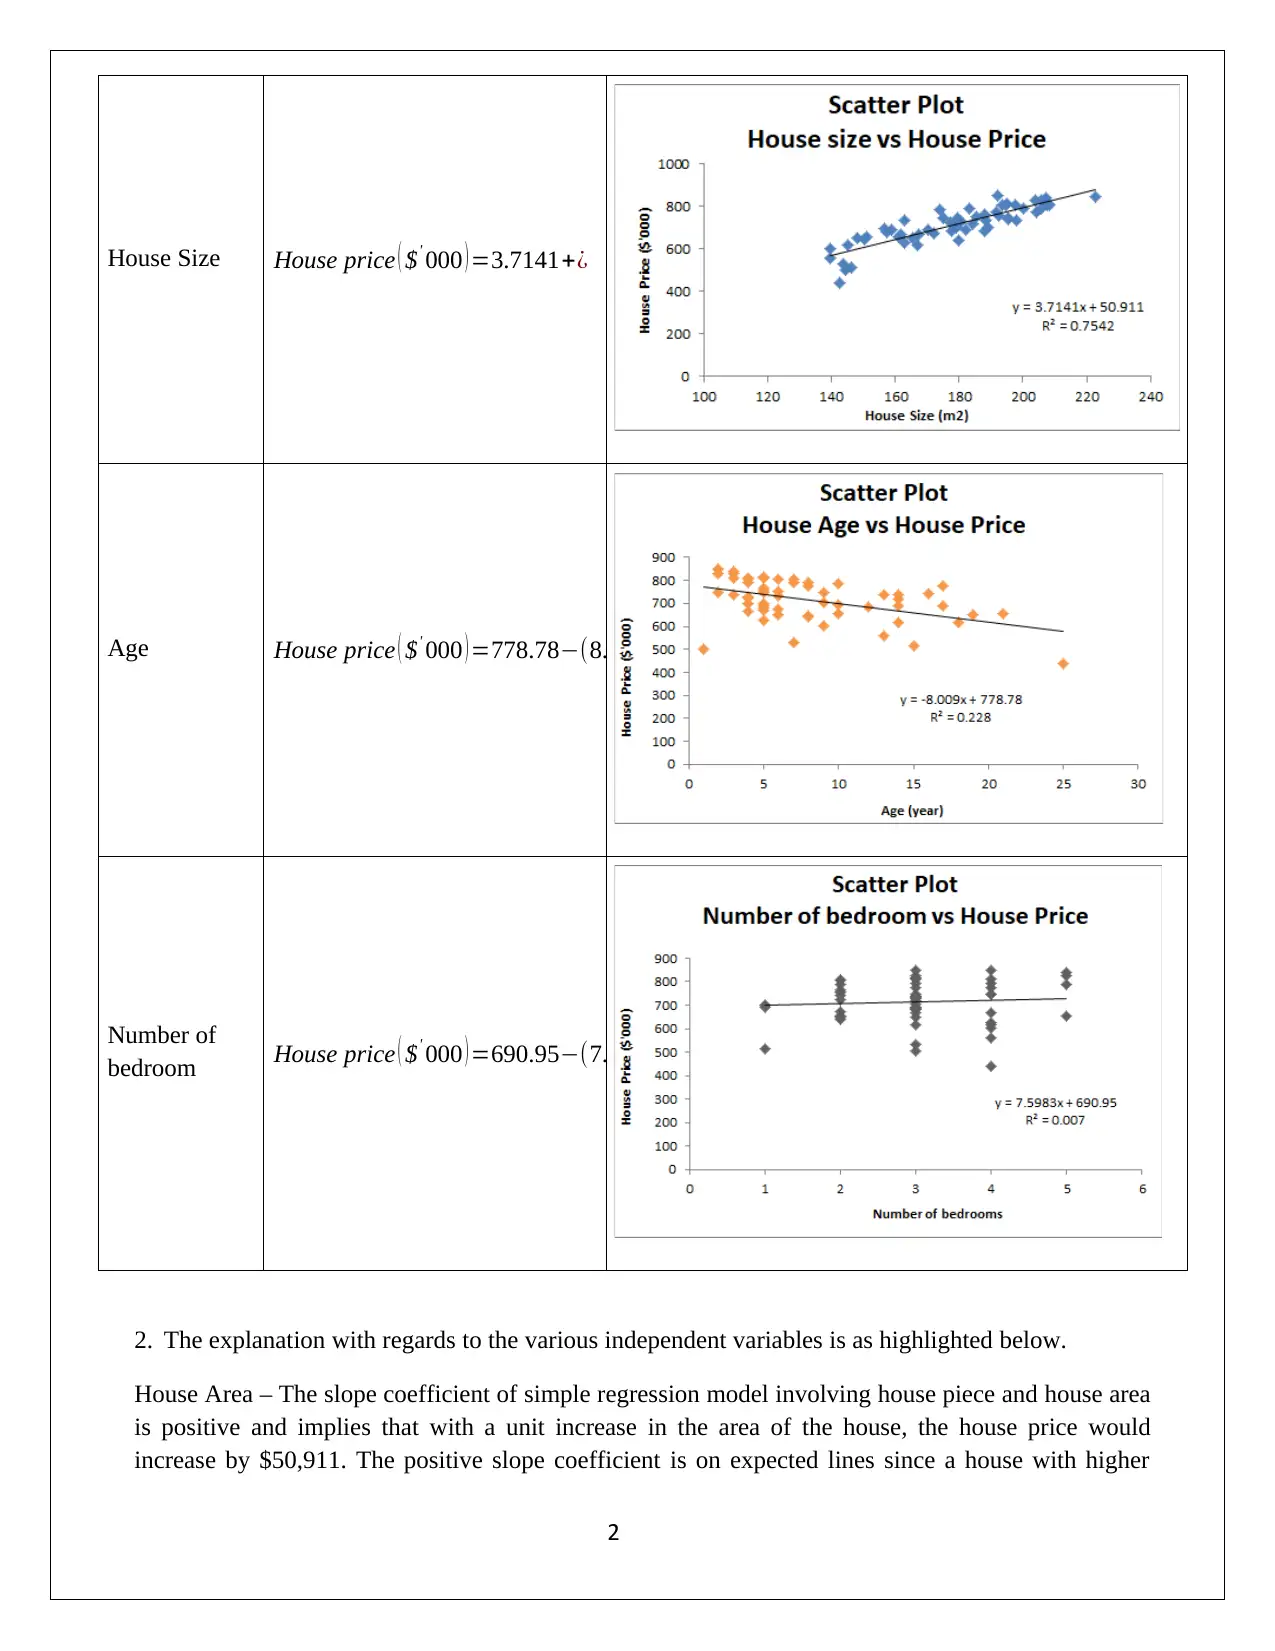
House Size House price ( $' 000 ) =3.7141+¿
Age House price ( $' 000 ) =778.78−(8.009∗Age)
Number of
bedroom House price ( $' 000 ) =690.95−(7.5983∗Number of bedrooms )
2. The explanation with regards to the various independent variables is as highlighted below.
House Area – The slope coefficient of simple regression model involving house piece and house area
is positive and implies that with a unit increase in the area of the house, the house price would
increase by $50,911. The positive slope coefficient is on expected lines since a house with higher
2
area would have a higher price as well. However, the magnitude of change seems to be on the higher
side.
House Age - The slope coefficient of simple regression model involving house piece and house age is
negative and implies that with a unit increase in the age of the house, the house price would decrease
by $8,009. The negative sign of the age slope coefficient is expected considering that as the age of
the house increases, there is wear and tear due to which depreciation must be charged and the house
value decreases. Also, the potential cost of repairs and maintenance may also increase with age of the
house.
Number of bedrooms - The slope coefficient of simple regression model involving house piece and
house age is negative and implies that as the number of bedroom increases by one, the house price
tends to decrease by $7,598. This is rather surprising as this coefficient was expected to be positive
owing to some overlapping with the house area. However, it seems that too much bedrooms in the
house cut result in higher distribution of area which may result in smaller rooms and hence a negative
coefficient.
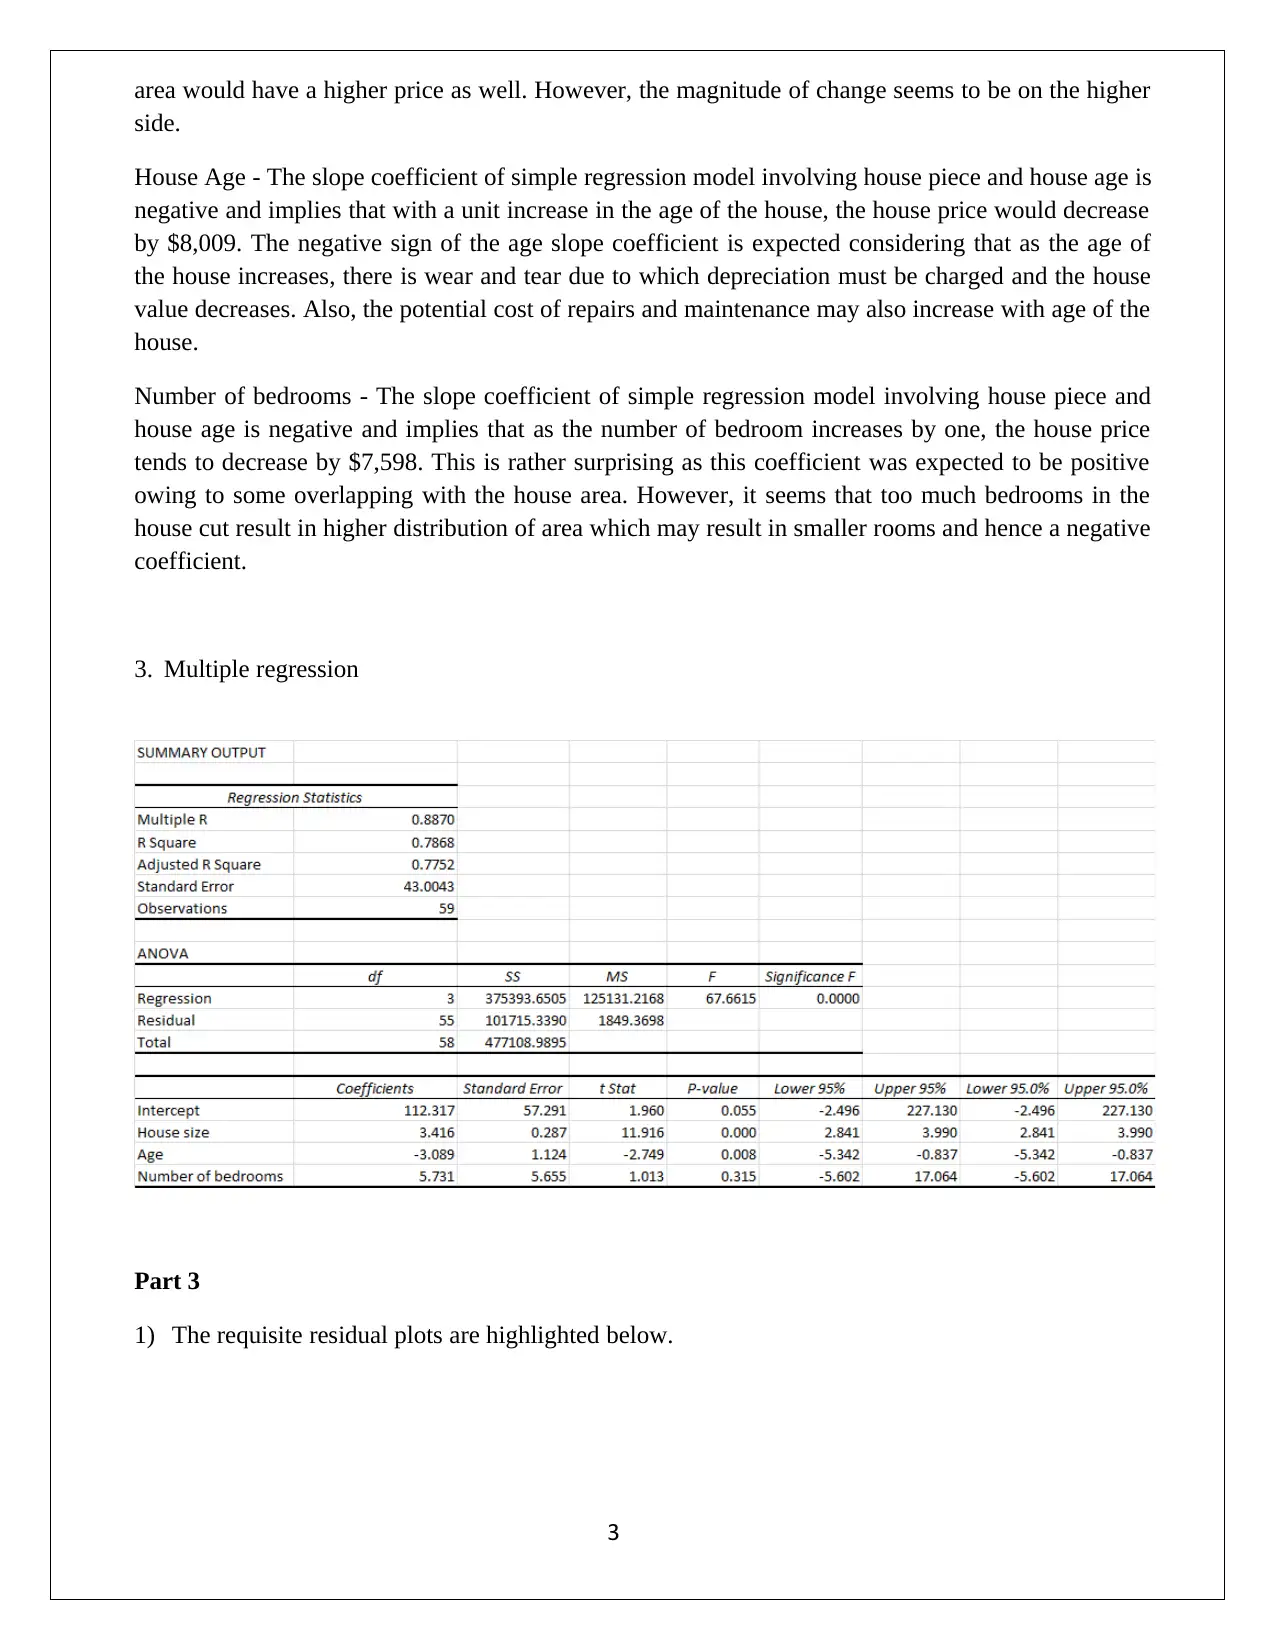
3. Multiple regression
Part 3
1) The requisite residual plots are highlighted below.
3
side.
House Age - The slope coefficient of simple regression model involving house piece and house age is
negative and implies that with a unit increase in the age of the house, the house price would decrease
by $8,009. The negative sign of the age slope coefficient is expected considering that as the age of
the house increases, there is wear and tear due to which depreciation must be charged and the house
value decreases. Also, the potential cost of repairs and maintenance may also increase with age of the
house.
Number of bedrooms - The slope coefficient of simple regression model involving house piece and
house age is negative and implies that as the number of bedroom increases by one, the house price
tends to decrease by $7,598. This is rather surprising as this coefficient was expected to be positive
owing to some overlapping with the house area. However, it seems that too much bedrooms in the
house cut result in higher distribution of area which may result in smaller rooms and hence a negative
coefficient.
3. Multiple regression
Part 3
1) The requisite residual plots are highlighted below.
3
Secure Best Marks with AI Grader
Need help grading? Try our AI Grader for instant feedback on your assignments.
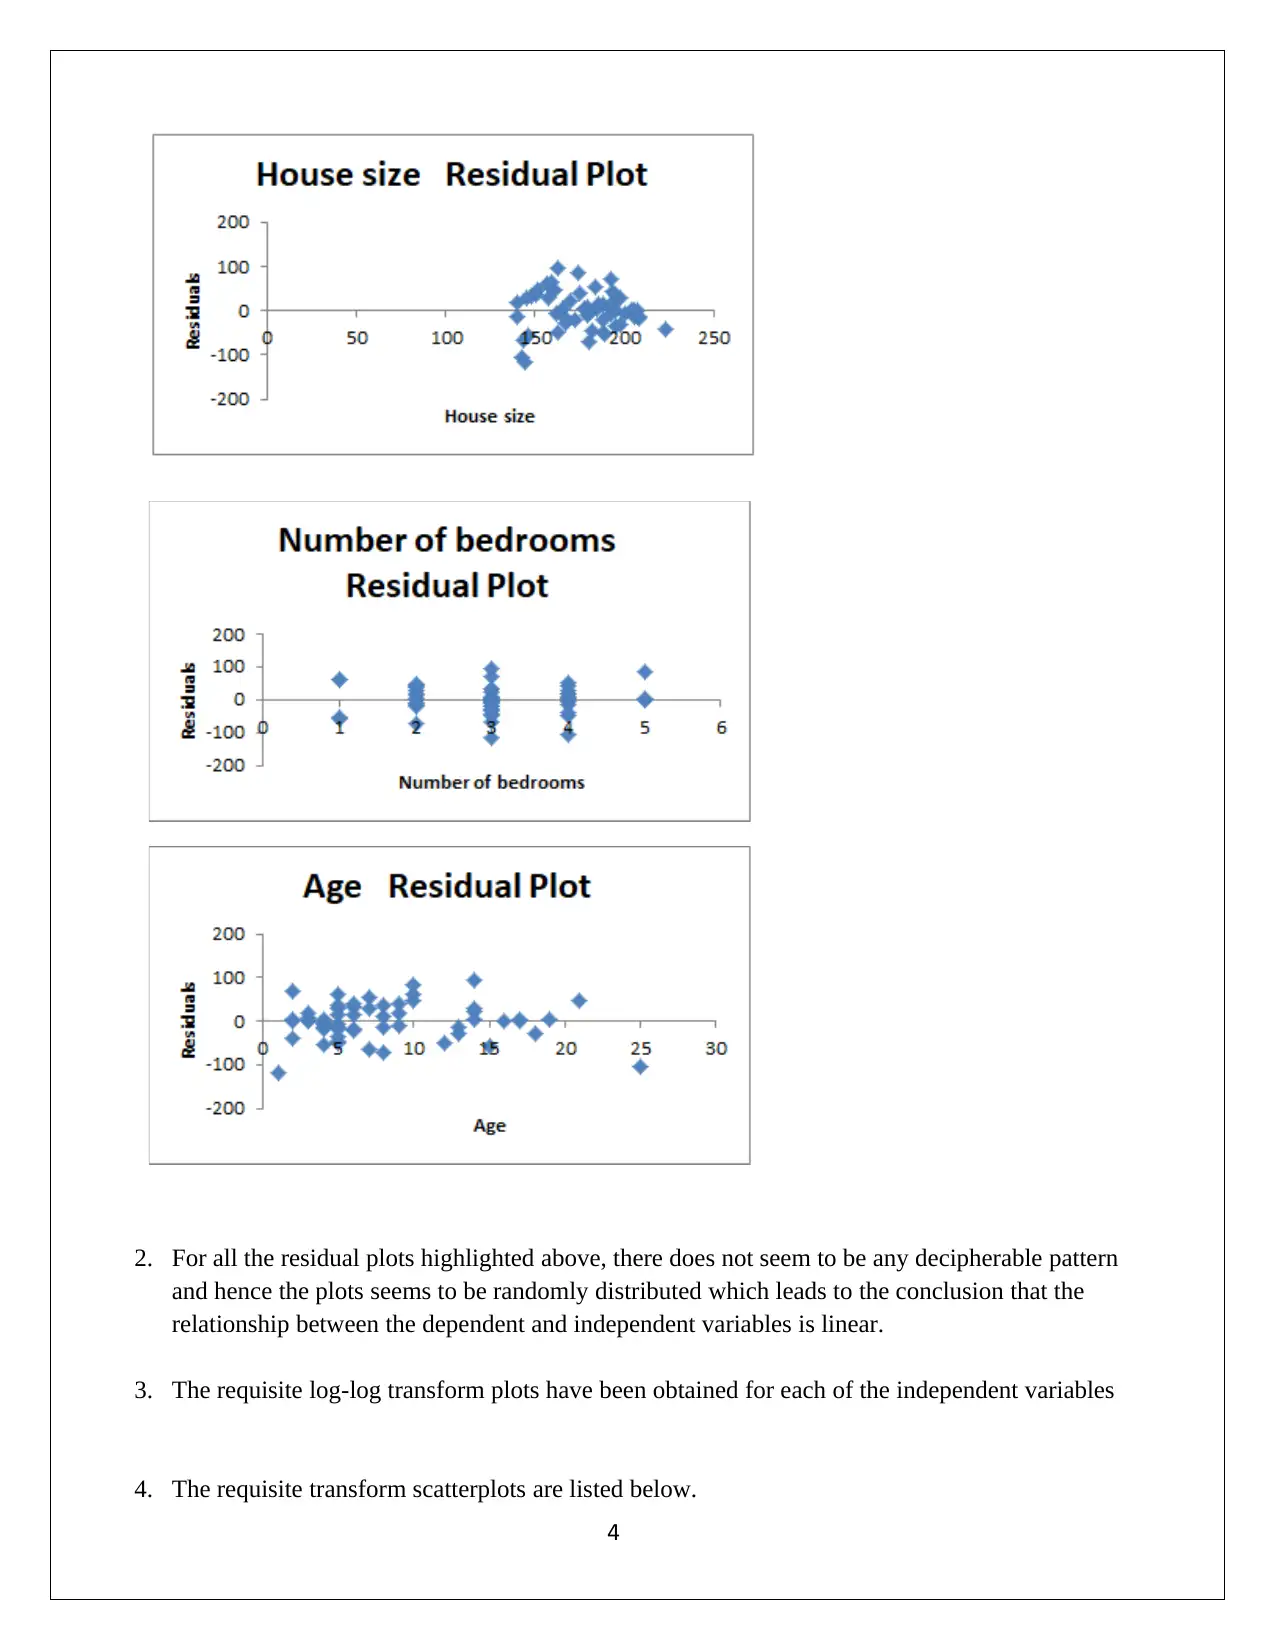
2. For all the residual plots highlighted above, there does not seem to be any decipherable pattern
and hence the plots seems to be randomly distributed which leads to the conclusion that the
relationship between the dependent and independent variables is linear.
3. The requisite log-log transform plots have been obtained for each of the independent variables
4. The requisite transform scatterplots are listed below.
4
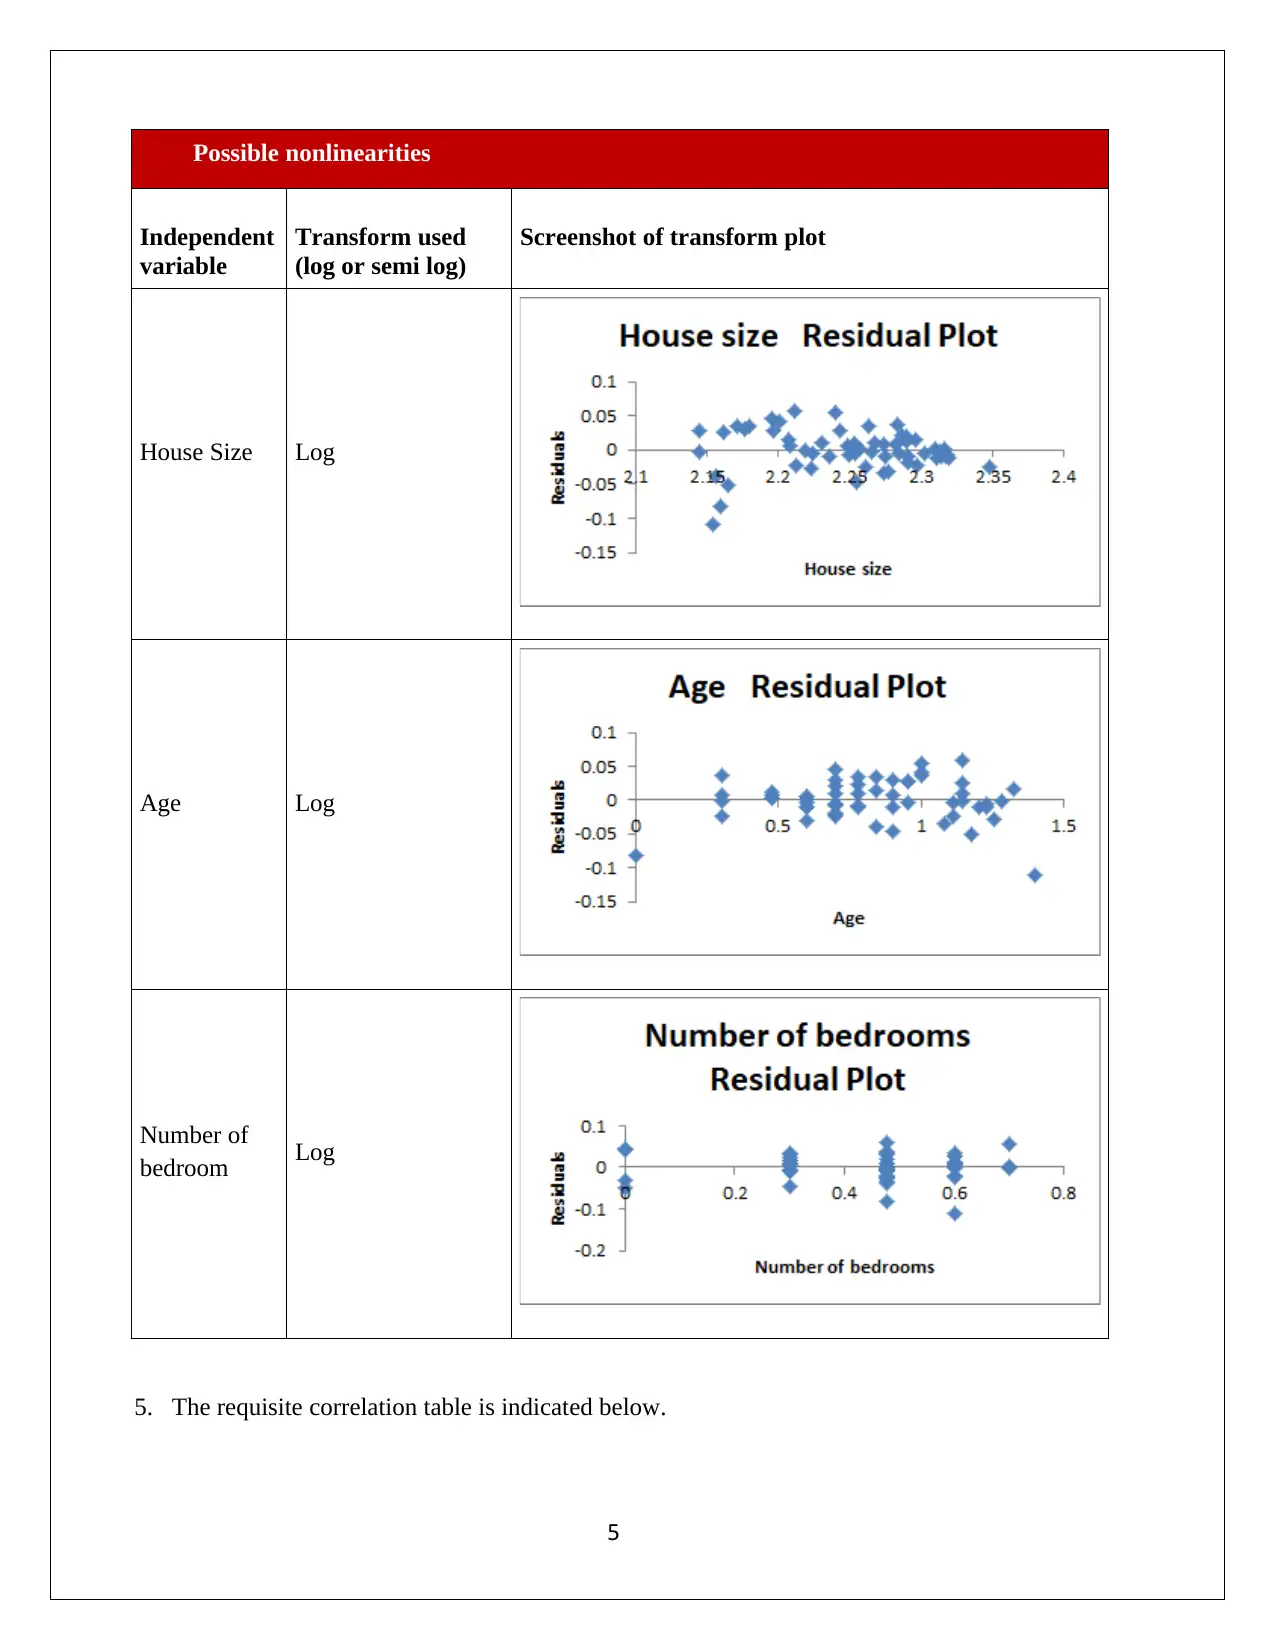
Possible nonlinearities
Independent
variable
Transform used
(log or semi log)
Screenshot of transform plot
House Size Log
Age Log
Number of
bedroom Log
5. The requisite correlation table is indicated below.
5
Independent
variable
Transform used
(log or semi log)
Screenshot of transform plot
House Size Log
Age Log
Number of
bedroom Log
5. The requisite correlation table is indicated below.
5
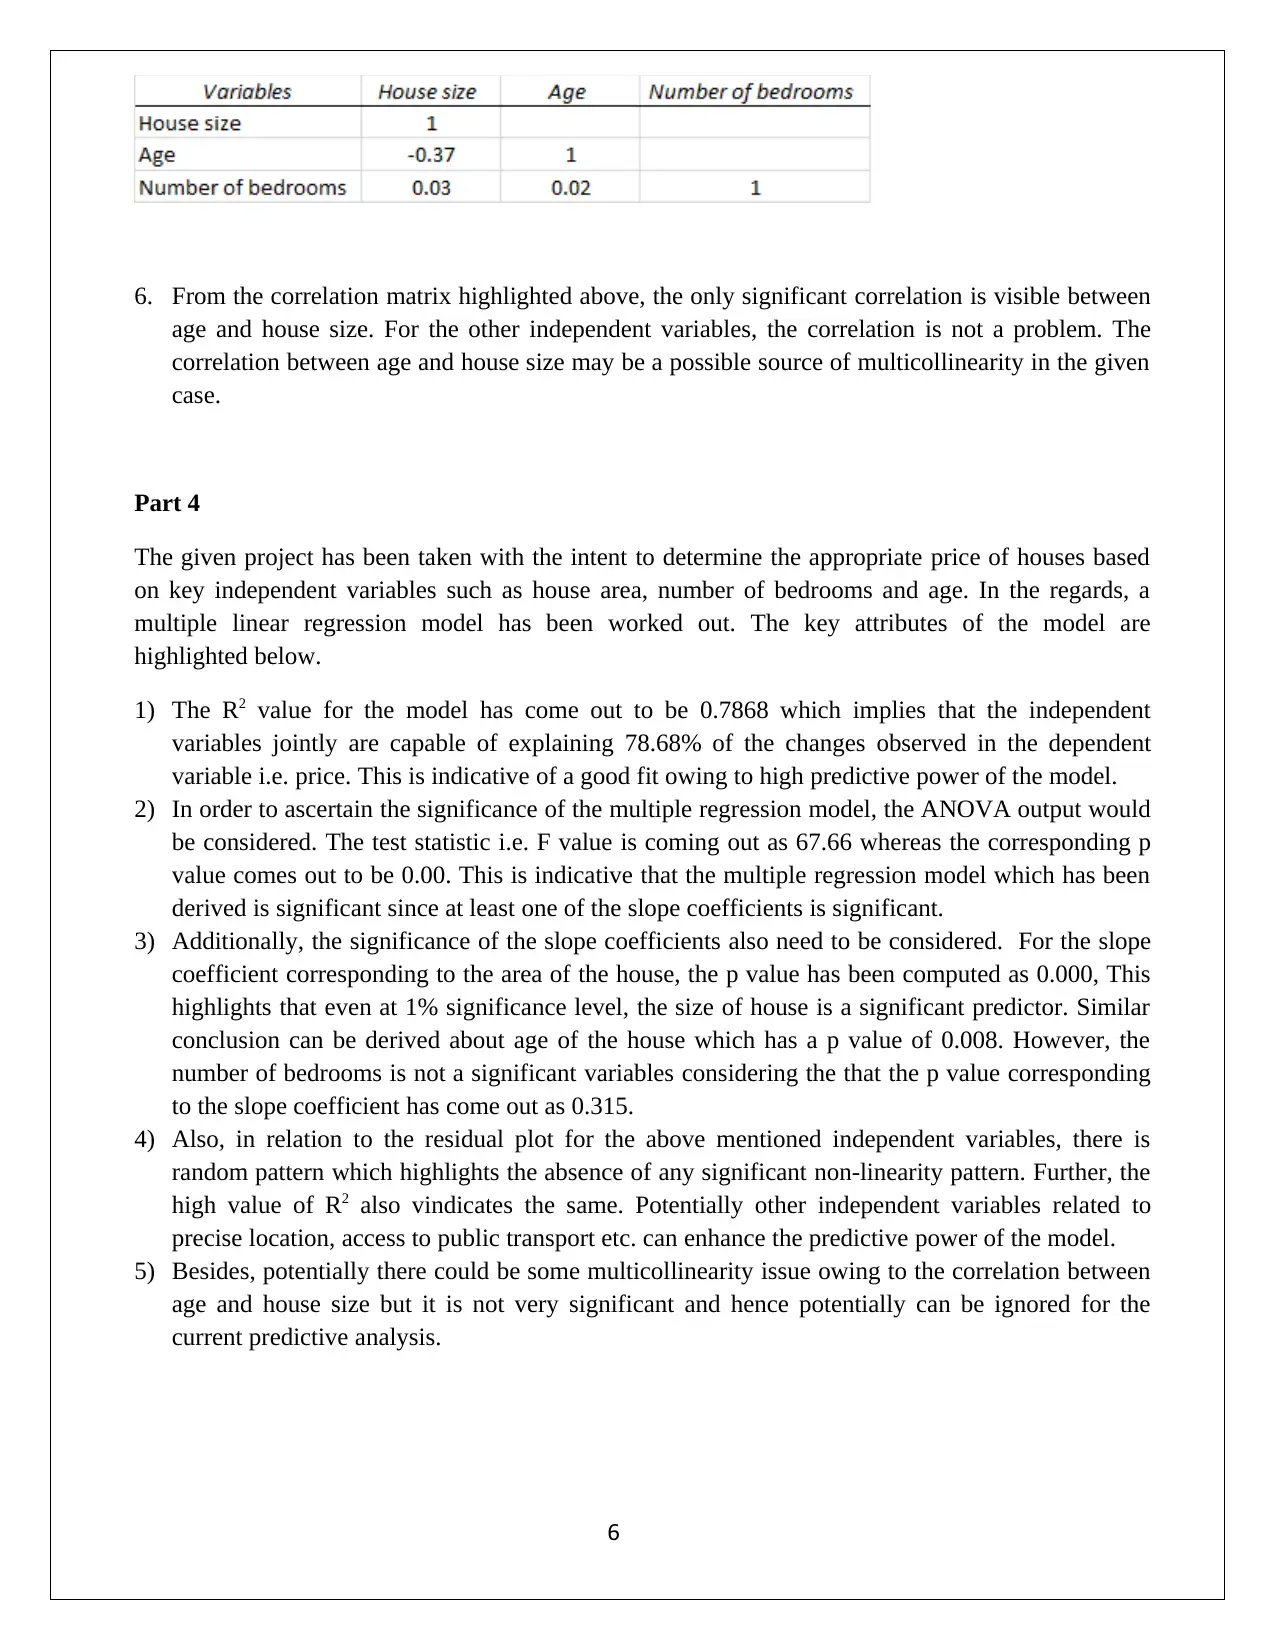
6. From the correlation matrix highlighted above, the only significant correlation is visible between
age and house size. For the other independent variables, the correlation is not a problem. The
correlation between age and house size may be a possible source of multicollinearity in the given
case.
Part 4
The given project has been taken with the intent to determine the appropriate price of houses based
on key independent variables such as house area, number of bedrooms and age. In the regards, a
multiple linear regression model has been worked out. The key attributes of the model are
highlighted below.
1) The R2 value for the model has come out to be 0.7868 which implies that the independent
variables jointly are capable of explaining 78.68% of the changes observed in the dependent
variable i.e. price. This is indicative of a good fit owing to high predictive power of the model.
2) In order to ascertain the significance of the multiple regression model, the ANOVA output would
be considered. The test statistic i.e. F value is coming out as 67.66 whereas the corresponding p
value comes out to be 0.00. This is indicative that the multiple regression model which has been
derived is significant since at least one of the slope coefficients is significant.
3) Additionally, the significance of the slope coefficients also need to be considered. For the slope
coefficient corresponding to the area of the house, the p value has been computed as 0.000, This
highlights that even at 1% significance level, the size of house is a significant predictor. Similar
conclusion can be derived about age of the house which has a p value of 0.008. However, the
number of bedrooms is not a significant variables considering the that the p value corresponding
to the slope coefficient has come out as 0.315.
4) Also, in relation to the residual plot for the above mentioned independent variables, there is
random pattern which highlights the absence of any significant non-linearity pattern. Further, the
high value of R2 also vindicates the same. Potentially other independent variables related to
precise location, access to public transport etc. can enhance the predictive power of the model.
5) Besides, potentially there could be some multicollinearity issue owing to the correlation between
age and house size but it is not very significant and hence potentially can be ignored for the
current predictive analysis.
6
1 out of 7
Related Documents


Your All-in-One AI-Powered Toolkit for Academic Success.
+13062052269
info@desklib.com
Available 24*7 on WhatsApp / Email
![[object Object]](/_next/static/media/star-bottom.7253800d.svg)
Unlock your academic potential
© 2024 | Zucol Services PVT LTD | All rights reserved.