Predictive Demand Analysis
Added on 2022-12-15
13 Pages1536 Words157 Views
Running head: PREDICTIVE DEMAND ANALYSIS
Predictive Demand Analysis
Name of the Student
Name of the University
Course ID
Predictive Demand Analysis
Name of the Student
Name of the University
Course ID

PREDICTIVE DEMAND ANALYSIS1
Table of Contents
Task 1...............................................................................................................................................2
Task 2...............................................................................................................................................2
Bivariate regression between Y and X1.......................................................................................2
Bivariate regression between Y and X2.......................................................................................4
Bivariate regression between Y and X3.......................................................................................5
Bivariate regression between Y and X4.......................................................................................6
Task 3...............................................................................................................................................7
Model 1........................................................................................................................................7
Model 2........................................................................................................................................8
Model 3........................................................................................................................................9
Task 4.............................................................................................................................................10
References......................................................................................................................................12
PREDICTIVE DEMAND ANALYSIS2
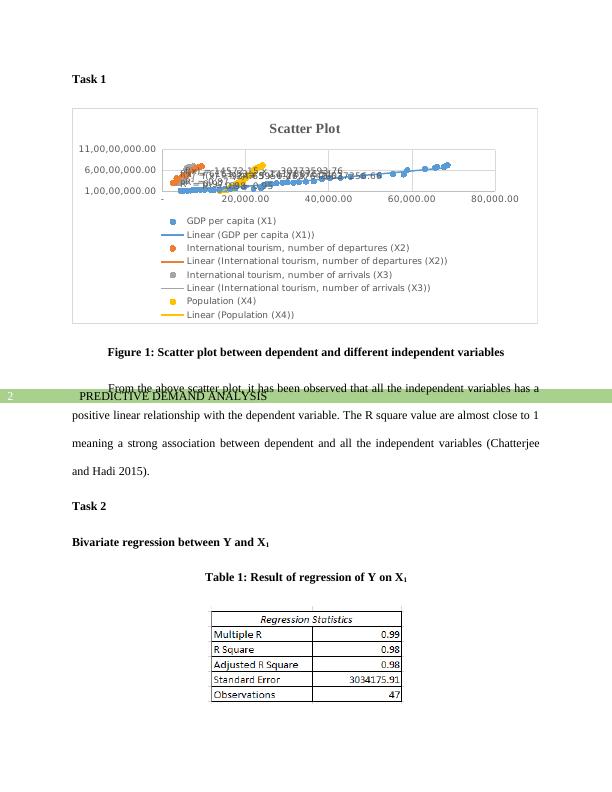
Task 1
- 20,000.00 40,000.00 60,000.00 80,000.00
1,00,00,000.00
6,00,00,000.00
11,00,00,000.00
f(x) = 5950.47 x − 76037256.66
R² = 0.95
f(x) = 14572.15 x − 30773593.76
R² = 0.87
f(x) = 6161.53 x + 14178876.51
R² = 0.97
f(x) = 934.65 x + 2627643.52
R² = 0.98
Scatter Plot
GDP per capita (X1)
Linear (GDP per capita (X1))
International tourism, number of departures (X2)
Linear (International tourism, number of departures (X2))
International tourism, number of arrivals (X3)
Linear (International tourism, number of arrivals (X3))
Population (X4)
Linear (Population (X4))
Figure 1: Scatter plot between dependent and different independent variables
From the above scatter plot, it has been observed that all the independent variables has a
positive linear relationship with the dependent variable. The R square value are almost close to 1
meaning a strong association between dependent and all the independent variables (Chatterjee
and Hadi 2015).
Task 2
Bivariate regression between Y and X1
Table 1: Result of regression of Y on X1
PREDICTIVE DEMAND ANALYSIS3
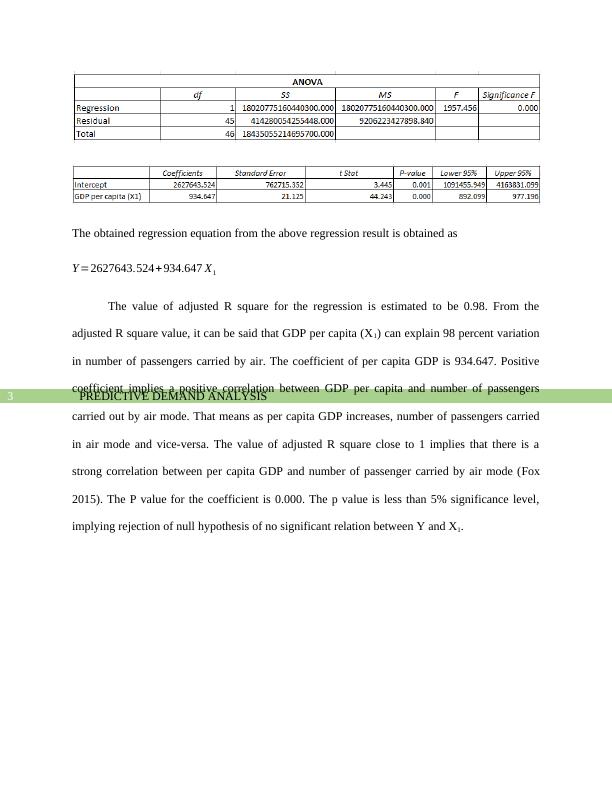
The obtained regression equation from the above regression result is obtained as
Y =2627643.524+ 934.647 X1
The value of adjusted R square for the regression is estimated to be 0.98. From the
adjusted R square value, it can be said that GDP per capita (X1) can explain 98 percent variation
in number of passengers carried by air. The coefficient of per capita GDP is 934.647. Positive
coefficient implies a positive correlation between GDP per capita and number of passengers
carried out by air mode. That means as per capita GDP increases, number of passengers carried
in air mode and vice-versa. The value of adjusted R square close to 1 implies that there is a
strong correlation between per capita GDP and number of passenger carried by air mode (Fox
2015). The P value for the coefficient is 0.000. The p value is less than 5% significance level,
implying rejection of null hypothesis of no significant relation between Y and X1.
End of preview
Want to access all the pages? Upload your documents or become a member.
Related Documents
Transport Economics - Desklib Online Librarylg...
|17
|2721
|299
Understanding Regression Terminology and Simple/Multiple Linear Regressionlg...
|6
|796
|151
Interpretation of Error Measures and Correlationlg...
|5
|647
|58
Statistics - Correlation and Regression Analysislg...
|10
|975
|17
Assignment on econometrics PDFlg...
|28
|4390
|481
Tutor-marked Exercise 4: Computer Sectionlg...
|33
|801
|100