Probability, Research Question, Statistical Decision Making and Quality Control
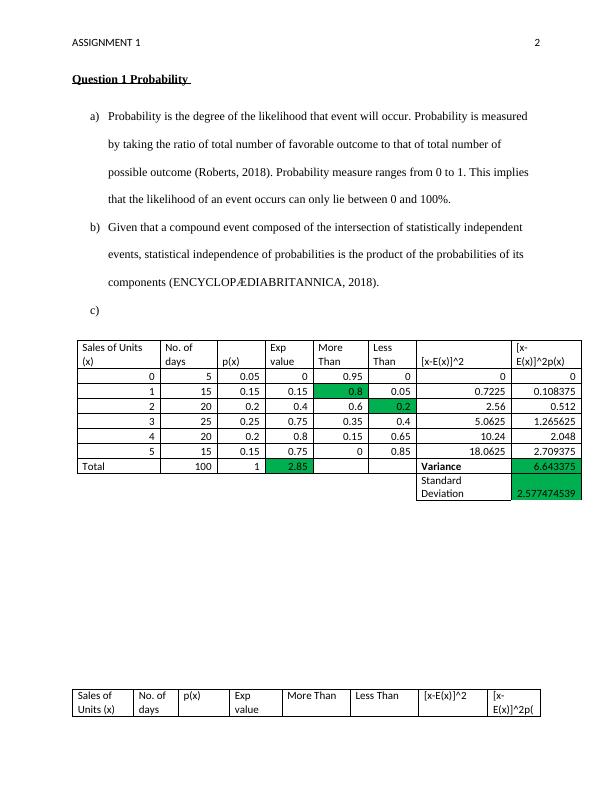
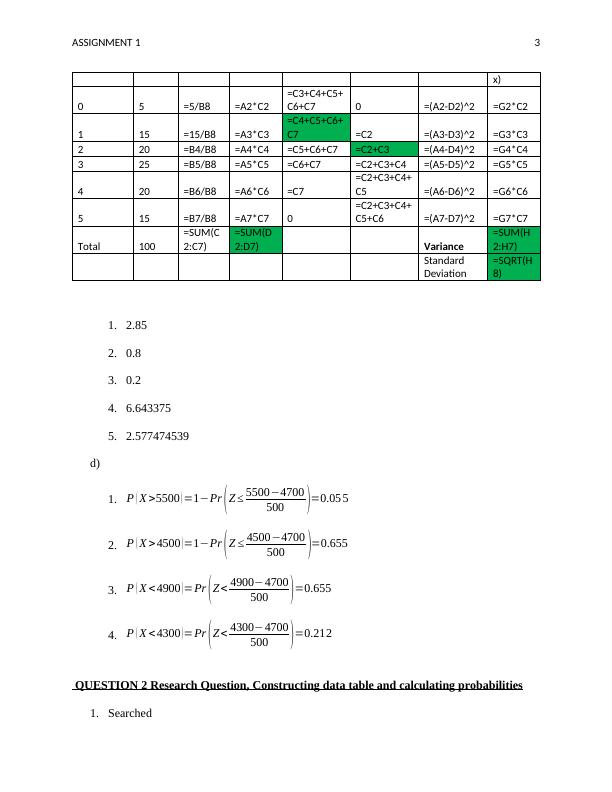
Define probability and its measurement, explain statistical independence, and complete missing figures in an Excel table for variance calculations.
9 Pages1113 Words117 Views
Added on 2023-06-09
About This Document
This assignment covers topics like probability, research question, statistical decision making and quality control. It includes examples, formulas and calculations.
Probability, Research Question, Statistical Decision Making and Quality Control
Define probability and its measurement, explain statistical independence, and complete missing figures in an Excel table for variance calculations.
Added on 2023-06-09
ShareRelated Documents

End of preview
Want to access all the pages? Upload your documents or become a member.
Probability, Statistical Independence, Population Structure and Confidence Interval
|9
|950
|236
Accounting Decision Support Tools
|10
|1397
|275
Decision Support Tools: Exploring Expected Value, Sales Analysis, and Probability Calculations
|9
|1175
|86
Probability and Expected Value
|6
|679
|180
Accounting and Decision Support Tools
|11
|1512
|308
Probability Statistics - Desklib
|8
|986
|346