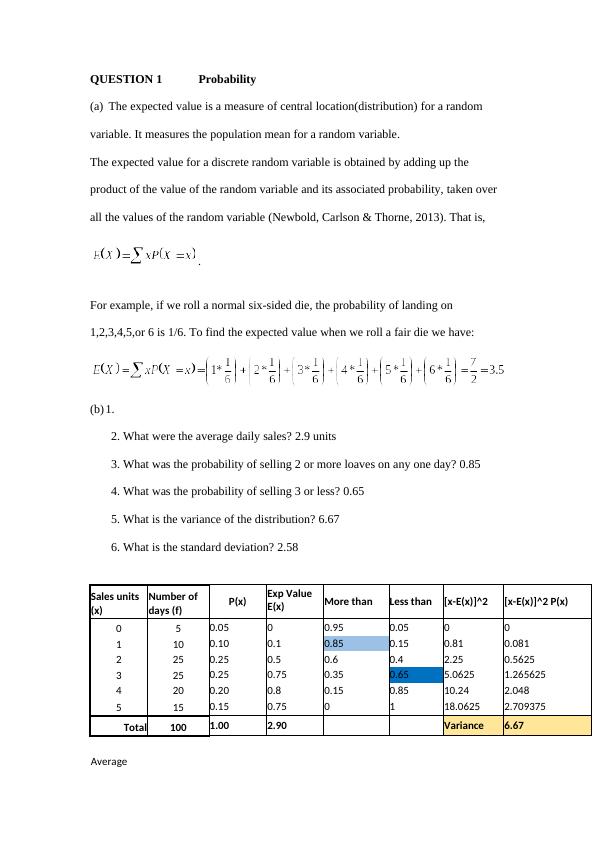
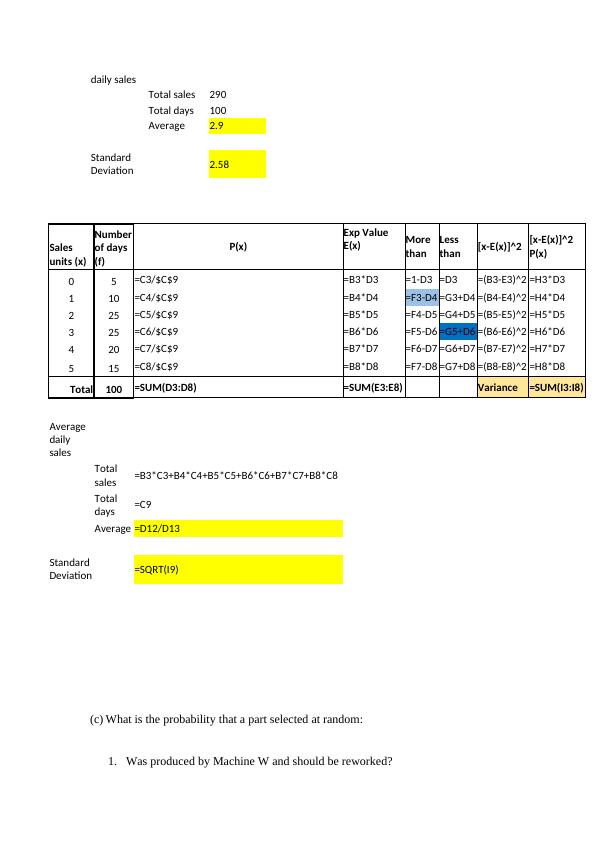
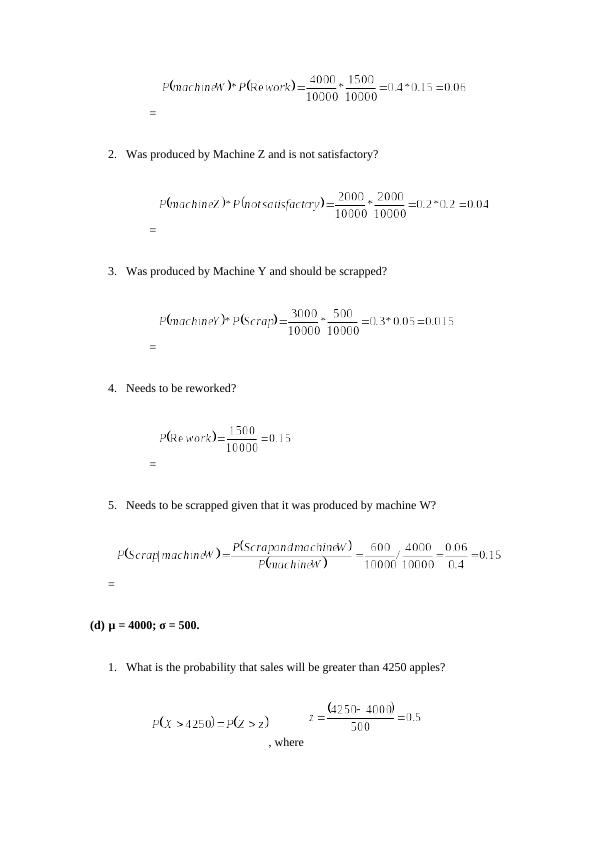
Probability and Expected Value
Added on 2023-04-08
6 Pages679 Words180 Views
End of preview
Want to access all the pages? Upload your documents or become a member.
Accounting and Decision Support Tools
|11
|1512
|308
Accounting Decision Support Tools
|10
|1397
|275
Probability, Research Question, Statistical Decision Making and Quality Control
|9
|1113
|117
Probability, Statistical Independence, Population Structure and Confidence Interval
|9
|950
|236
Accounting Systems & Process | Report
|33
|2159
|64
Blash Script file Information 2022
|5
|815
|17