logo

Exploratory Data Analysis and Factorial ANOVA

This assignment involves utilizing an existing dataset to compute a factorial ANOVA and creating a hypothetical ANCOVA output table.

11 Pages1959 Words216 Views
   

Added on  2023-04-08

About This Document

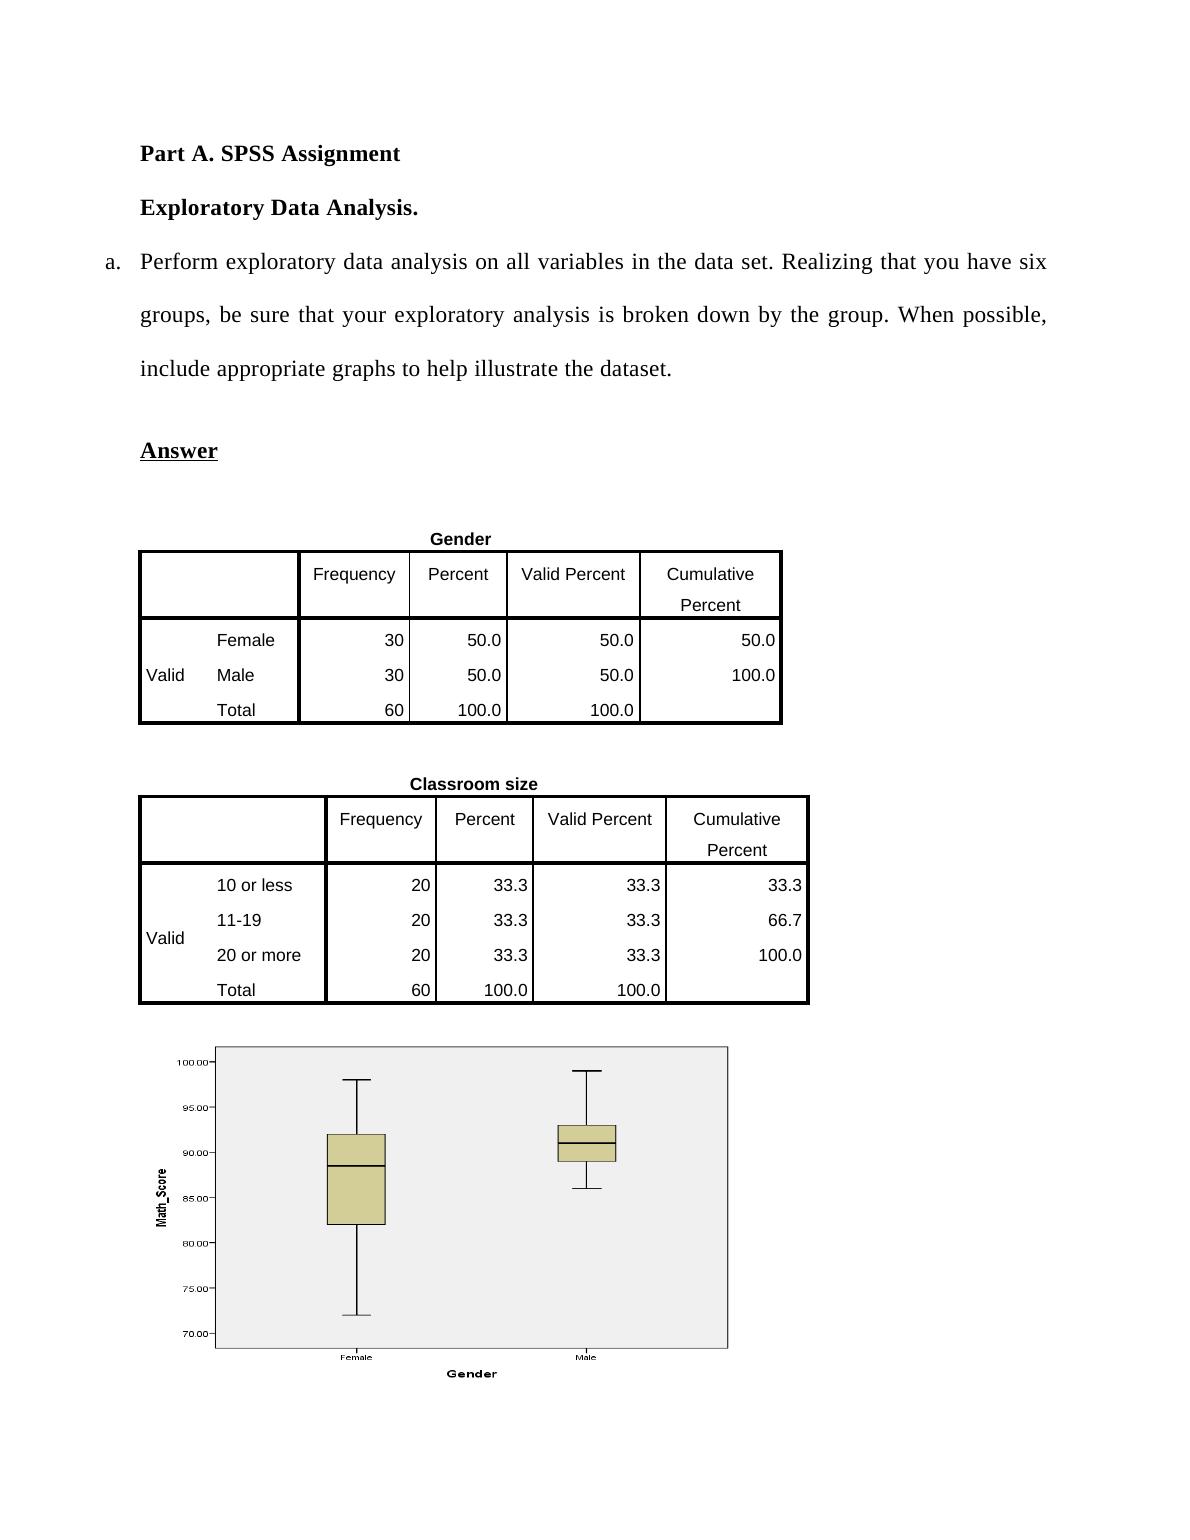
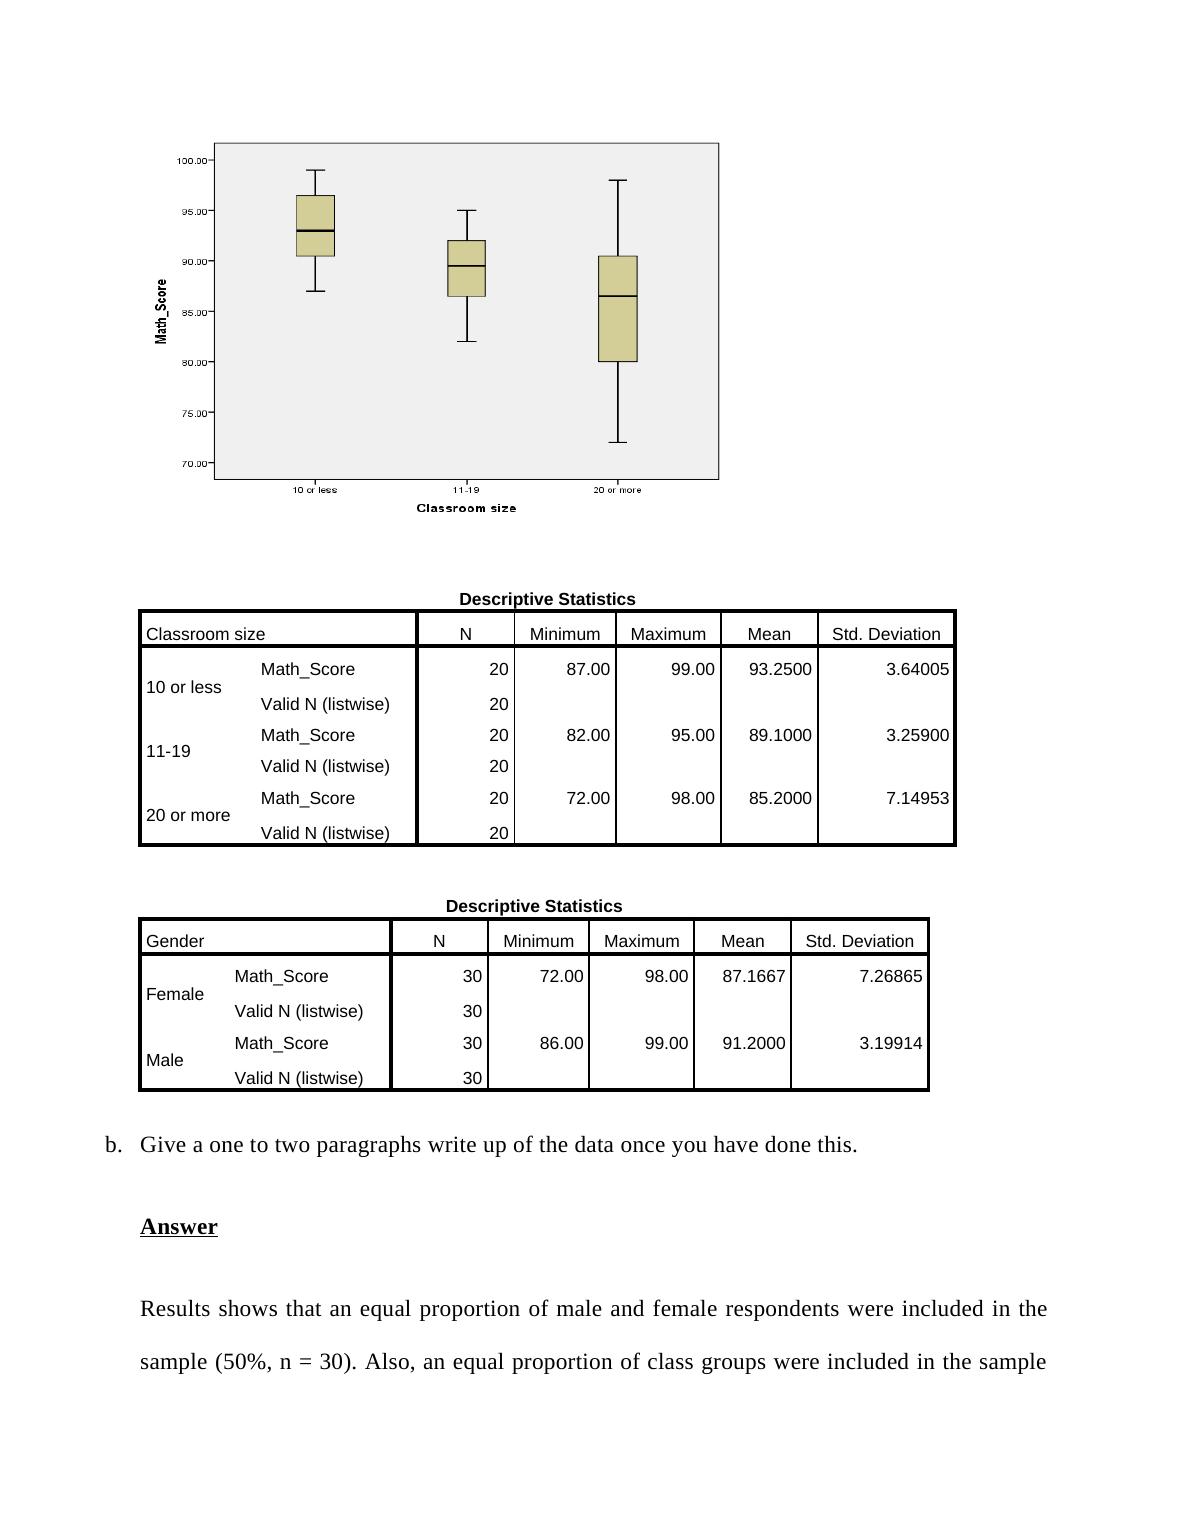
This document provides a step-by-step guide on performing exploratory data analysis and factorial ANOVA using SPSS. It includes descriptive statistics, main effects of gender and classroom size, interaction effects, and interpretation of the results.

Exploratory Data Analysis and Factorial ANOVA

This assignment involves utilizing an existing dataset to compute a factorial ANOVA and creating a hypothetical ANCOVA output table.

   Added on 2023-04-08

ShareRelated Documents
Problem Analysis and Statistics
Name:
Institution:
20th March 2019
Exploratory Data Analysis and Factorial ANOVA_1
Part A. SPSS Assignment
Exploratory Data Analysis.
a. Perform exploratory data analysis on all variables in the data set. Realizing that you have six
groups, be sure that your exploratory analysis is broken down by the group. When possible,
include appropriate graphs to help illustrate the dataset.
Answer
Gender
Frequency Percent Valid Percent Cumulative
Percent
Valid
Female 30 50.0 50.0 50.0
Male 30 50.0 50.0 100.0
Total 60 100.0 100.0
Classroom size
Frequency Percent Valid Percent Cumulative
Percent
Valid
10 or less 20 33.3 33.3 33.3
11-19 20 33.3 33.3 66.7
20 or more 20 33.3 33.3 100.0
Total 60 100.0 100.0
Exploratory Data Analysis and Factorial ANOVA_2
Descriptive Statistics
Classroom size N Minimum Maximum Mean Std. Deviation
10 or less Math_Score 20 87.00 99.00 93.2500 3.64005
Valid N (listwise) 20
11-19 Math_Score 20 82.00 95.00 89.1000 3.25900
Valid N (listwise) 20
20 or more Math_Score 20 72.00 98.00 85.2000 7.14953
Valid N (listwise) 20
Descriptive Statistics
Gender N Minimum Maximum Mean Std. Deviation
Female Math_Score 30 72.00 98.00 87.1667 7.26865
Valid N (listwise) 30
Male Math_Score 30 86.00 99.00 91.2000 3.19914
Valid N (listwise) 30
b. Give a one to two paragraphs write up of the data once you have done this.
Answer
Results shows that an equal proportion of male and female respondents were included in the
sample (50%, n = 30). Also, an equal proportion of class groups were included in the sample
Exploratory Data Analysis and Factorial ANOVA_3
(33.3%, n = 20). The average math score for the male respondents were found to have a
higher mean score (M = 91.20, SD = 3.20) as compared to the average score of the female
respondents (M = 87.17, SD = 7.27).
c. Create an APA style table that presents descriptive statistics for the sample.
Answer
A descriptive analysis was performed to explore the data before performing inferential
analysis. Results shows that an equal proportion of male and female respondents were
included in the sample (50%, n = 30). Also, an equal proportion of class groups were included
in the sample (33.3%, n = 20). In terms of average score in math scores, male respondents
were found to have a higher mean score (M = 91.20, SD = 3.20) as compared to the average
score of the female respondents (M = 87.17, SD = 7.27).
In terms of the classroom size, classes with small number of students had on average larger mean
as compared to those with large number of students. For instance, the average scores in math
exam for classes with 10 or less was 93.25 (SD = 3.64), the average was 89.10 (SD = 3.26) for a
classroom of 11-19 and lastly the average was 85.20 (SD = 7.15) for a classroom of 20 or more.
Exploratory Data Analysis and Factorial ANOVA_4

End of preview

Want to access all the pages? Upload your documents or become a member.

Related Documents
Gender of the Respondents | Docx
|6
|725
|132

Data Analysis (SPSS)
|8
|515
|456

Preliminary Analyses: Descriptive Statistics and Frequency Distribution
|32
|6283
|306

Data Handling and Business Intelligence - Analysis of Ice Cream Flavour Preferences among High School Students
|13
|1835
|99

Psychology Assignment | Quality of Life
|16
|2771
|72

Business Research and Decision Making Student Name: 27th November 2018 Course Number: 27th November 2018
|6
|965
|268