Gantt Chart for Library Information System
VerifiedAdded on 2020/02/19
|11
|2135
|69
AI Summary
This assignment focuses on developing a Gantt chart for a Library Information System (BILBIO) project. It details the project's extensive scope, involving over 50 activities, and emphasizes the use of project management software to efficiently manage tasks and resources. The Gantt chart visually represents the timeline, task dependencies, and human resource allocation for each activity. The assignment concludes by highlighting the benefits of using a Gantt chart for effective project management.
Contribute Materials
Your contribution can guide someone’s learning journey. Share your
documents today.
Running head: PROJECT GANTT CHART
Project Gantt chart: A Case Study of Implementing IS at
BilbioZ
Name of the Student
Name of the University
Project Gantt chart: A Case Study of Implementing IS at
BilbioZ
Name of the Student
Name of the University
Secure Best Marks with AI Grader
Need help grading? Try our AI Grader for instant feedback on your assignments.
1PROJECT GANTT CHART
Table of Contents
1. Introduction:................................................................................................................................2
2. Gantt Chart of Information System Implementation at BiblioZ:.................................................3
3. Conclusion:..................................................................................................................................8
Bibliography:...................................................................................................................................9
2PROJECT GANTT CHART
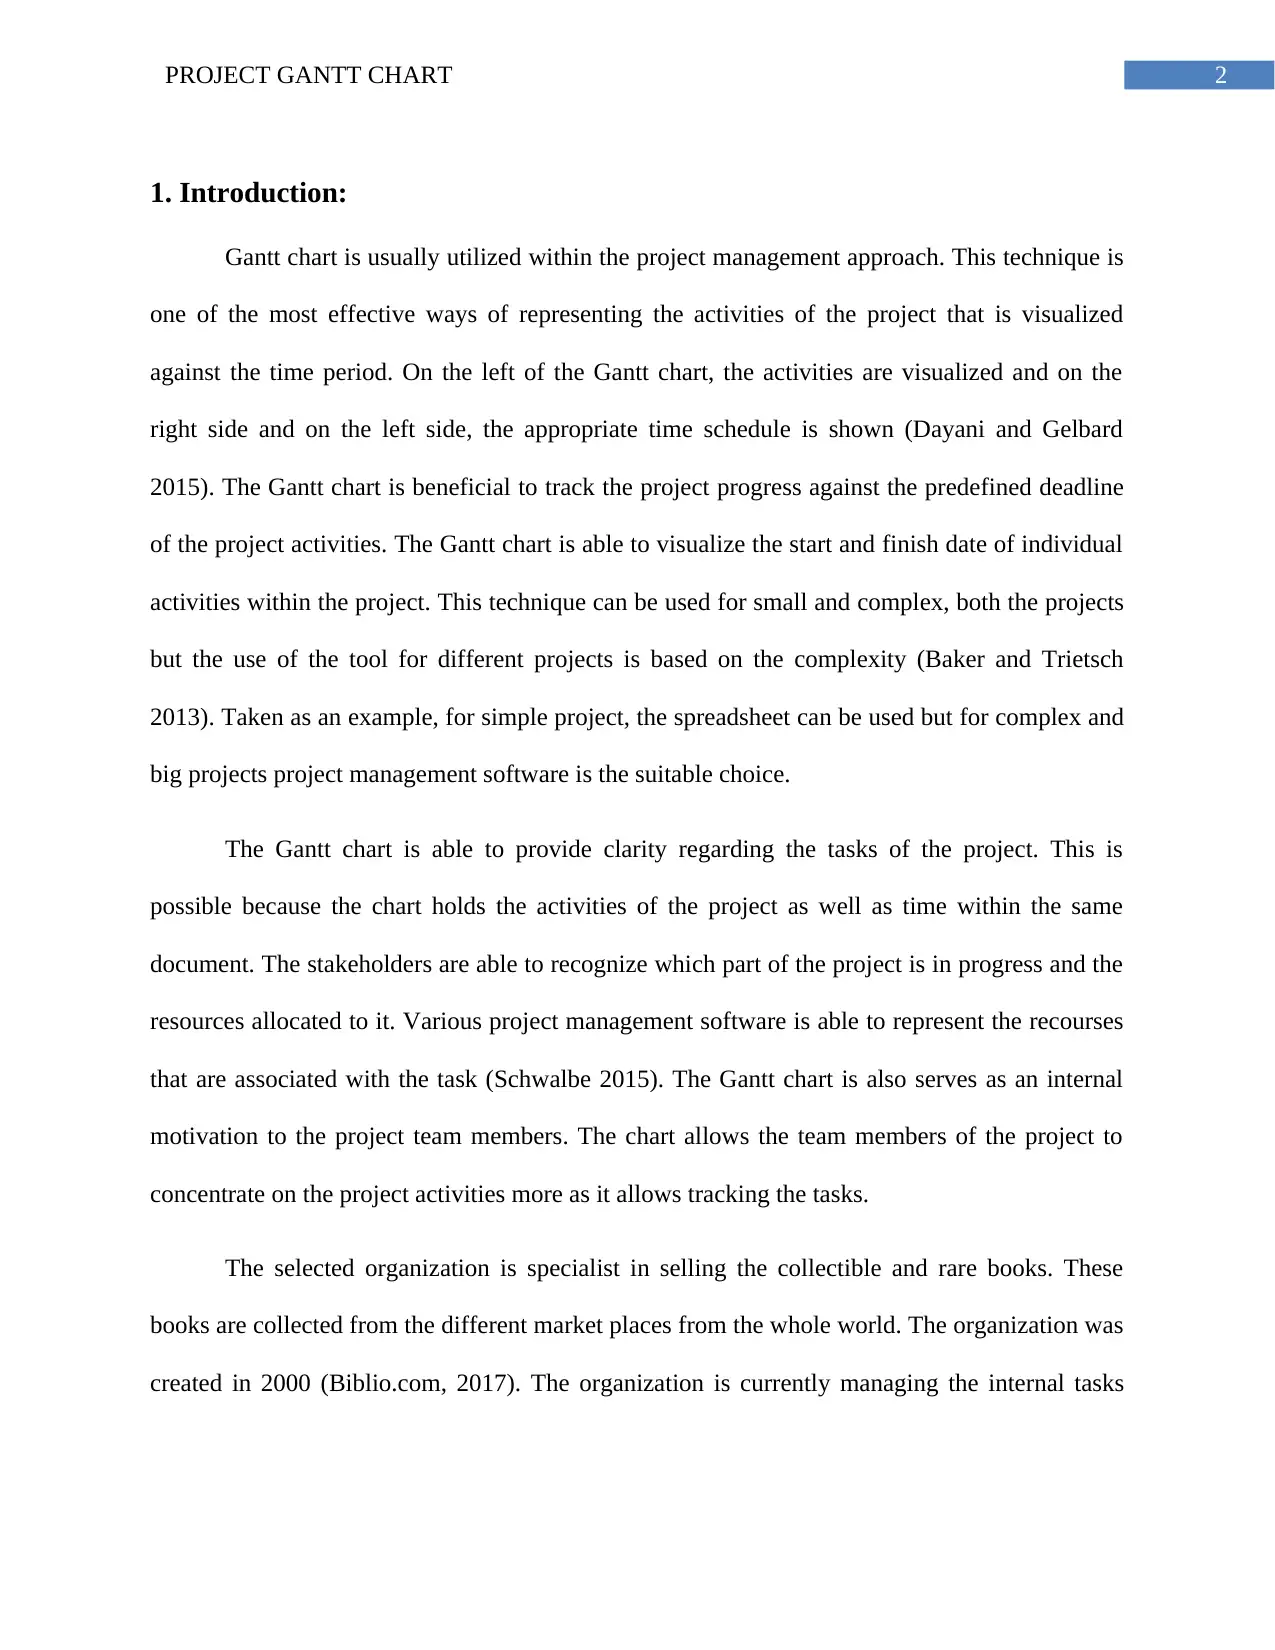
1. Introduction:
Gantt chart is usually utilized within the project management approach. This technique is
one of the most effective ways of representing the activities of the project that is visualized
against the time period. On the left of the Gantt chart, the activities are visualized and on the
right side and on the left side, the appropriate time schedule is shown (Dayani and Gelbard
2015). The Gantt chart is beneficial to track the project progress against the predefined deadline
of the project activities. The Gantt chart is able to visualize the start and finish date of individual
activities within the project. This technique can be used for small and complex, both the projects
but the use of the tool for different projects is based on the complexity (Baker and Trietsch
2013). Taken as an example, for simple project, the spreadsheet can be used but for complex and
big projects project management software is the suitable choice.
The Gantt chart is able to provide clarity regarding the tasks of the project. This is
possible because the chart holds the activities of the project as well as time within the same
document. The stakeholders are able to recognize which part of the project is in progress and the
resources allocated to it. Various project management software is able to represent the recourses
that are associated with the task (Schwalbe 2015). The Gantt chart is also serves as an internal
motivation to the project team members. The chart allows the team members of the project to
concentrate on the project activities more as it allows tracking the tasks.
The selected organization is specialist in selling the collectible and rare books. These
books are collected from the different market places from the whole world. The organization was
created in 2000 (Biblio.com, 2017). The organization is currently managing the internal tasks
3PROJECT GANTT CHART
manually. Maintain the business operations is very critical for the organization staff. Because of
the existing manual operations, the error in the business operation is very high.
BiblioZ is currently considering implementing an information system within the
organization in order to making the business processes automatic. The system will be
implemented through the SDLC approach. A project manager will be employed for managing
tasks. The project manager will be responsible for creating the Gantt chart of the project. The
project manager will provide the Gantt chart to the stakeholders of the project.
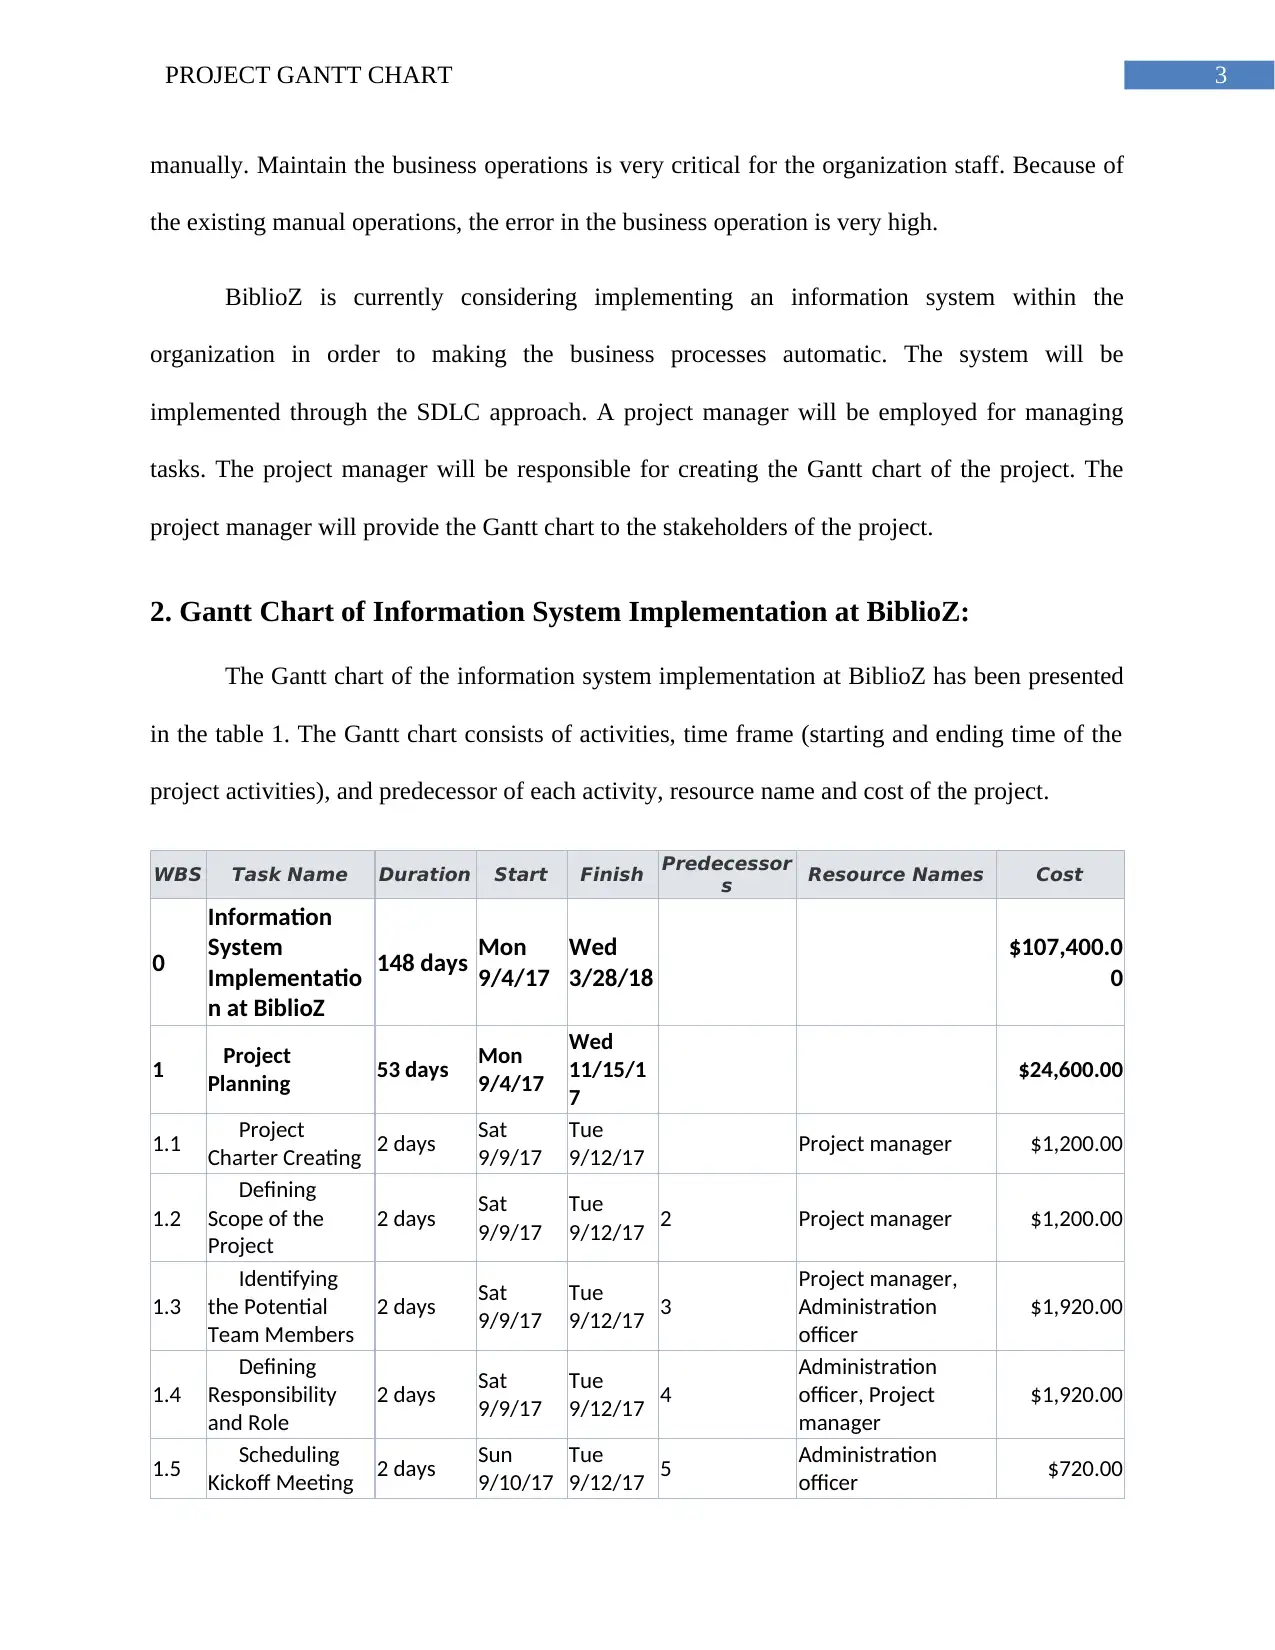
2. Gantt Chart of Information System Implementation at BiblioZ:
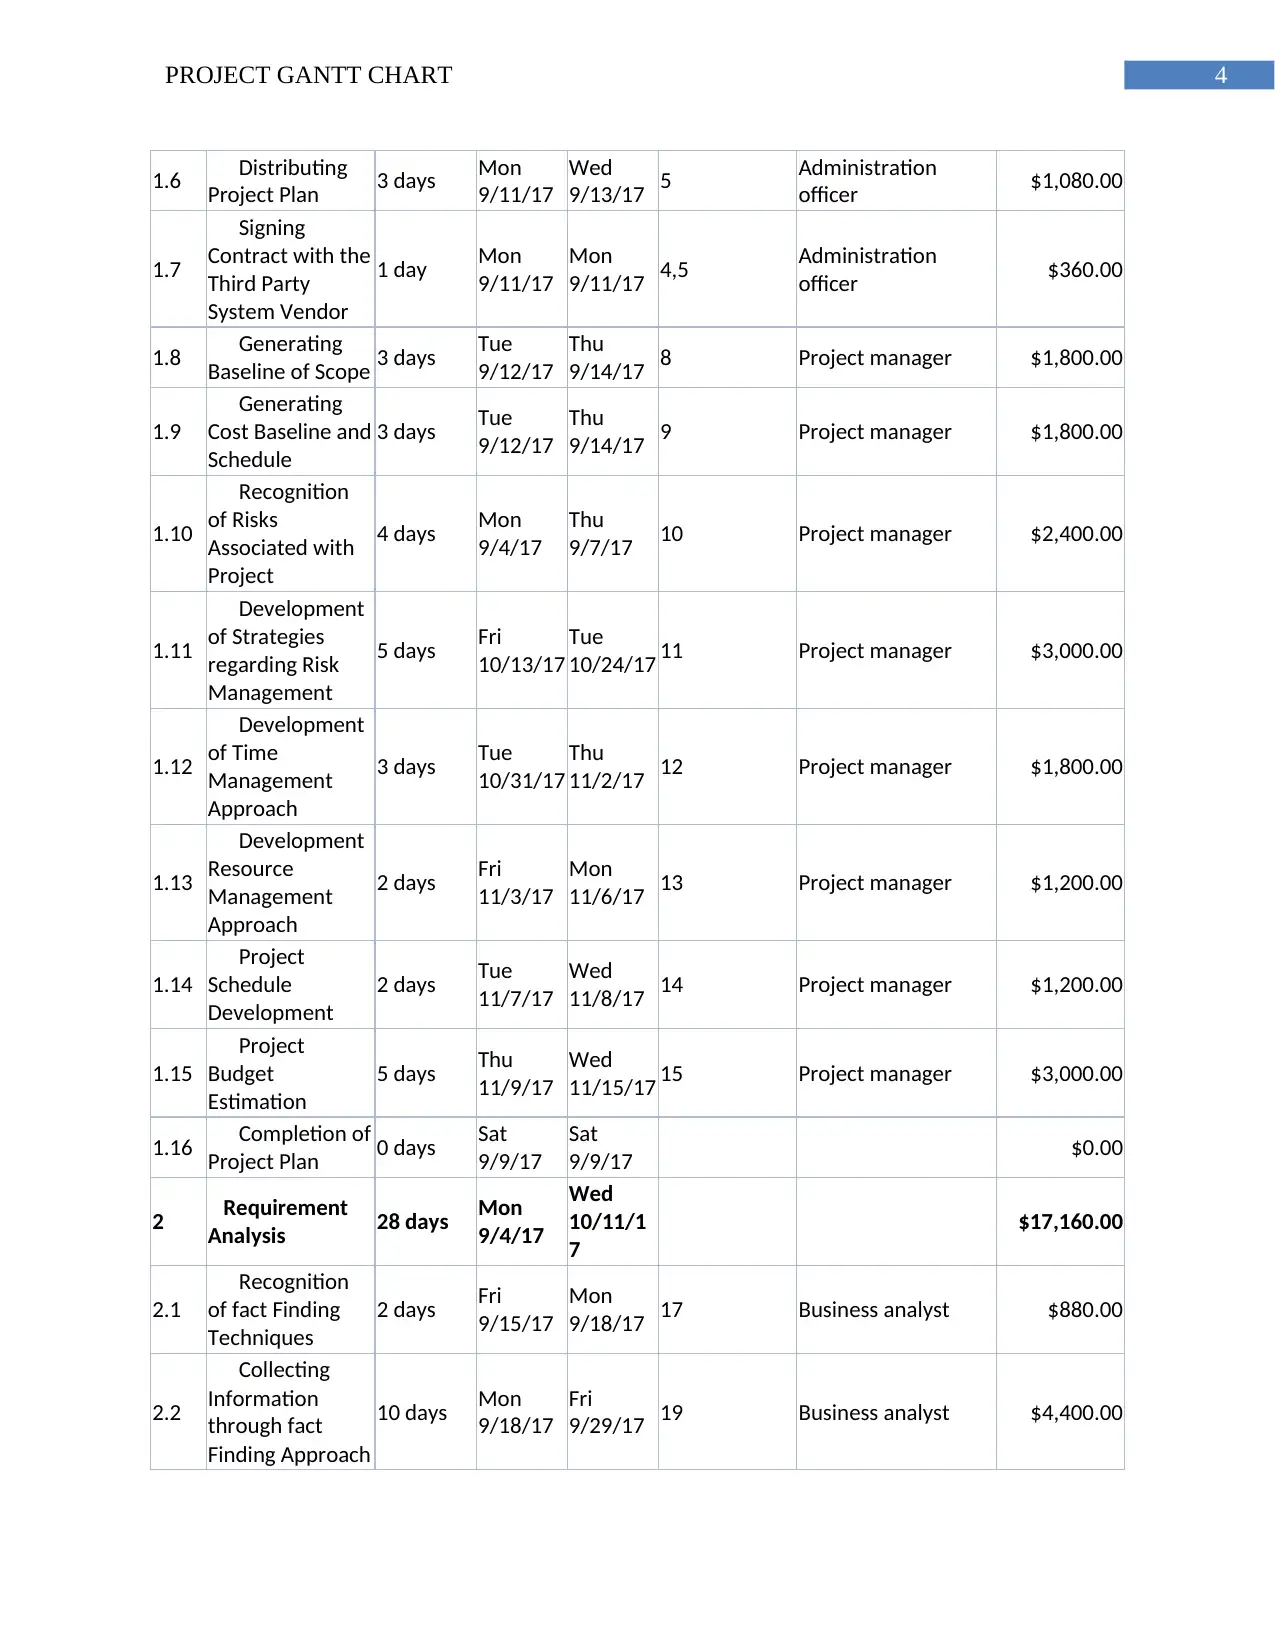
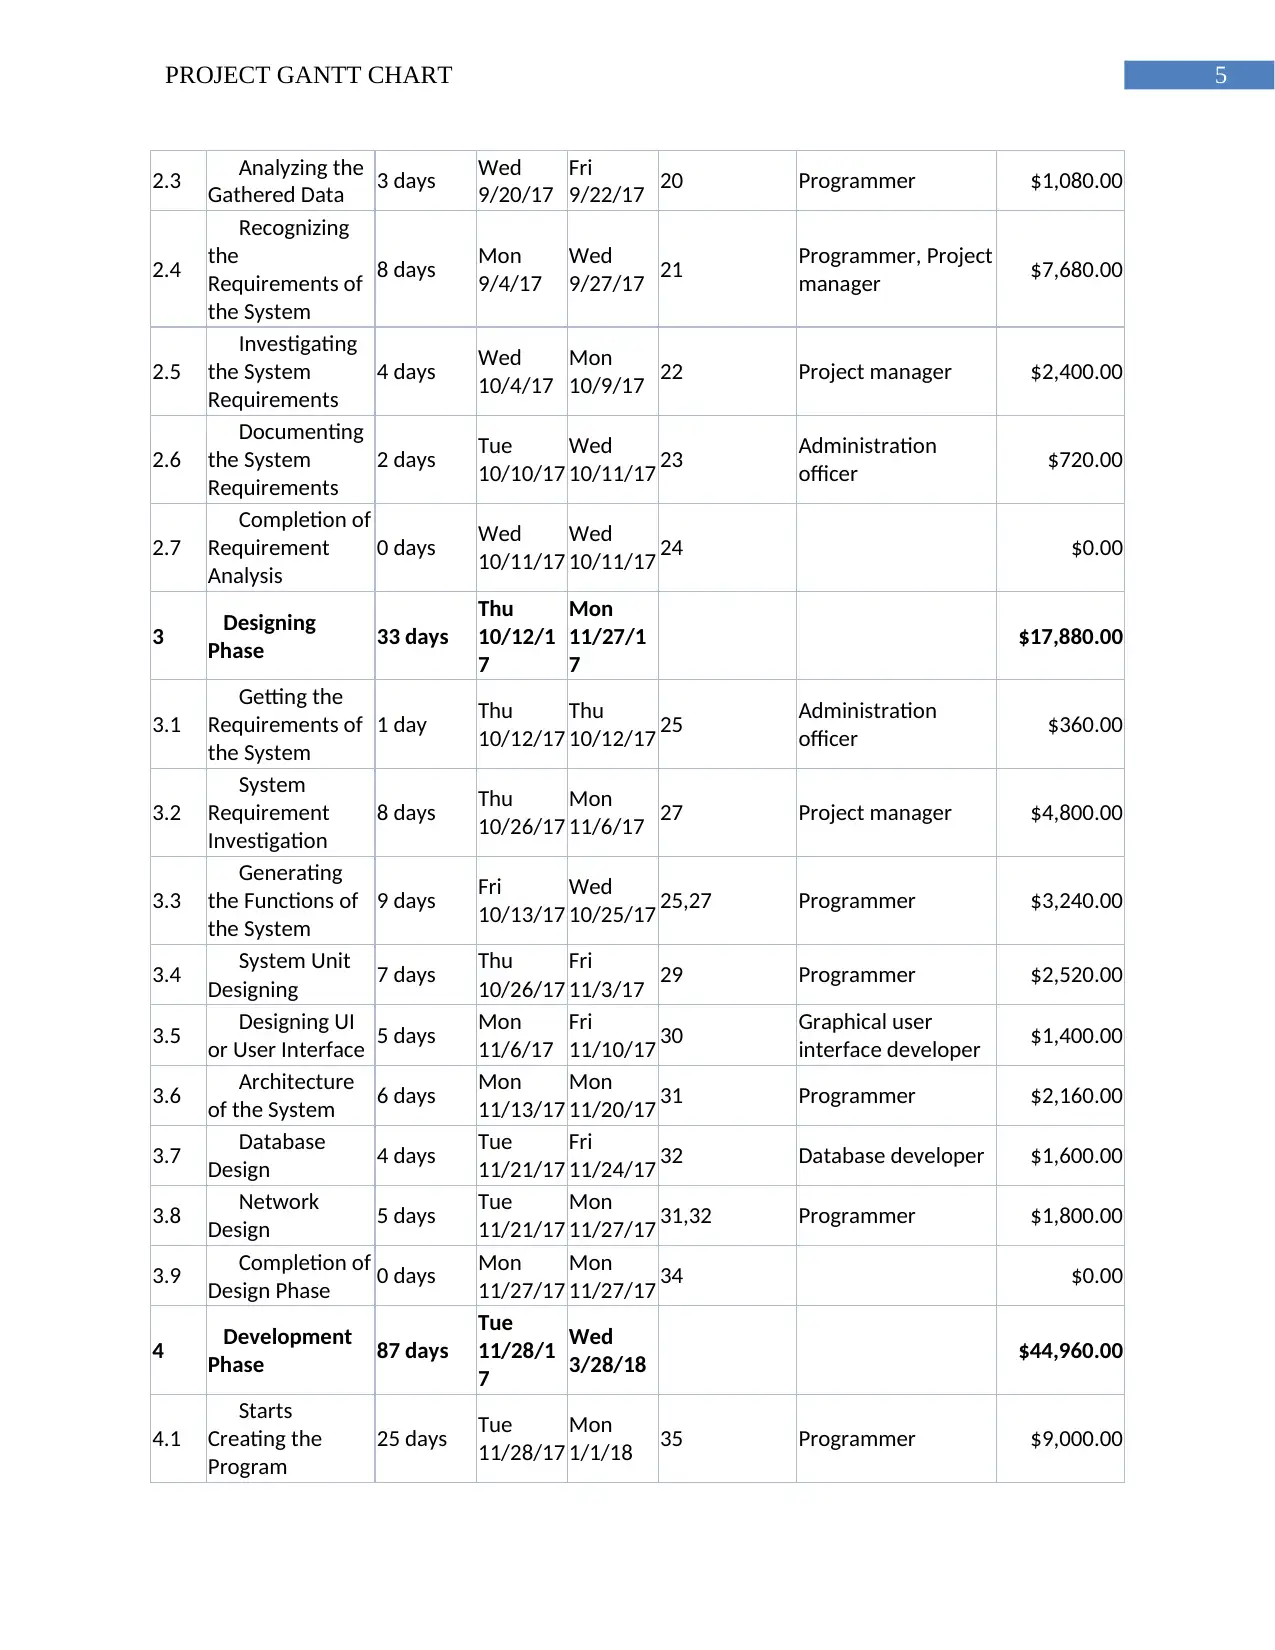
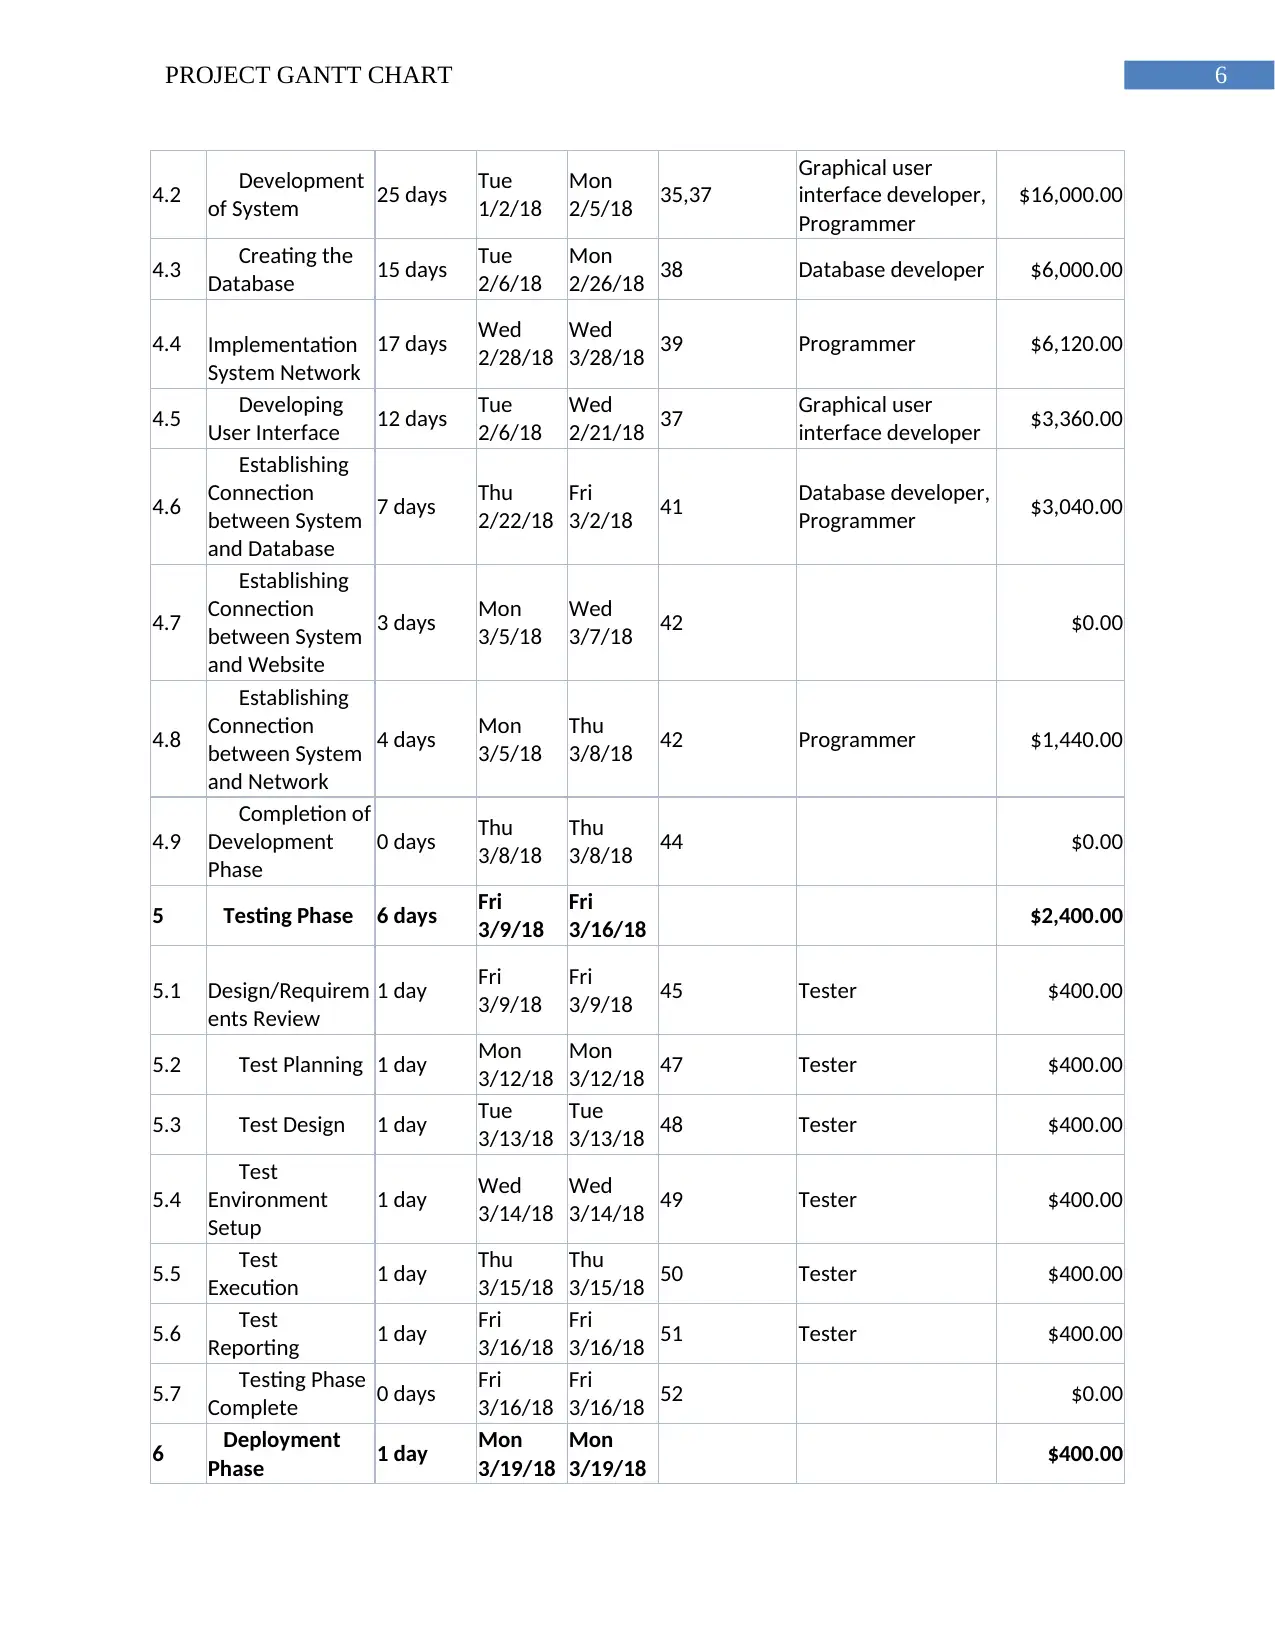
The Gantt chart of the information system implementation at BiblioZ has been presented
in the table 1. The Gantt chart consists of activities, time frame (starting and ending time of the
project activities), and predecessor of each activity, resource name and cost of the project.
WBS Task Name Duration Start Finish Predecessor
s Resource Names Cost
0
Information
System
Implementatio
n at BiblioZ
148 days Mon
9/4/17
Wed
3/28/18
$107,400.0
0
1 Project
Planning 53 days Mon
9/4/17
Wed
11/15/1
7
$24,600.00
1.1 Project
Charter Creating 2 days Sat
9/9/17
Tue
9/12/17 Project manager $1,200.00
1.2
Defining
Scope of the
Project
2 days Sat
9/9/17
Tue
9/12/17 2 Project manager $1,200.00
1.3
Identifying
the Potential
Team Members
2 days Sat
9/9/17
Tue
9/12/17 3
Project manager,
Administration
officer
$1,920.00
1.4
Defining
Responsibility
and Role
2 days Sat
9/9/17
Tue
9/12/17 4
Administration
officer, Project
manager
$1,920.00
1.5 Scheduling
Kickoff Meeting 2 days Sun
9/10/17
Tue
9/12/17 5 Administration
officer $720.00
manually. Maintain the business operations is very critical for the organization staff. Because of
the existing manual operations, the error in the business operation is very high.
BiblioZ is currently considering implementing an information system within the
organization in order to making the business processes automatic. The system will be
implemented through the SDLC approach. A project manager will be employed for managing
tasks. The project manager will be responsible for creating the Gantt chart of the project. The
project manager will provide the Gantt chart to the stakeholders of the project.
2. Gantt Chart of Information System Implementation at BiblioZ:
The Gantt chart of the information system implementation at BiblioZ has been presented
in the table 1. The Gantt chart consists of activities, time frame (starting and ending time of the
project activities), and predecessor of each activity, resource name and cost of the project.
WBS Task Name Duration Start Finish Predecessor
s Resource Names Cost
0
Information
System
Implementatio
n at BiblioZ
148 days Mon
9/4/17
Wed
3/28/18
$107,400.0
0
1 Project
Planning 53 days Mon
9/4/17
Wed
11/15/1
7
$24,600.00
1.1 Project
Charter Creating 2 days Sat
9/9/17
Tue
9/12/17 Project manager $1,200.00
1.2
Defining
Scope of the
Project
2 days Sat
9/9/17
Tue
9/12/17 2 Project manager $1,200.00
1.3
Identifying
the Potential
Team Members
2 days Sat
9/9/17
Tue
9/12/17 3
Project manager,
Administration
officer
$1,920.00
1.4
Defining
Responsibility
and Role
2 days Sat
9/9/17
Tue
9/12/17 4
Administration
officer, Project
manager
$1,920.00
1.5 Scheduling
Kickoff Meeting 2 days Sun
9/10/17
Tue
9/12/17 5 Administration
officer $720.00
Secure Best Marks with AI Grader
Need help grading? Try our AI Grader for instant feedback on your assignments.
4PROJECT GANTT CHART
1.6 Distributing
Project Plan 3 days Mon
9/11/17
Wed
9/13/17 5 Administration
officer $1,080.00
1.7
Signing
Contract with the
Third Party
System Vendor
1 day Mon
9/11/17
Mon
9/11/17 4,5 Administration
officer $360.00
1.8 Generating
Baseline of Scope 3 days Tue
9/12/17
Thu
9/14/17 8 Project manager $1,800.00
1.9
Generating
Cost Baseline and
Schedule
3 days Tue
9/12/17
Thu
9/14/17 9 Project manager $1,800.00
1.10
Recognition
of Risks
Associated with
Project
4 days Mon
9/4/17
Thu
9/7/17 10 Project manager $2,400.00
1.11
Development
of Strategies
regarding Risk
Management
5 days Fri
10/13/17
Tue
10/24/17 11 Project manager $3,000.00
1.12
Development
of Time
Management
Approach
3 days Tue
10/31/17
Thu
11/2/17 12 Project manager $1,800.00
1.13
Development
Resource
Management
Approach
2 days Fri
11/3/17
Mon
11/6/17 13 Project manager $1,200.00
1.14
Project
Schedule
Development
2 days Tue
11/7/17
Wed
11/8/17 14 Project manager $1,200.00
1.15
Project
Budget
Estimation
5 days Thu
11/9/17
Wed
11/15/17 15 Project manager $3,000.00
1.16 Completion of
Project Plan 0 days Sat
9/9/17
Sat
9/9/17 $0.00
2 Requirement
Analysis 28 days Mon
9/4/17
Wed
10/11/1
7
$17,160.00
2.1
Recognition
of fact Finding
Techniques
2 days Fri
9/15/17
Mon
9/18/17 17 Business analyst $880.00
2.2
Collecting
Information
through fact
Finding Approach
10 days Mon
9/18/17
Fri
9/29/17 19 Business analyst $4,400.00
5PROJECT GANTT CHART
2.3 Analyzing the
Gathered Data 3 days Wed
9/20/17
Fri
9/22/17 20 Programmer $1,080.00
2.4
Recognizing
the
Requirements of
the System
8 days Mon
9/4/17
Wed
9/27/17 21 Programmer, Project
manager $7,680.00
2.5
Investigating
the System
Requirements
4 days Wed
10/4/17
Mon
10/9/17 22 Project manager $2,400.00
2.6
Documenting
the System
Requirements
2 days Tue
10/10/17
Wed
10/11/17 23 Administration
officer $720.00
2.7
Completion of
Requirement
Analysis
0 days Wed
10/11/17
Wed
10/11/17 24 $0.00
3 Designing
Phase 33 days
Thu
10/12/1
7
Mon
11/27/1
7
$17,880.00
3.1
Getting the
Requirements of
the System
1 day Thu
10/12/17
Thu
10/12/17 25 Administration
officer $360.00
3.2
System
Requirement
Investigation
8 days Thu
10/26/17
Mon
11/6/17 27 Project manager $4,800.00
3.3
Generating
the Functions of
the System
9 days Fri
10/13/17
Wed
10/25/17 25,27 Programmer $3,240.00
3.4 System Unit
Designing 7 days Thu
10/26/17
Fri
11/3/17 29 Programmer $2,520.00
3.5 Designing UI
or User Interface 5 days Mon
11/6/17
Fri
11/10/17 30 Graphical user
interface developer $1,400.00
3.6 Architecture
of the System 6 days Mon
11/13/17
Mon
11/20/17 31 Programmer $2,160.00
3.7 Database
Design 4 days Tue
11/21/17
Fri
11/24/17 32 Database developer $1,600.00
3.8 Network
Design 5 days Tue
11/21/17
Mon
11/27/17 31,32 Programmer $1,800.00
3.9 Completion of
Design Phase 0 days Mon
11/27/17
Mon
11/27/17 34 $0.00
4 Development
Phase 87 days
Tue
11/28/1
7
Wed
3/28/18 $44,960.00
4.1
Starts
Creating the
Program
25 days Tue
11/28/17
Mon
1/1/18 35 Programmer $9,000.00
6PROJECT GANTT CHART
4.2 Development
of System 25 days Tue
1/2/18
Mon
2/5/18 35,37
Graphical user
interface developer,
Programmer
$16,000.00
4.3 Creating the
Database 15 days Tue
2/6/18
Mon
2/26/18 38 Database developer $6,000.00
4.4 Implementation
System Network
17 days Wed
2/28/18
Wed
3/28/18 39 Programmer $6,120.00
4.5 Developing
User Interface 12 days Tue
2/6/18
Wed
2/21/18 37 Graphical user
interface developer $3,360.00
4.6
Establishing
Connection
between System
and Database
7 days Thu
2/22/18
Fri
3/2/18 41 Database developer,
Programmer $3,040.00
4.7
Establishing
Connection
between System
and Website
3 days Mon
3/5/18
Wed
3/7/18 42 $0.00
4.8
Establishing
Connection
between System
and Network
4 days Mon
3/5/18
Thu
3/8/18 42 Programmer $1,440.00
4.9
Completion of
Development
Phase
0 days Thu
3/8/18
Thu
3/8/18 44 $0.00
5 Testing Phase 6 days Fri
3/9/18
Fri
3/16/18 $2,400.00
5.1 Design/Requirem
ents Review
1 day Fri
3/9/18
Fri
3/9/18 45 Tester $400.00
5.2 Test Planning 1 day Mon
3/12/18
Mon
3/12/18 47 Tester $400.00
5.3 Test Design 1 day Tue
3/13/18
Tue
3/13/18 48 Tester $400.00
5.4
Test
Environment
Setup
1 day Wed
3/14/18
Wed
3/14/18 49 Tester $400.00
5.5 Test
Execution 1 day Thu
3/15/18
Thu
3/15/18 50 Tester $400.00
5.6 Test
Reporting 1 day Fri
3/16/18
Fri
3/16/18 51 Tester $400.00
5.7 Testing Phase
Complete 0 days Fri
3/16/18
Fri
3/16/18 52 $0.00
6 Deployment
Phase 1 day Mon
3/19/18
Mon
3/19/18 $400.00
Paraphrase This Document
Need a fresh take? Get an instant paraphrase of this document with our AI Paraphraser
7PROJECT GANTT CHART
6.1
Deploying
System in Bilblio
Environment
1 day Mon
3/19/18
Mon
3/19/18 53 Tester $400.00
6.2 Deployment
Complete 0 days Mon
3/19/18
Mon
3/19/18 55 $0.00
Table 1: Schedule of the Proposed Project
(Source: Created by Author)
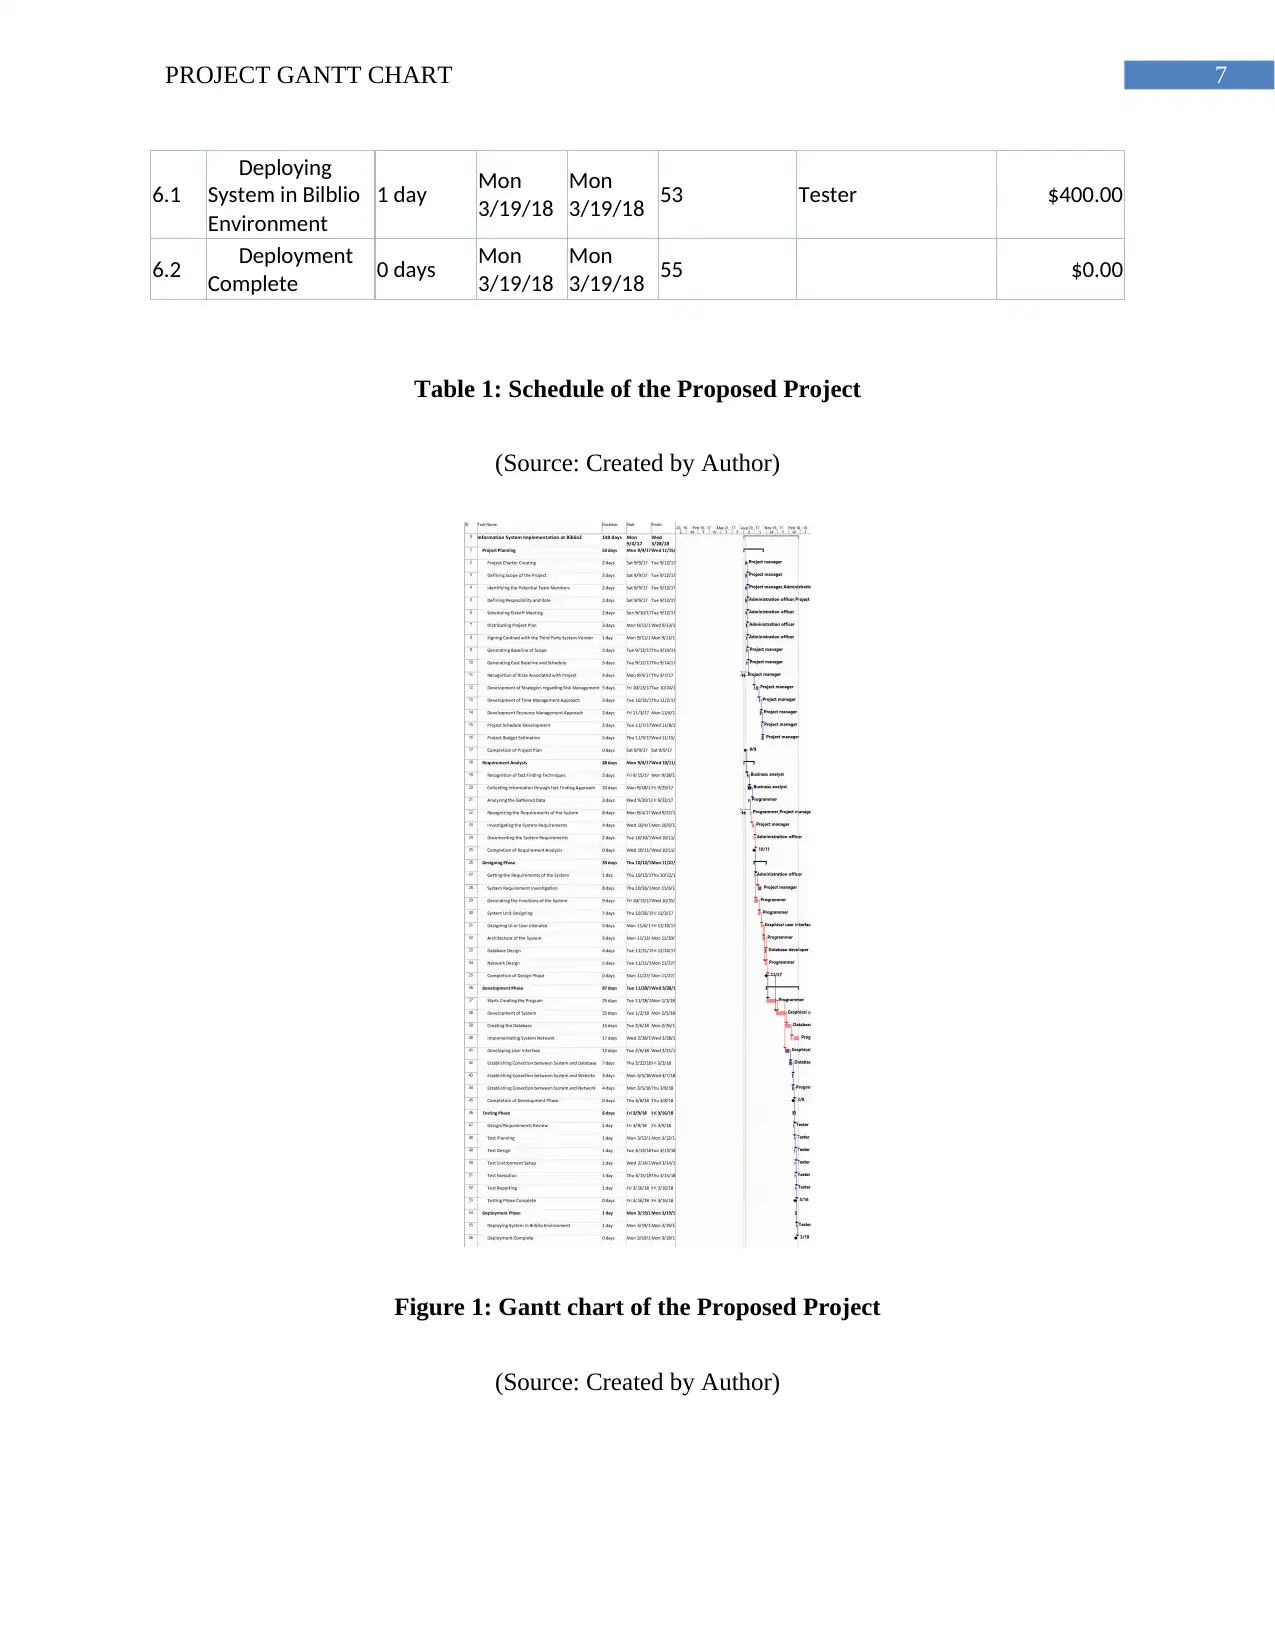
Figure 1: Gantt chart of the Proposed Project
(Source: Created by Author)
6.1
Deploying
System in Bilblio
Environment
1 day Mon
3/19/18
Mon
3/19/18 53 Tester $400.00
6.2 Deployment
Complete 0 days Mon
3/19/18
Mon
3/19/18 55 $0.00
Table 1: Schedule of the Proposed Project
(Source: Created by Author)
Figure 1: Gantt chart of the Proposed Project
(Source: Created by Author)
8PROJECT GANTT CHART
The project schedule of the proposed project management visualizes five phases. This
phases are also consisting of different sub-tasks. The chart shows the time frame for each of the
tasks including the phases. The predecessor implies the task after which the project task will be
carried out. This schedule will be provided to all of the project team members so that all the
members can identify its job related data accurately. Within the Gantt chart, the resources (only
the human resources) has been considered. Some of the tasks are carried out by single member
and some are done collaboratively. The project is consisting of more than 50 activities.
3. Conclusion:
From the above study it can be concluded that the Gantt chart is a very special technique
of making the project schedule. As it can be seen the project is a very lengthy project. For this
reason the project management software has been used for developing the system instead of
spread sheet. The project management software allowed to auto calculate the timing of the
project based on the task duration and predecessor. Project schedule will serve as a great source
of managing the project tasks for the Bilbio Information System project. A lot of a supervisor's
workday is spent putting out flames. There appear to be such a large number of crises that you
and no one but you can react to. Bunch's notable time administration grid shows the four
classifications of time consumption, including that notorious "fire" classification. As the human
resources required for the project has been bee represented through the chart, the project
manager now can concentrate on the project core activities without having any second thoughts
about the resource allocation. In the field of time administration, lumping enables you to arrange
your undertakings such that you deal with comparable exercises at a specific time.
9PROJECT GANTT CHART
Bibliography:
Baker, K.R. and Trietsch, D., 2013. Principles of sequencing and scheduling. John Wiley &
Sons.
Biblio.com. (2017). Biblio.com | Used Books and Rare Books from Antiquarian Booksellers.
[online] Available at: https://www.biblio.com/ [Accessed 9 Sep. 2017].
Browning, T.R., 2014. Managing complex project process models with a process architecture
framework. International Journal of Project Management, 32(2), pp.229-241.
Dayani, M. and Gelbard, R., 2015. Automatic Conversion of Software Specification into a Gantt-
chart subject to Organization's Constraints. Procedia Computer Science, 64, pp.73-78.
Fleming, Q.W. and Koppelman, J.M., 2016. Earned value project management. Project
Management Institute.
Golini, R., Kalchschmidt, M. and Landoni, P., 2015. Adoption of project management practices:
the impact on international development projects of non-governmental organizations.
International Journal of Project Management, 33(3), pp.650-663.
Heizer, J., 2016. Operations Management, 11/e. Pearson Education India.
Kerzner, H., 2013. Project management: a systems approach to planning, scheduling, and
controlling. John Wiley & Sons.
Landry, J.P. and McDaniel, R., 2015. Agile Preparation Within a Traditional Project
Management Course. In Proceedings of the EDSIG Conference (p. n3429).
Secure Best Marks with AI Grader
Need help grading? Try our AI Grader for instant feedback on your assignments.
10PROJECT GANTT CHART
Riol, H. and Thuillier, D., 2015. Project management for academic research projects: balancing
structure and flexibility. International Journal of Project Organisation and Management, 7(3),
pp.251-269.
Schillemans, K. and Robinson, L., 2015. Team and project management skills. OPTIMAX 2015,
p.15.
Schwalbe, K., 2015. Information technology project management. Cengage Learning.
1 out of 11
Related Documents


Your All-in-One AI-Powered Toolkit for Academic Success.
+13062052269
info@desklib.com
Available 24*7 on WhatsApp / Email
![[object Object]](/_next/static/media/star-bottom.7253800d.svg)
Unlock your academic potential
© 2024 | Zucol Services PVT LTD | All rights reserved.