Project Management: Comprehensive Analysis of Server Monitoring Tools
VerifiedAdded on 2023/01/19
|25
|1746
|53
Project
AI Summary
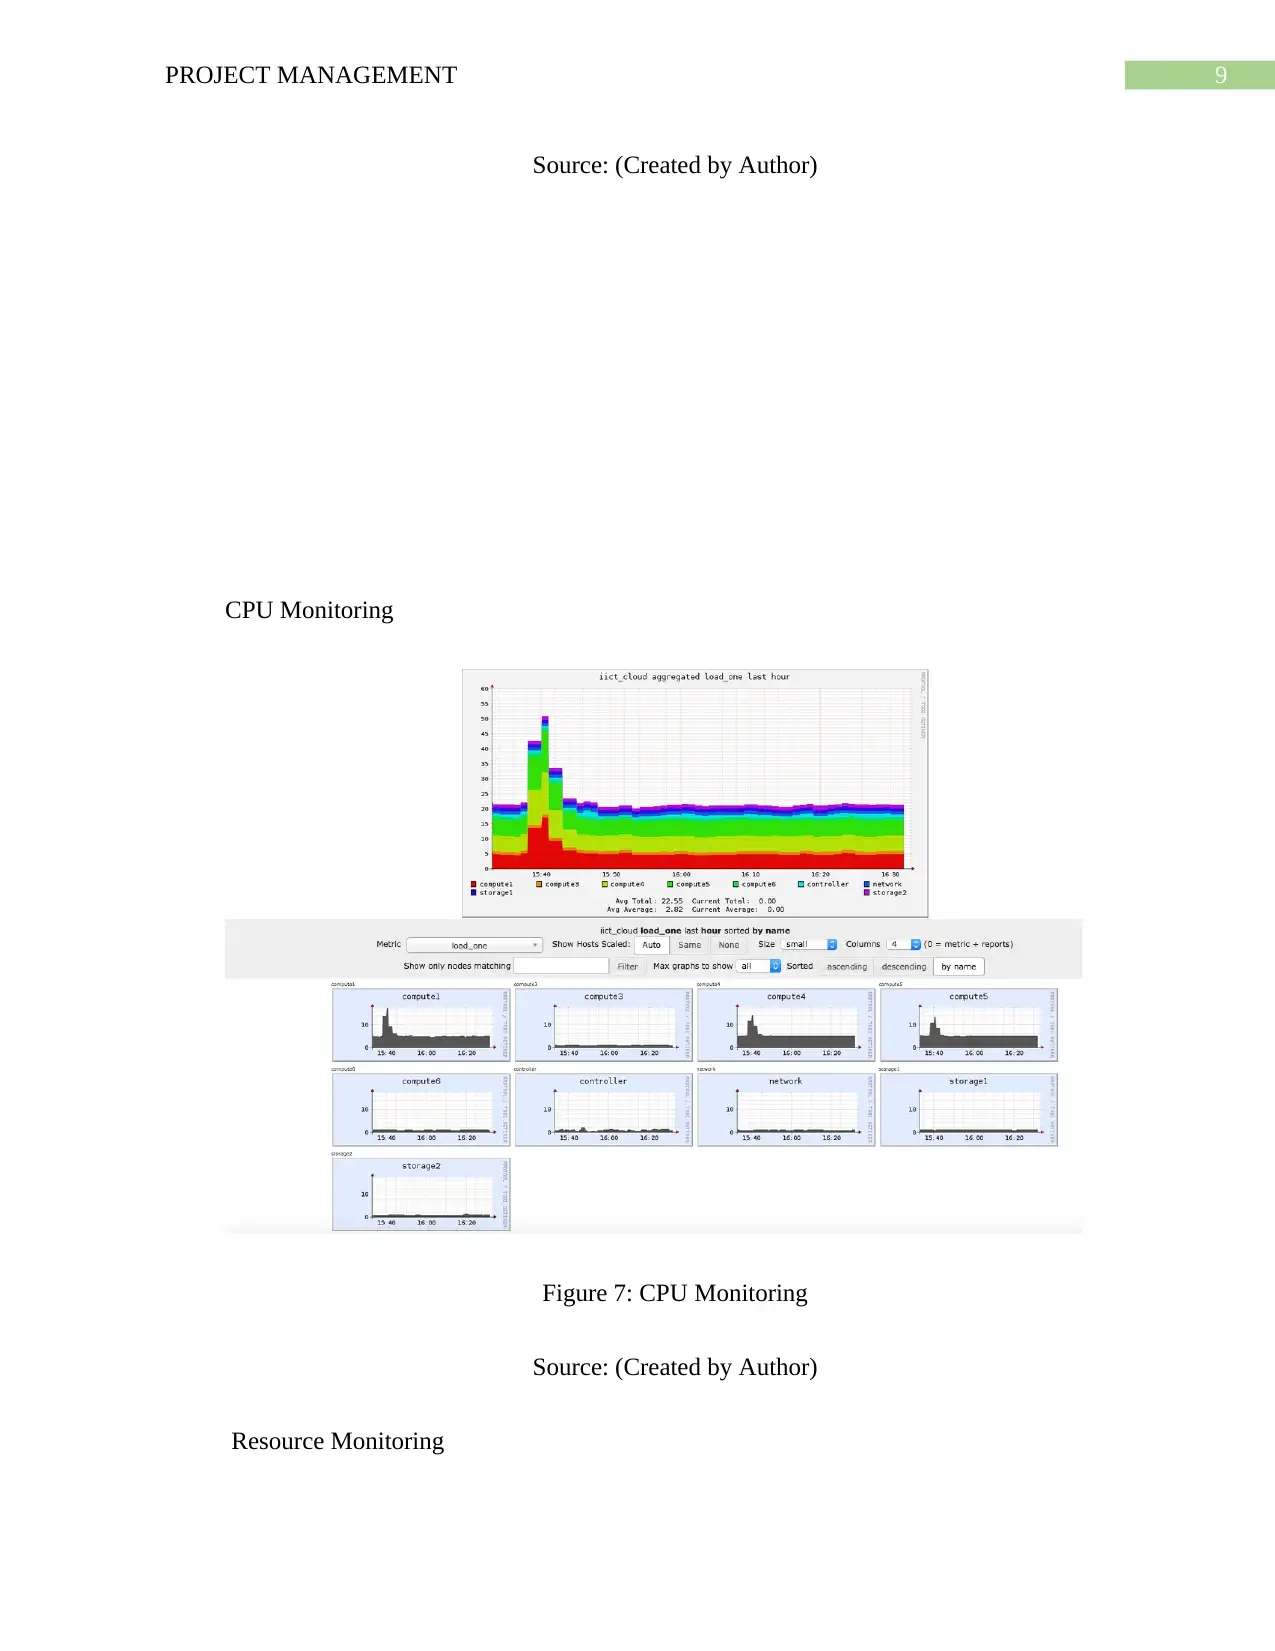
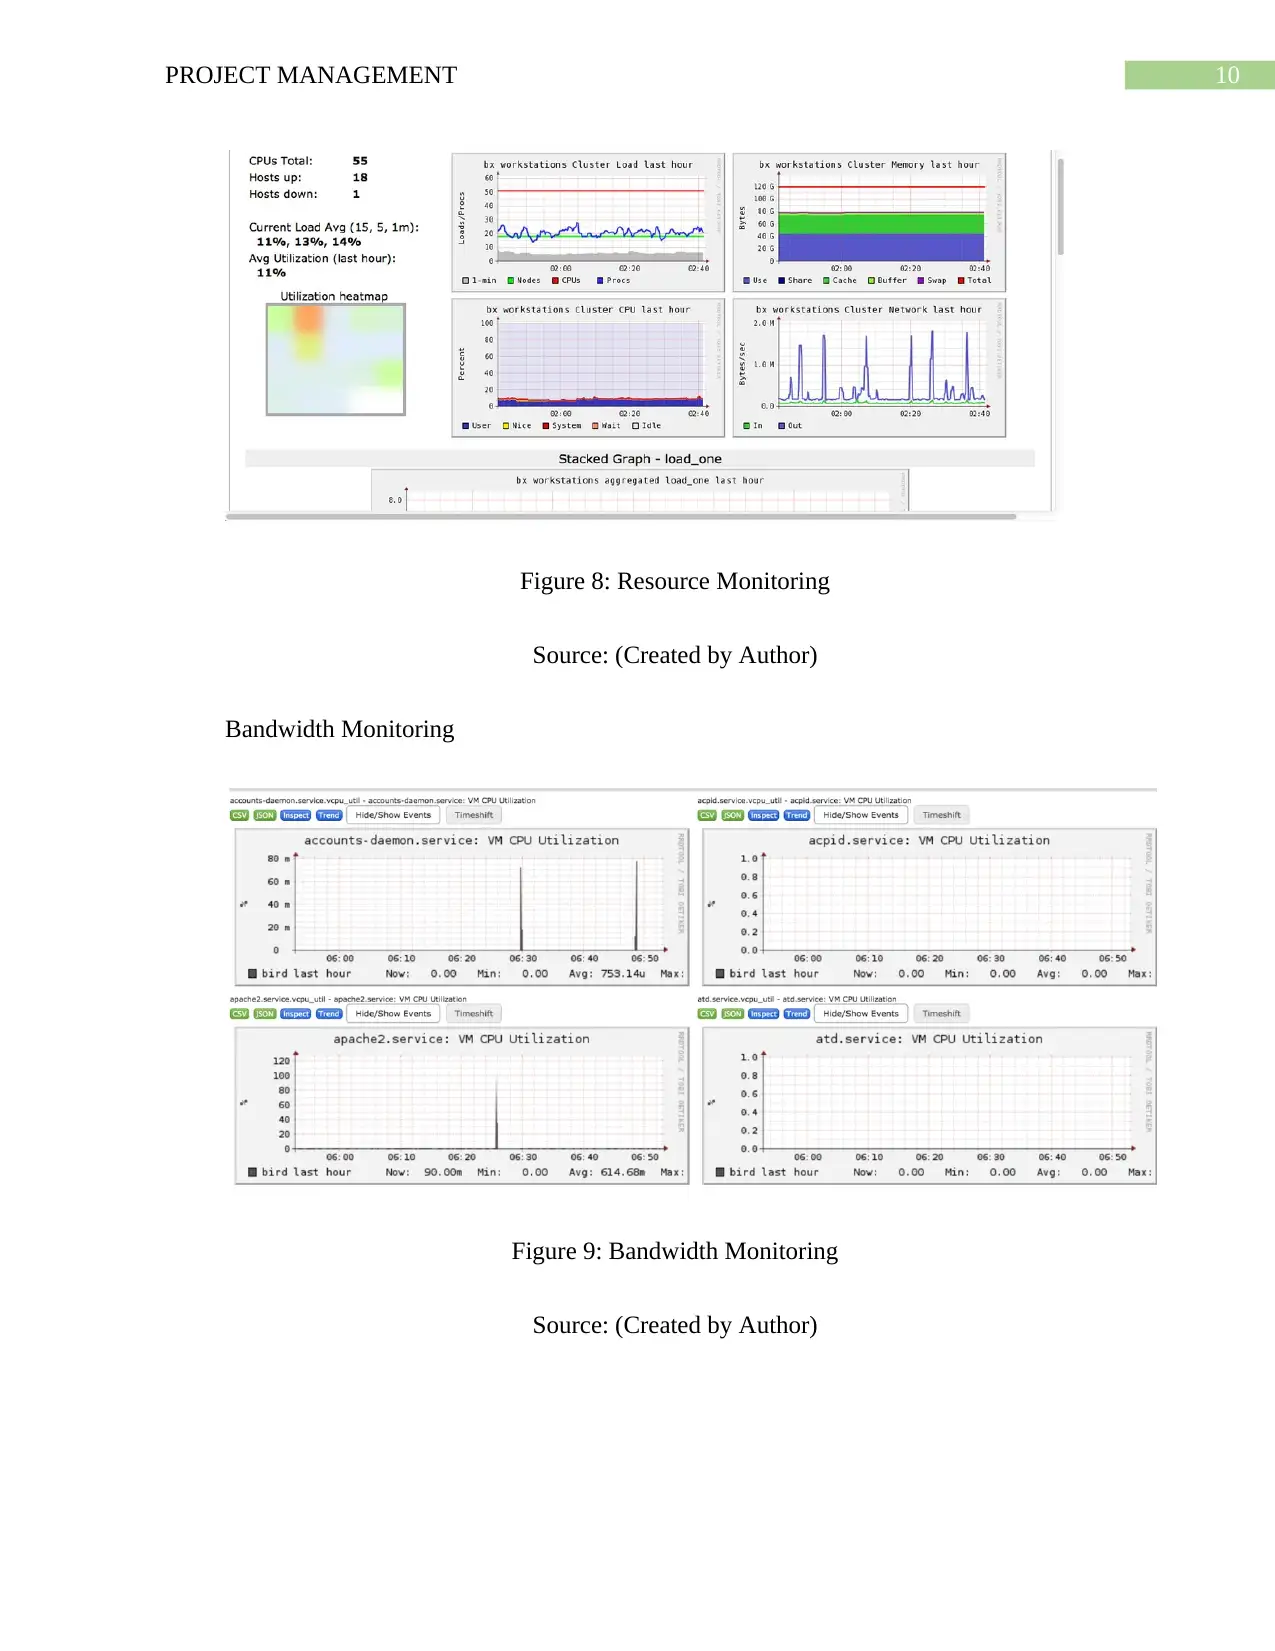
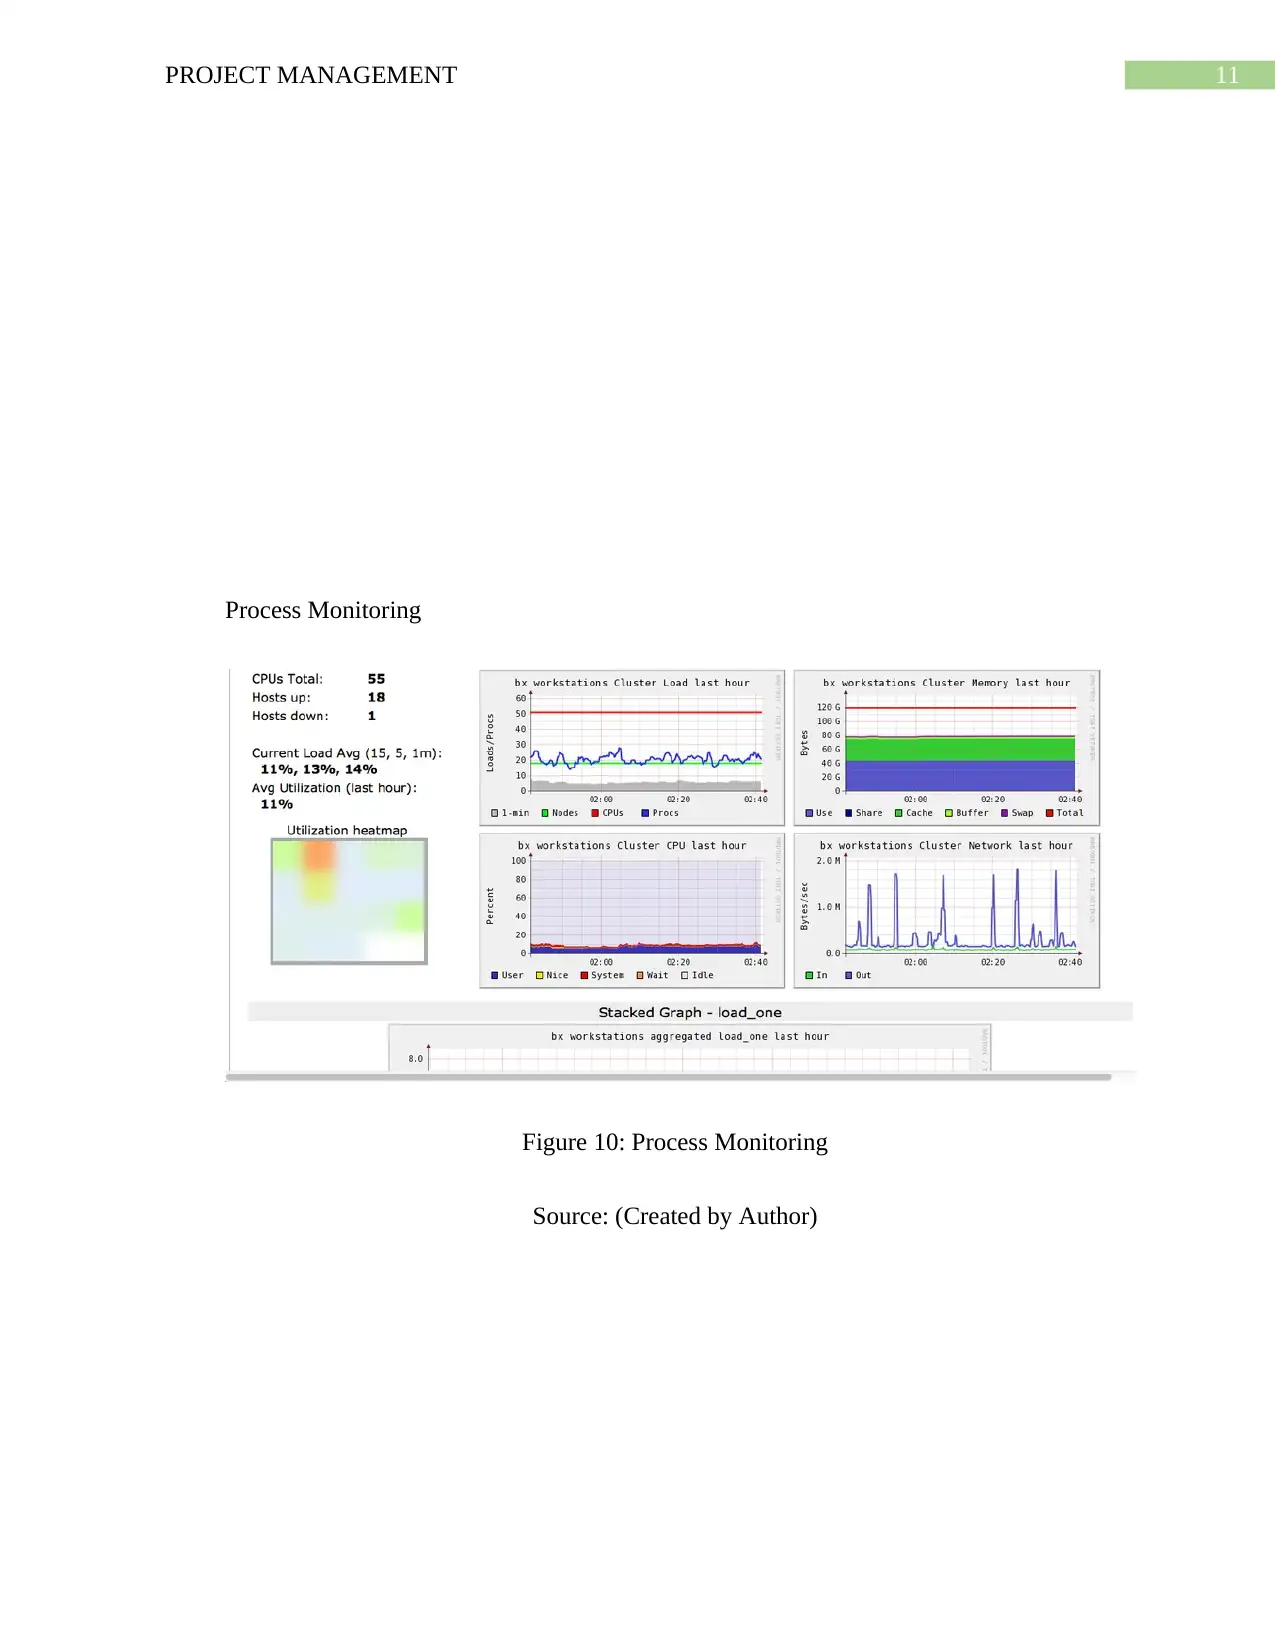
This project management assignment provides a detailed overview of server monitoring tools, essential for evaluating server performance. It introduces various tools such as NagiosCore, Ganglia, CollectD, Spiceworks, Cacti, Zabbix, Icinga, OpenNMS, and WhatsUp Gold, comparing their functionalities and capabilities in monitoring IT infrastructure. The assignment further explores the server monitoring architecture, which includes application, window agent, linux agent, and service components, and how these components work together to generate reports and provide warnings for potential issues. The project also addresses data vulnerabilities associated with server monitoring tools, particularly concerning server privileges and multiple user access points, and suggests solutions like the use of scanning tools such as Comondo HackerProof to detect and mitigate security risks. The project concludes by emphasizing the importance of server monitoring in reducing risks and threats, highlighting its significance in maintaining the integrity of data that flows through a server.

1 out of 25
Related Documents


Your All-in-One AI-Powered Toolkit for Academic Success.
+13062052269
info@desklib.com
Available 24*7 on WhatsApp / Email
![[object Object]](/_next/static/media/star-bottom.7253800d.svg)
Copyright © 2020–2026 A2Z Services. All Rights Reserved. Developed and managed by ZUCOL.