Financial Statement Analysis Assignmen (pdf)
VerifiedAdded on 2021/06/17
|17
|4118
|39
AI Summary
Contribute Materials
Your contribution can guide someone’s learning journey. Share your
documents today.
Running Head: Financial Statement Analysis
1
Project Report: Financial Statement Analysis
1
Project Report: Financial Statement Analysis
Secure Best Marks with AI Grader
Need help grading? Try our AI Grader for instant feedback on your assignments.

Financial Statement Analysis
2
2
Financial Statement Analysis
3
Executive summary:
This report has been prepared to evaluate the investment position of Vector limited;
various factors have been evaluated to identify the performance of the comapny such as
financial analysis, strategies, future prospect, WACC and equity valuation etc. On the basis
of financial analysis and return on capital of the company, it has been found that the
investment into the company would offer huge loss. However, the stock evaluation explains
that the market position of the company is quite better and thus the investment into the
security of the company would offer huge return at the time of selling the security. the report
explains that the investment into the company would offer great profit to the investors.
Financial Statement Analysis
4
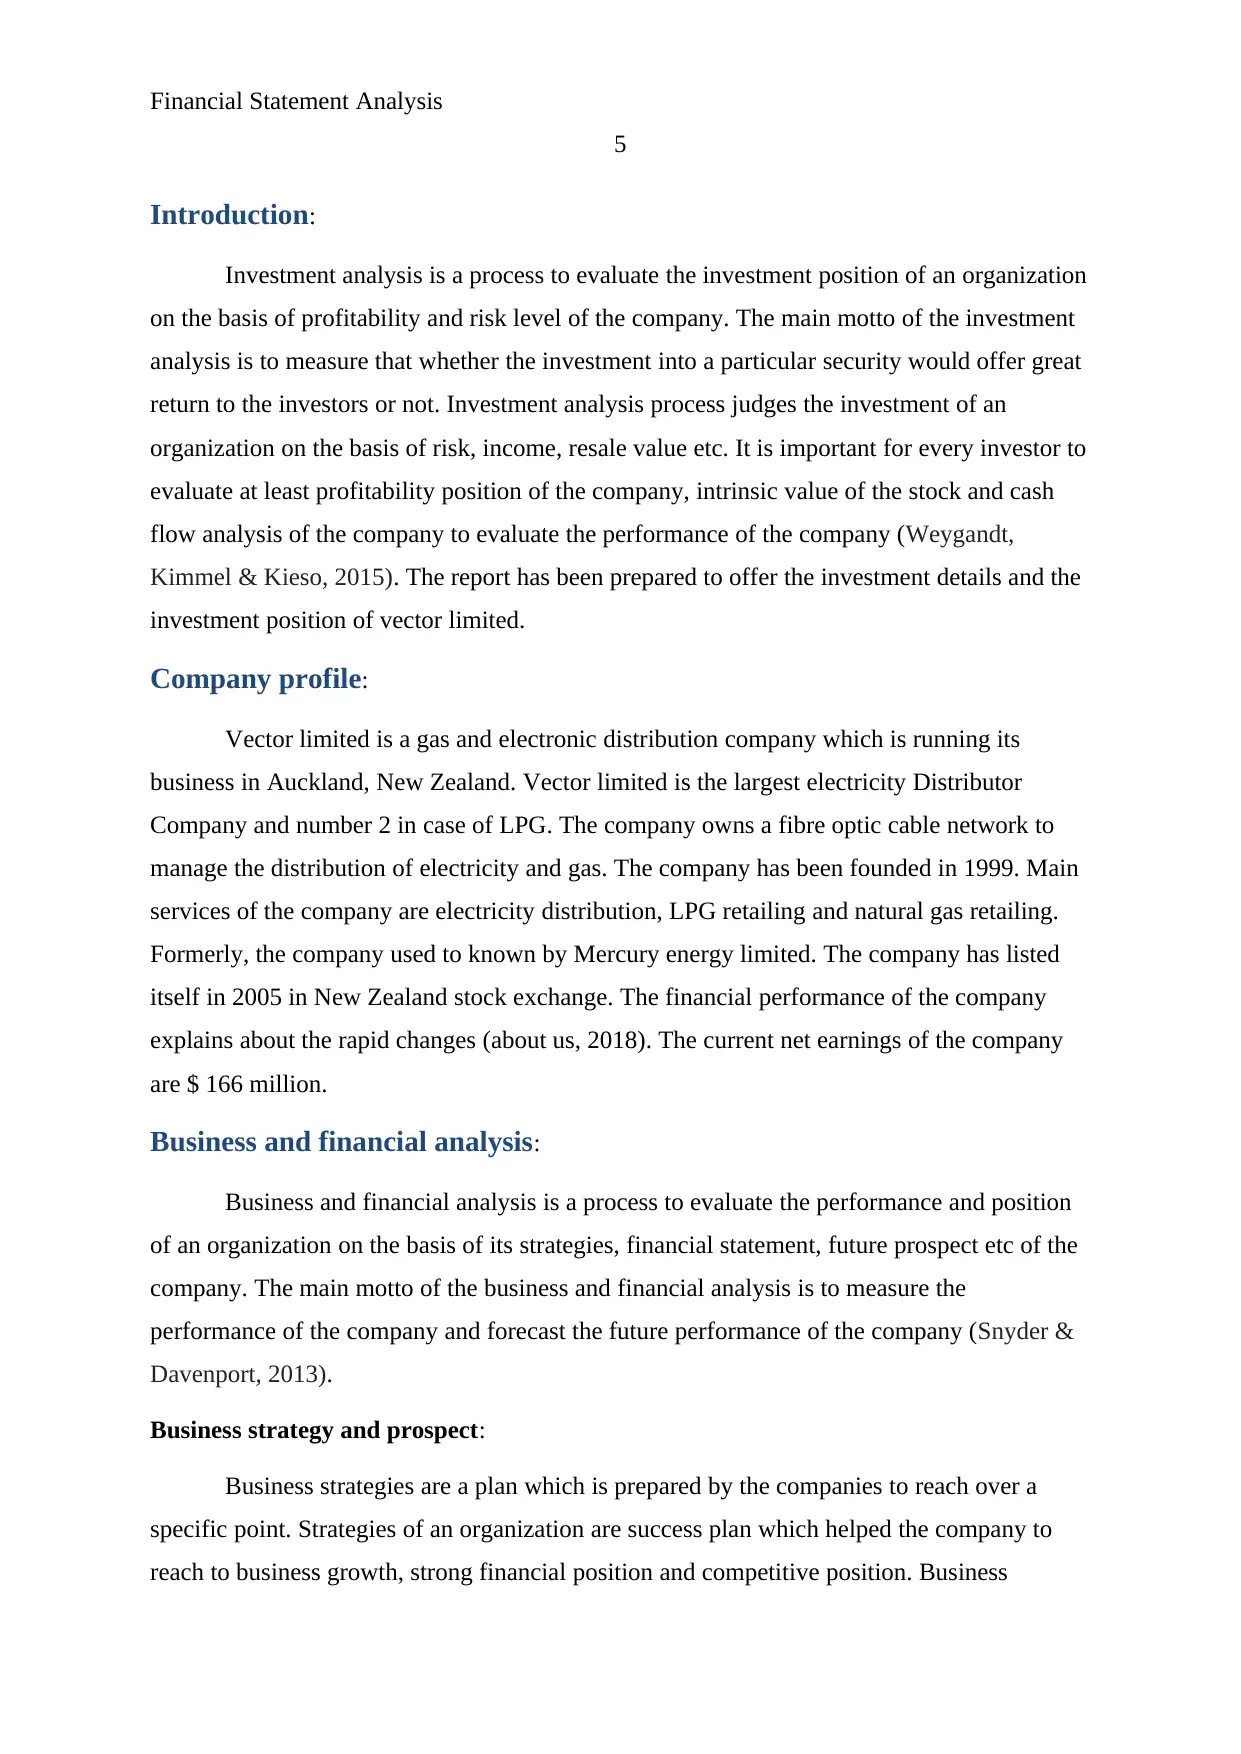
Contents
Introduction.......................................................................................................................5
Company profile...............................................................................................................5
Business and financial analysis........................................................................................5
Weighted average cost of capital......................................................................................8
Valuation.........................................................................................................................10
Summary and conclusion................................................................................................11
References.......................................................................................................................13
Appendix.........................................................................................................................15
4
Contents
Introduction.......................................................................................................................5
Company profile...............................................................................................................5
Business and financial analysis........................................................................................5
Weighted average cost of capital......................................................................................8
Valuation.........................................................................................................................10
Summary and conclusion................................................................................................11
References.......................................................................................................................13
Appendix.........................................................................................................................15
Secure Best Marks with AI Grader
Need help grading? Try our AI Grader for instant feedback on your assignments.
Financial Statement Analysis
5
Introduction:
Investment analysis is a process to evaluate the investment position of an organization
on the basis of profitability and risk level of the company. The main motto of the investment
analysis is to measure that whether the investment into a particular security would offer great
return to the investors or not. Investment analysis process judges the investment of an
organization on the basis of risk, income, resale value etc. It is important for every investor to
evaluate at least profitability position of the company, intrinsic value of the stock and cash
flow analysis of the company to evaluate the performance of the company (Weygandt,
Kimmel & Kieso, 2015). The report has been prepared to offer the investment details and the
investment position of vector limited.
Company profile:
Vector limited is a gas and electronic distribution company which is running its
business in Auckland, New Zealand. Vector limited is the largest electricity Distributor
Company and number 2 in case of LPG. The company owns a fibre optic cable network to
manage the distribution of electricity and gas. The company has been founded in 1999. Main
services of the company are electricity distribution, LPG retailing and natural gas retailing.
Formerly, the company used to known by Mercury energy limited. The company has listed
itself in 2005 in New Zealand stock exchange. The financial performance of the company
explains about the rapid changes (about us, 2018). The current net earnings of the company
are $ 166 million.
Business and financial analysis:
Business and financial analysis is a process to evaluate the performance and position
of an organization on the basis of its strategies, financial statement, future prospect etc of the
company. The main motto of the business and financial analysis is to measure the
performance of the company and forecast the future performance of the company (Snyder &
Davenport, 2013).
Business strategy and prospect:
Business strategies are a plan which is prepared by the companies to reach over a
specific point. Strategies of an organization are success plan which helped the company to
reach to business growth, strong financial position and competitive position. Business
Financial Statement Analysis
6
strategies of vector explain that the company has announced to offer efficiency and
sustainable energy solutions to its customers with acquisition of E-co products group and
PowerSmart. The company has used diversification strategy to manage the performance and
reach over the main objectives of the company. Diversity and inclusion strategy of the
company briefs that the great diversity has helped the company to get richer range of ideas
and the broader ideas and perspective to understand the customer’s needs and serve them
efficiently which has enhanced the business growth of the company (Diversity and Inclusion,
2018).
This strategy of the company has helped the company to enhance the level of the
revenue in the market as well as customer’s satisfaction level of the company has also been
enhanced. Further, the company has also focused on the health, safety and environment of the
society. These policies have helped the company to manage a better system ad position in
society. The customer relationship management functions of the company are also
competitive (Our approach, 2018).
The main prospect of the company is to enhance the market share through entering
into the new market and grab the market. The company has planned the diversification
strategy for that only. The performance and the new prospect of the company explain that the
company would enhance the revenue and the market position of the company as well in near
future. The strategy and the policies have been prepared by the company in such a manner
that the prospect could be easily achieved by the company.
Financial analysis:
Financial analysis is a process to evaluate the financial performance and the financial
position of an organization on the basis of its financial statement, market stock price etc of
the company. The main motto of the financial analysis is to measure the performance of the
company and forecast the future financial performance of the company. The study of
financial analysis on Vector limited expresses about rapid changes into the performance of
the company. On the basis of income statement of the company, it has been evaluated that the
total revenue of the company has been lowered in last 5 years due to the industry changes and
the economical factors which have also affected on the net profit of the company
(Morningstar, 2018).
Financial Statement Analysis
7
Further, the statement of financial performance of the company briefs the better
available resources. However, the company has enhanced the level of debt more than the
equity level to manage the resources and the funds of the company. Cash flow analysis also
explains that the free cash flow of the company is continuously reducing due to lower sales
and the bad cash conversion cycle of the company. For evaluating the investment position of
the company, return on capital (ROC) of the company has been evaluated.
Return on capital:
Return on capital is a profitability ratio. It is calculated to measure the total return of
investment of capital contributors of the company i.e. shareholders and the debt holders. ROC
indicates about the effectively of the company as well on the basis of total capital and the net
profits of the company (Hillier, Grinblatt & Titman, 2011).
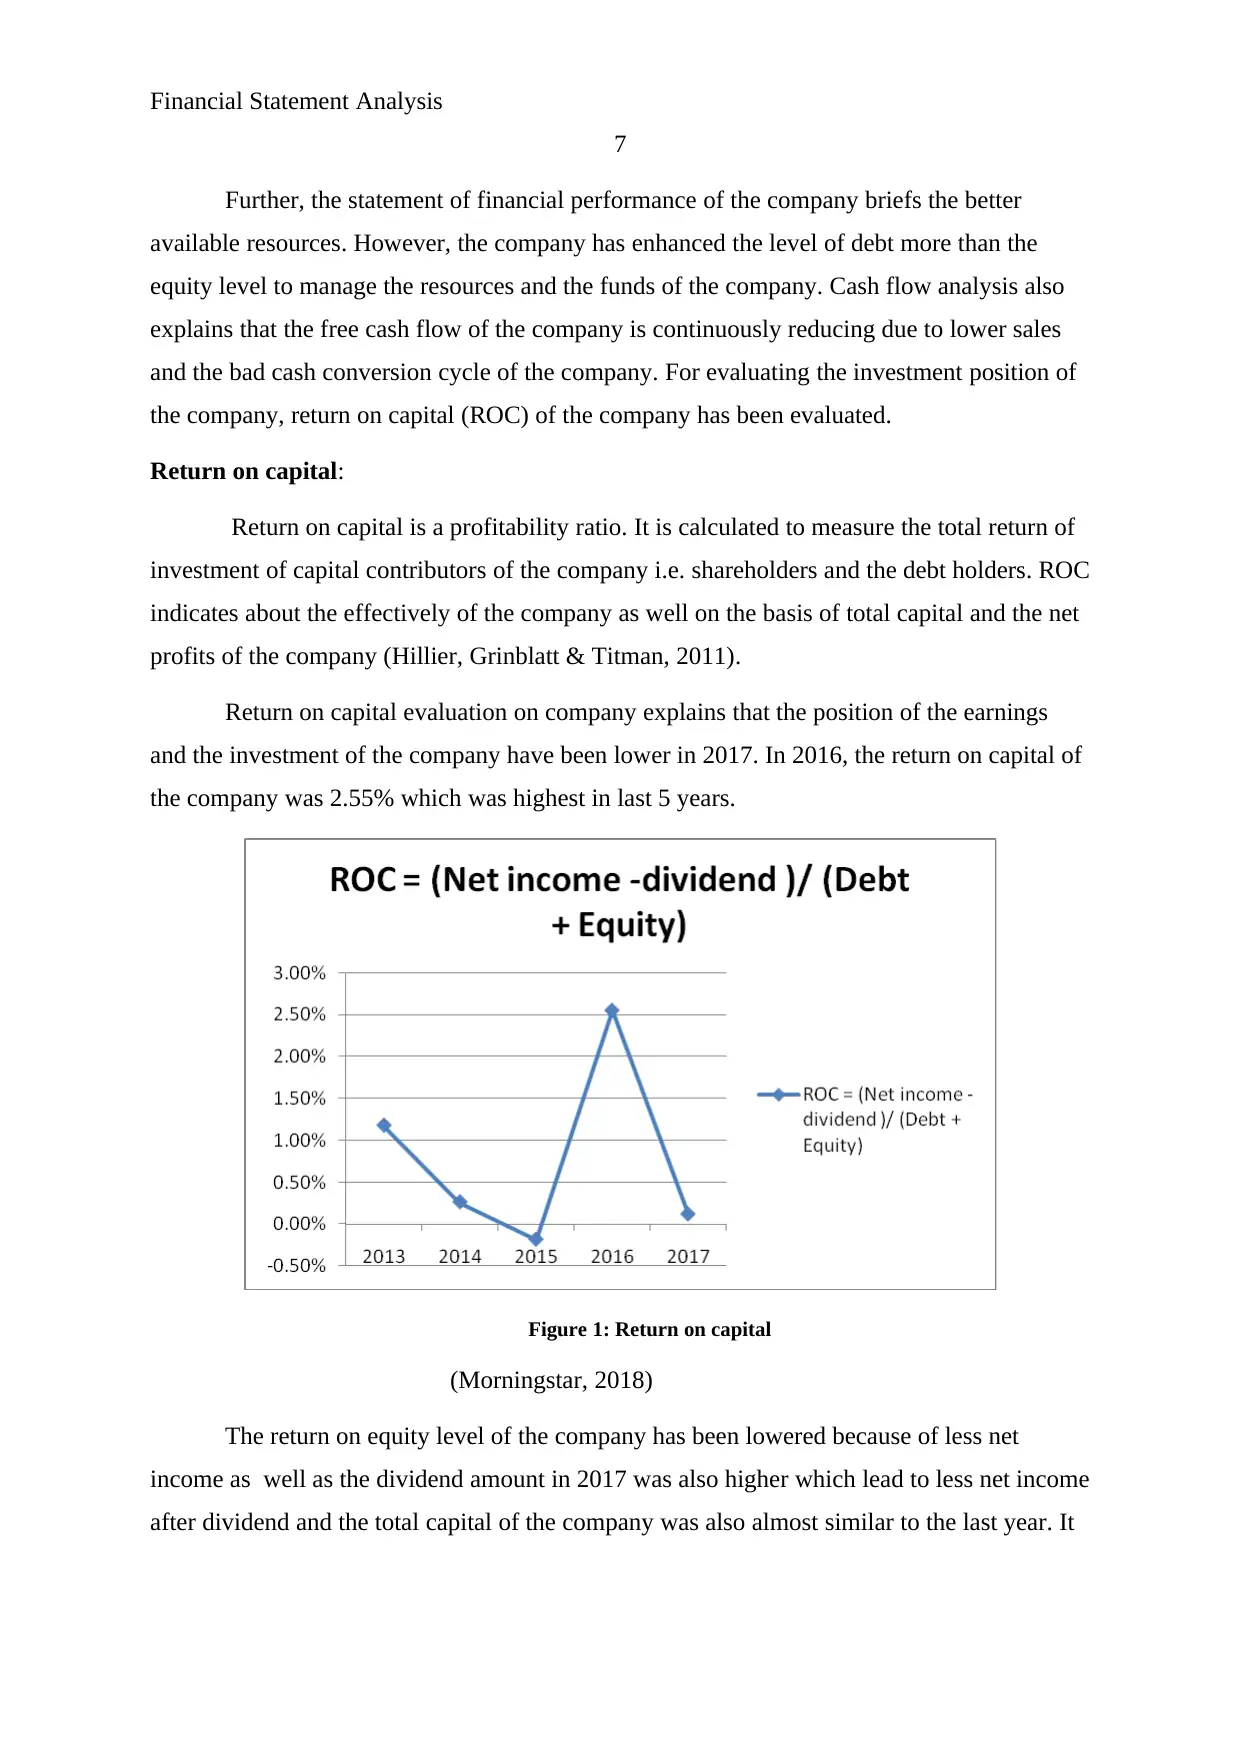
Return on capital evaluation on company explains that the position of the earnings
and the investment of the company have been lower in 2017. In 2016, the return on capital of
the company was 2.55% which was highest in last 5 years.
Figure 1: Return on capital
(Morningstar, 2018)
The return on equity level of the company has been lowered because of less net
income as well as the dividend amount in 2017 was also higher which lead to less net income
after dividend and the total capital of the company was also almost similar to the last year. It
7
Further, the statement of financial performance of the company briefs the better
available resources. However, the company has enhanced the level of debt more than the
equity level to manage the resources and the funds of the company. Cash flow analysis also
explains that the free cash flow of the company is continuously reducing due to lower sales
and the bad cash conversion cycle of the company. For evaluating the investment position of
the company, return on capital (ROC) of the company has been evaluated.
Return on capital:
Return on capital is a profitability ratio. It is calculated to measure the total return of
investment of capital contributors of the company i.e. shareholders and the debt holders. ROC
indicates about the effectively of the company as well on the basis of total capital and the net
profits of the company (Hillier, Grinblatt & Titman, 2011).
Return on capital evaluation on company explains that the position of the earnings
and the investment of the company have been lower in 2017. In 2016, the return on capital of
the company was 2.55% which was highest in last 5 years.
Figure 1: Return on capital
(Morningstar, 2018)
The return on equity level of the company has been lowered because of less net
income as well as the dividend amount in 2017 was also higher which lead to less net income
after dividend and the total capital of the company was also almost similar to the last year. It
Paraphrase This Document
Need a fresh take? Get an instant paraphrase of this document with our AI Paraphraser
Financial Statement Analysis
8
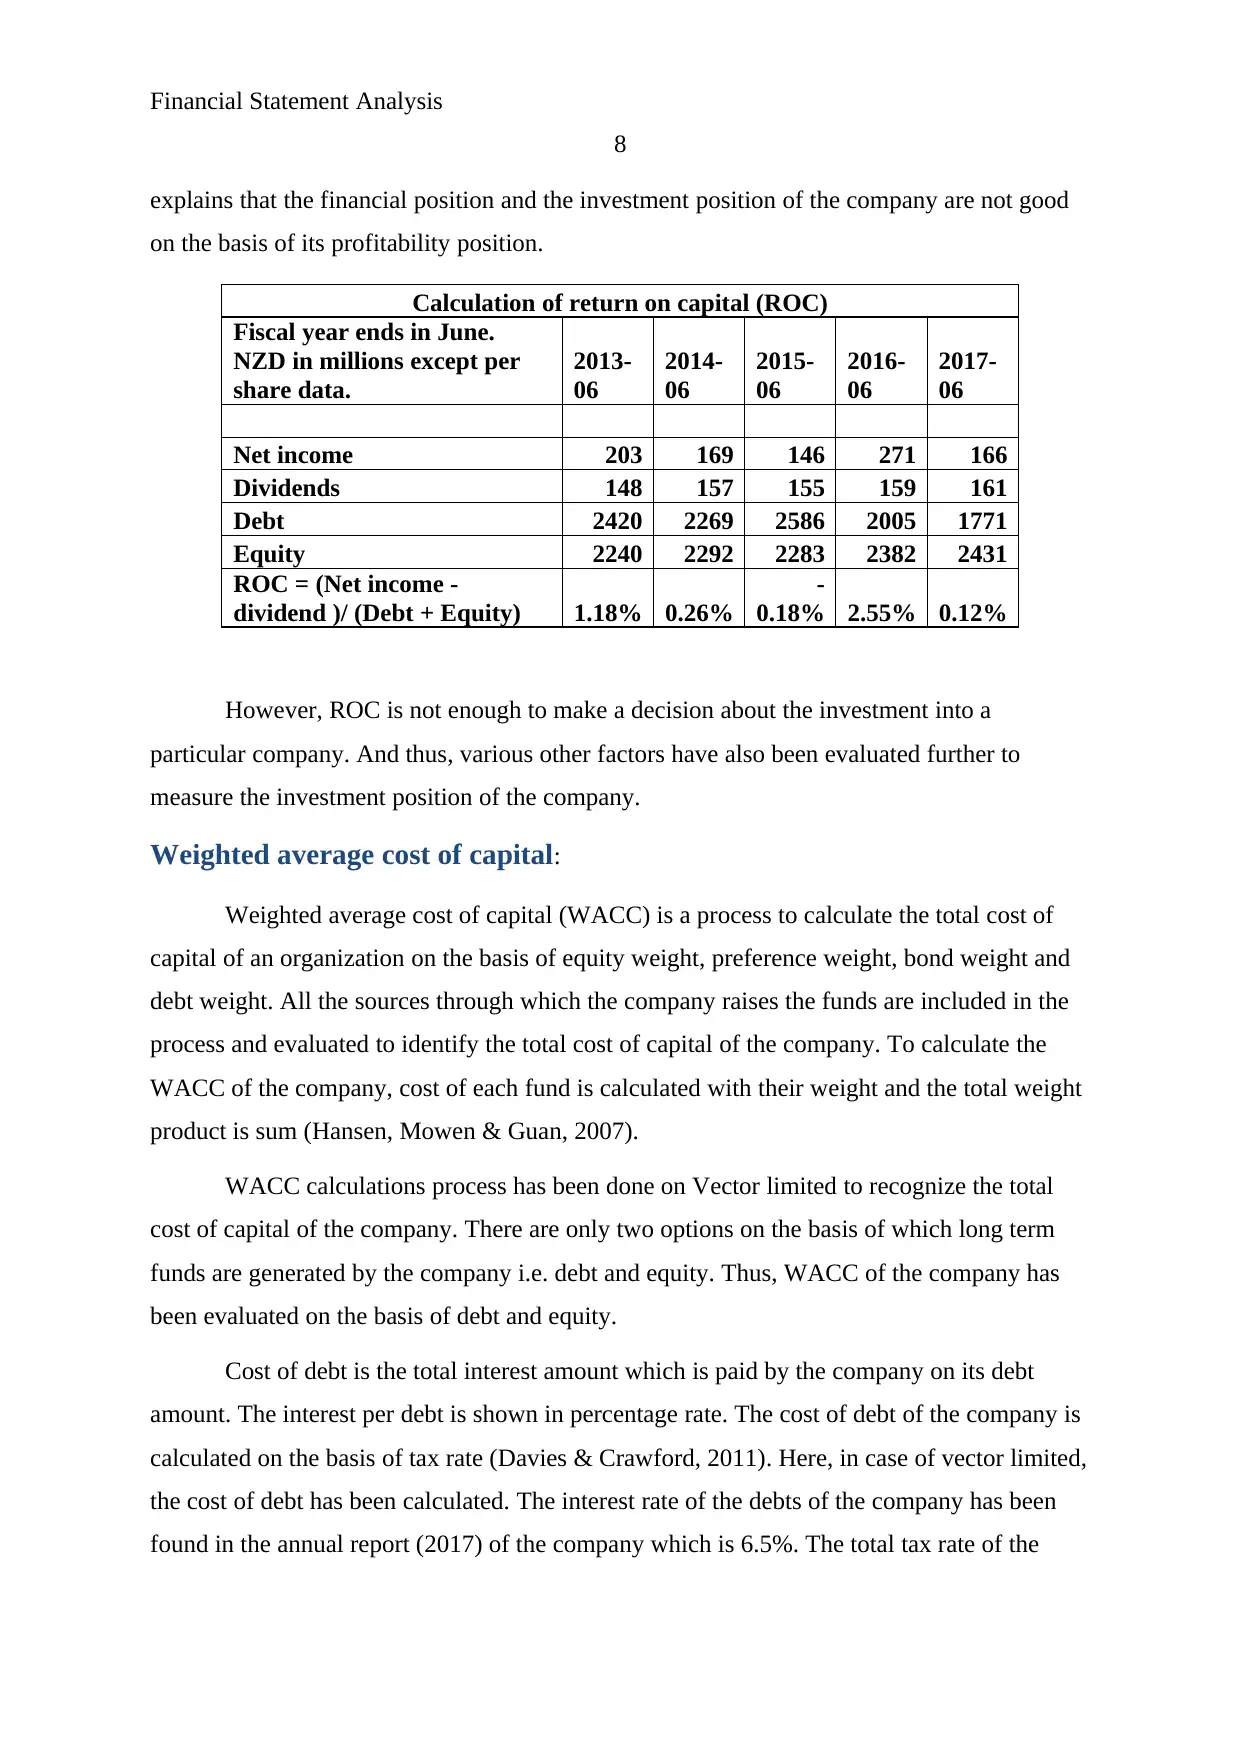
explains that the financial position and the investment position of the company are not good
on the basis of its profitability position.
Calculation of return on capital (ROC)
Fiscal year ends in June.
NZD in millions except per
share data.
2013-
06
2014-
06
2015-
06
2016-
06
2017-
06
Net income 203 169 146 271 166
Dividends 148 157 155 159 161
Debt 2420 2269 2586 2005 1771
Equity 2240 2292 2283 2382 2431
ROC = (Net income -
dividend )/ (Debt + Equity) 1.18% 0.26%
-
0.18% 2.55% 0.12%
However, ROC is not enough to make a decision about the investment into a
particular company. And thus, various other factors have also been evaluated further to
measure the investment position of the company.
Weighted average cost of capital:
Weighted average cost of capital (WACC) is a process to calculate the total cost of
capital of an organization on the basis of equity weight, preference weight, bond weight and
debt weight. All the sources through which the company raises the funds are included in the
process and evaluated to identify the total cost of capital of the company. To calculate the
WACC of the company, cost of each fund is calculated with their weight and the total weight
product is sum (Hansen, Mowen & Guan, 2007).
WACC calculations process has been done on Vector limited to recognize the total
cost of capital of the company. There are only two options on the basis of which long term
funds are generated by the company i.e. debt and equity. Thus, WACC of the company has
been evaluated on the basis of debt and equity.
Cost of debt is the total interest amount which is paid by the company on its debt
amount. The interest per debt is shown in percentage rate. The cost of debt of the company is
calculated on the basis of tax rate (Davies & Crawford, 2011). Here, in case of vector limited,
the cost of debt has been calculated. The interest rate of the debts of the company has been
found in the annual report (2017) of the company which is 6.5%. The total tax rate of the
8
explains that the financial position and the investment position of the company are not good
on the basis of its profitability position.
Calculation of return on capital (ROC)
Fiscal year ends in June.
NZD in millions except per
share data.
2013-
06
2014-
06
2015-
06
2016-
06
2017-
06
Net income 203 169 146 271 166
Dividends 148 157 155 159 161
Debt 2420 2269 2586 2005 1771
Equity 2240 2292 2283 2382 2431
ROC = (Net income -
dividend )/ (Debt + Equity) 1.18% 0.26%
-
0.18% 2.55% 0.12%
However, ROC is not enough to make a decision about the investment into a
particular company. And thus, various other factors have also been evaluated further to
measure the investment position of the company.
Weighted average cost of capital:
Weighted average cost of capital (WACC) is a process to calculate the total cost of
capital of an organization on the basis of equity weight, preference weight, bond weight and
debt weight. All the sources through which the company raises the funds are included in the
process and evaluated to identify the total cost of capital of the company. To calculate the
WACC of the company, cost of each fund is calculated with their weight and the total weight
product is sum (Hansen, Mowen & Guan, 2007).
WACC calculations process has been done on Vector limited to recognize the total
cost of capital of the company. There are only two options on the basis of which long term
funds are generated by the company i.e. debt and equity. Thus, WACC of the company has
been evaluated on the basis of debt and equity.
Cost of debt is the total interest amount which is paid by the company on its debt
amount. The interest per debt is shown in percentage rate. The cost of debt of the company is
calculated on the basis of tax rate (Davies & Crawford, 2011). Here, in case of vector limited,
the cost of debt has been calculated. The interest rate of the debts of the company has been
found in the annual report (2017) of the company which is 6.5%. The total tax rate of the
Financial Statement Analysis
9
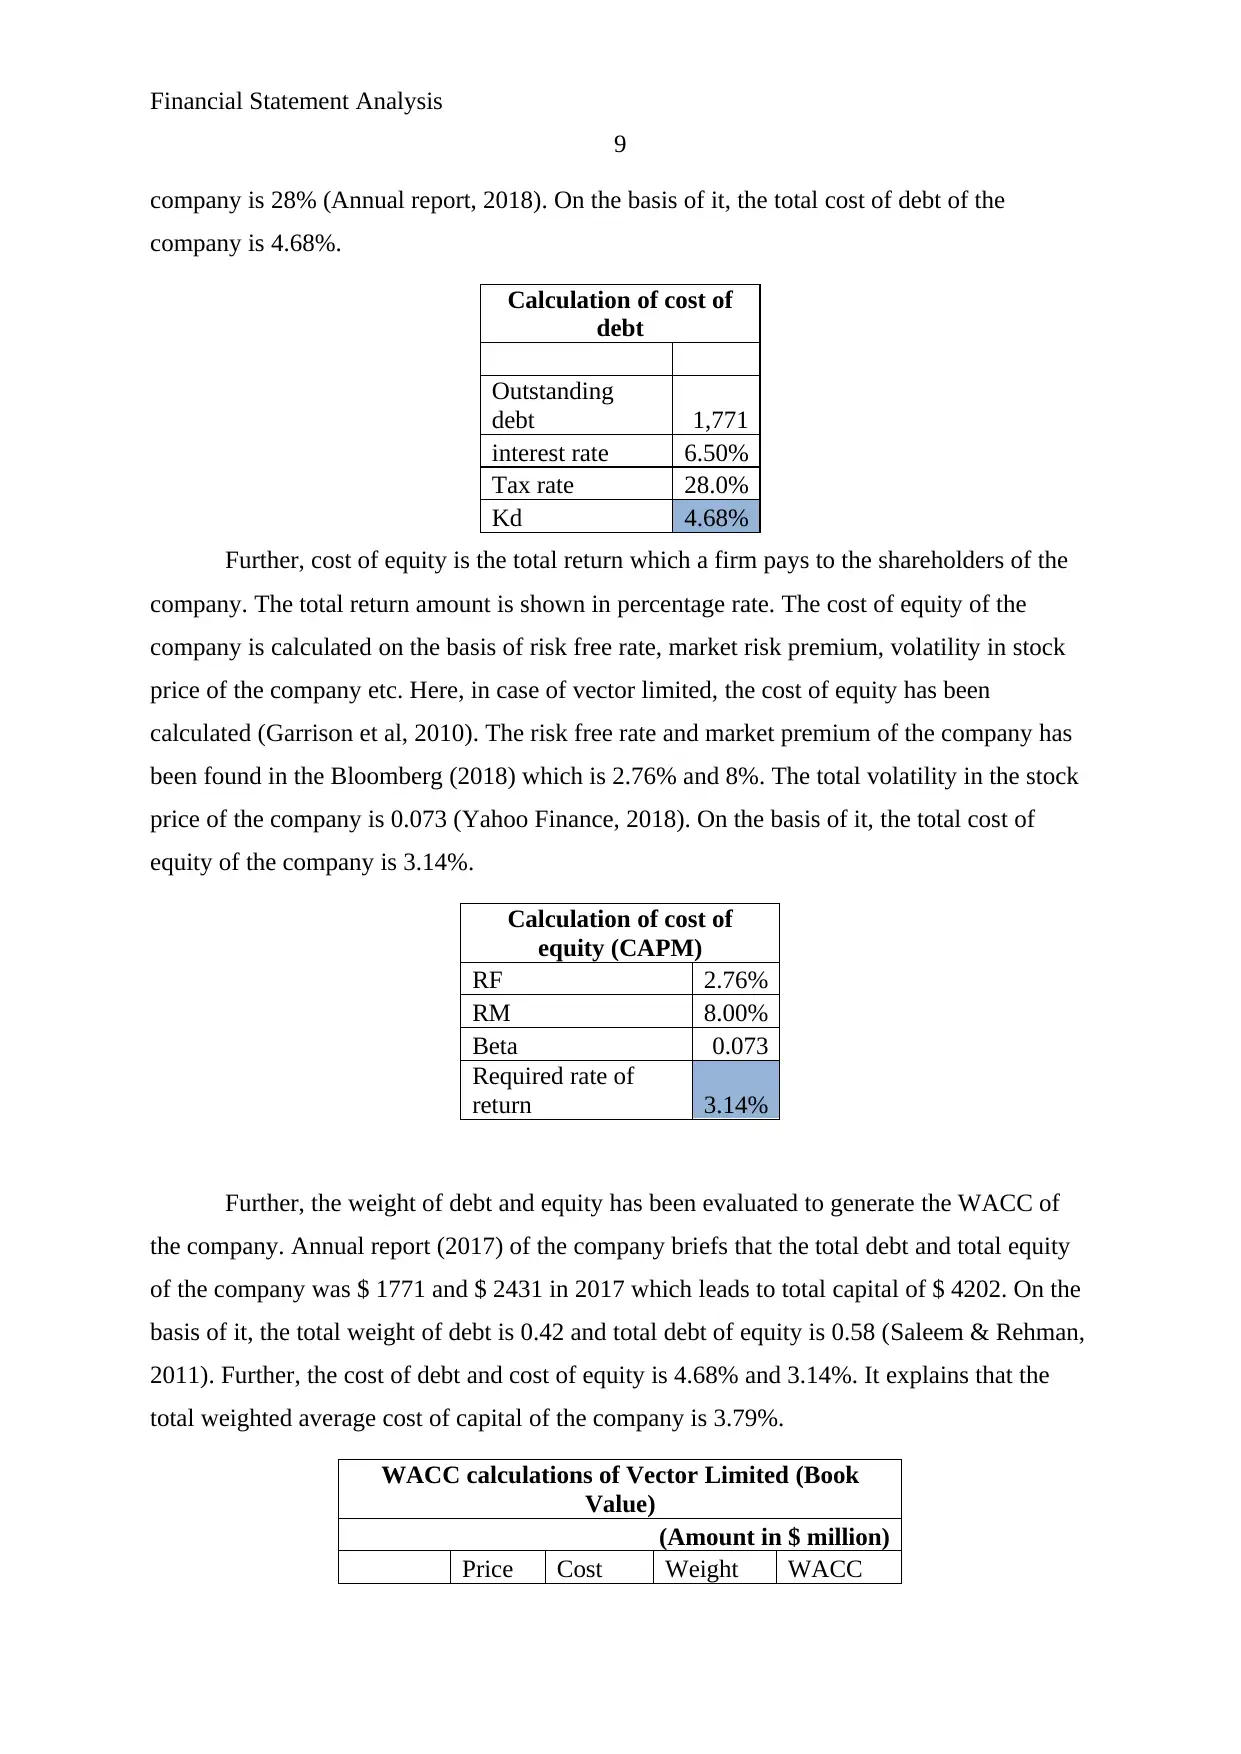
company is 28% (Annual report, 2018). On the basis of it, the total cost of debt of the
company is 4.68%.
Calculation of cost of
debt
Outstanding
debt 1,771
interest rate 6.50%
Tax rate 28.0%
Kd 4.68%
Further, cost of equity is the total return which a firm pays to the shareholders of the
company. The total return amount is shown in percentage rate. The cost of equity of the
company is calculated on the basis of risk free rate, market risk premium, volatility in stock
price of the company etc. Here, in case of vector limited, the cost of equity has been
calculated (Garrison et al, 2010). The risk free rate and market premium of the company has
been found in the Bloomberg (2018) which is 2.76% and 8%. The total volatility in the stock
price of the company is 0.073 (Yahoo Finance, 2018). On the basis of it, the total cost of
equity of the company is 3.14%.
Calculation of cost of
equity (CAPM)
RF 2.76%
RM 8.00%
Beta 0.073
Required rate of
return 3.14%
Further, the weight of debt and equity has been evaluated to generate the WACC of
the company. Annual report (2017) of the company briefs that the total debt and total equity
of the company was $ 1771 and $ 2431 in 2017 which leads to total capital of $ 4202. On the
basis of it, the total weight of debt is 0.42 and total debt of equity is 0.58 (Saleem & Rehman,
2011). Further, the cost of debt and cost of equity is 4.68% and 3.14%. It explains that the
total weighted average cost of capital of the company is 3.79%.
WACC calculations of Vector Limited (Book
Value)
(Amount in $ million)
Price Cost Weight WACC
9
company is 28% (Annual report, 2018). On the basis of it, the total cost of debt of the
company is 4.68%.
Calculation of cost of
debt
Outstanding
debt 1,771
interest rate 6.50%
Tax rate 28.0%
Kd 4.68%
Further, cost of equity is the total return which a firm pays to the shareholders of the
company. The total return amount is shown in percentage rate. The cost of equity of the
company is calculated on the basis of risk free rate, market risk premium, volatility in stock
price of the company etc. Here, in case of vector limited, the cost of equity has been
calculated (Garrison et al, 2010). The risk free rate and market premium of the company has
been found in the Bloomberg (2018) which is 2.76% and 8%. The total volatility in the stock
price of the company is 0.073 (Yahoo Finance, 2018). On the basis of it, the total cost of
equity of the company is 3.14%.
Calculation of cost of
equity (CAPM)
RF 2.76%
RM 8.00%
Beta 0.073
Required rate of
return 3.14%
Further, the weight of debt and equity has been evaluated to generate the WACC of
the company. Annual report (2017) of the company briefs that the total debt and total equity
of the company was $ 1771 and $ 2431 in 2017 which leads to total capital of $ 4202. On the
basis of it, the total weight of debt is 0.42 and total debt of equity is 0.58 (Saleem & Rehman,
2011). Further, the cost of debt and cost of equity is 4.68% and 3.14%. It explains that the
total weighted average cost of capital of the company is 3.79%.
WACC calculations of Vector Limited (Book
Value)
(Amount in $ million)
Price Cost Weight WACC
Financial Statement Analysis
10
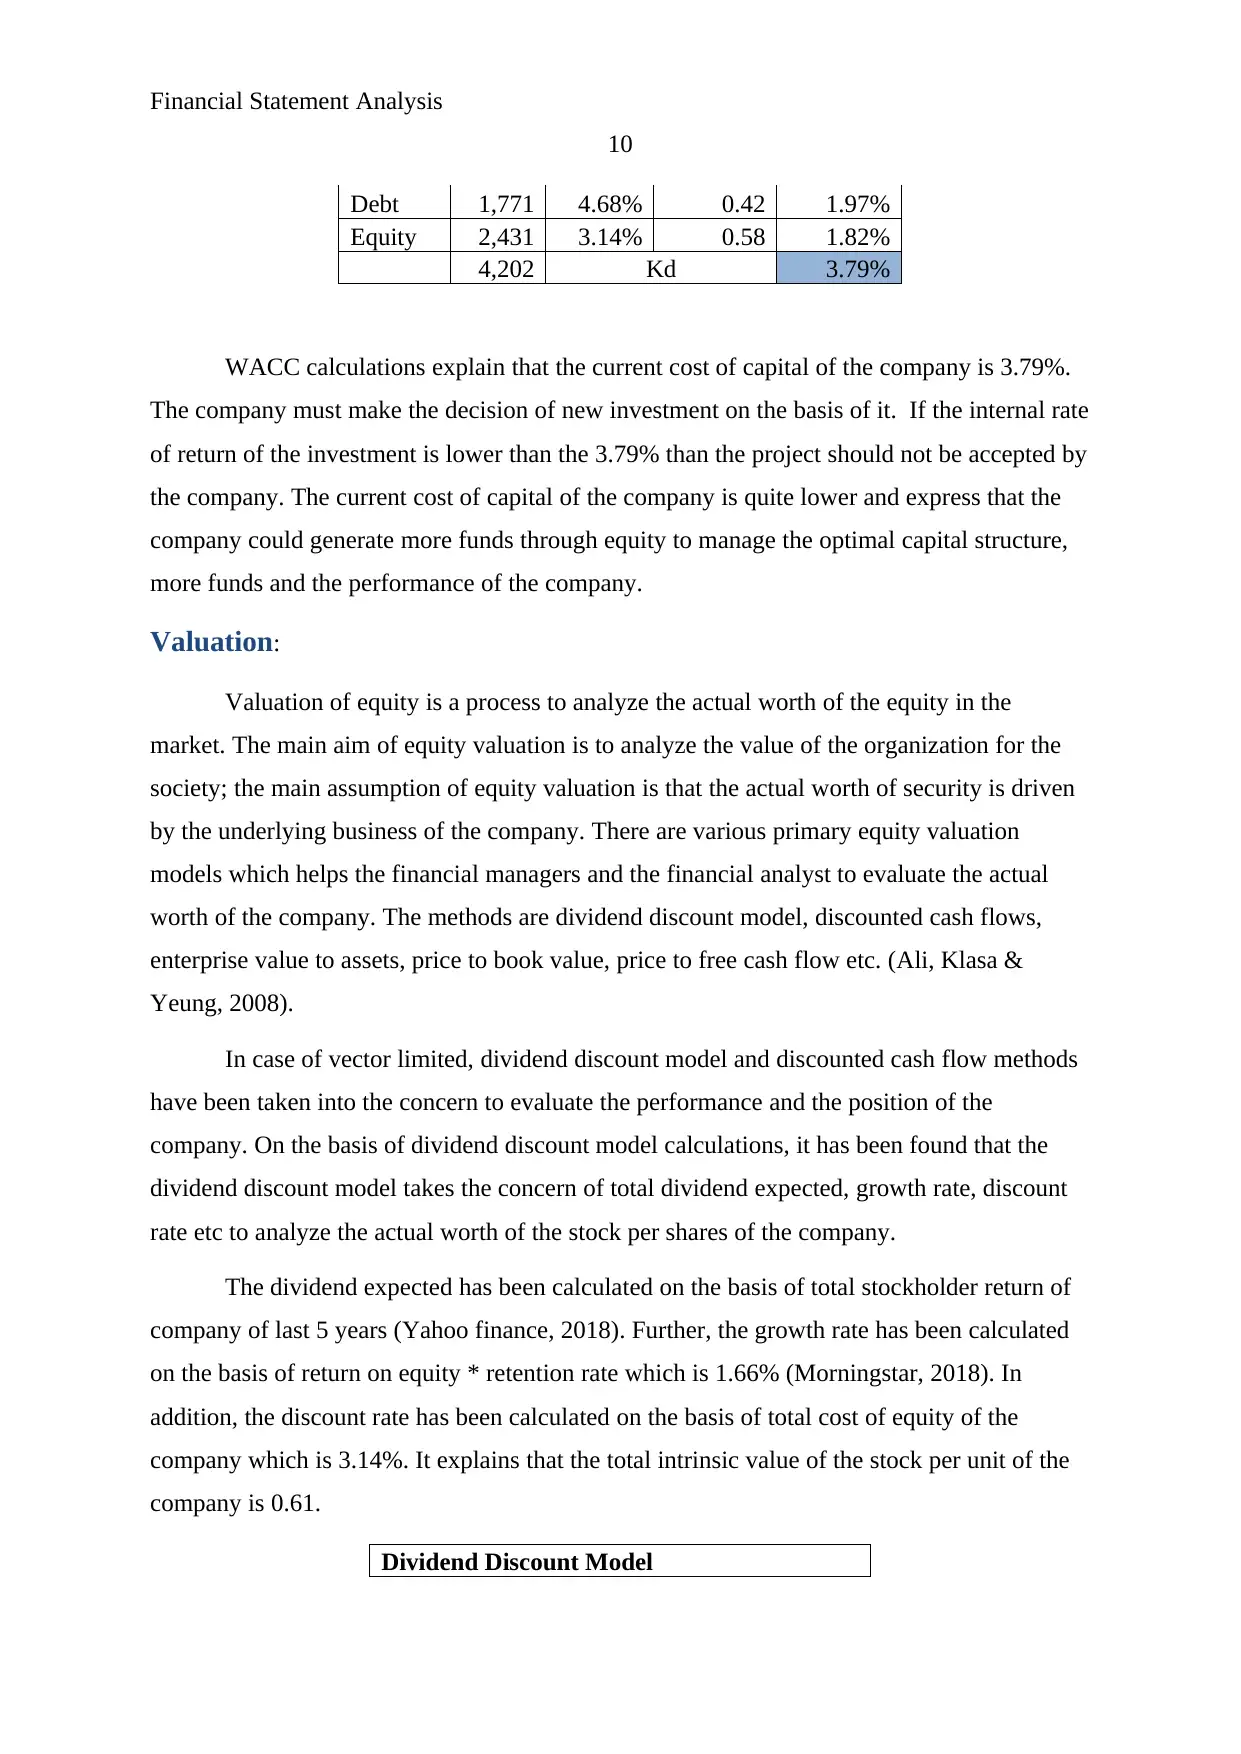
Debt 1,771 4.68% 0.42 1.97%
Equity 2,431 3.14% 0.58 1.82%
4,202 Kd 3.79%
WACC calculations explain that the current cost of capital of the company is 3.79%.
The company must make the decision of new investment on the basis of it. If the internal rate
of return of the investment is lower than the 3.79% than the project should not be accepted by
the company. The current cost of capital of the company is quite lower and express that the
company could generate more funds through equity to manage the optimal capital structure,
more funds and the performance of the company.
Valuation:
Valuation of equity is a process to analyze the actual worth of the equity in the
market. The main aim of equity valuation is to analyze the value of the organization for the
society; the main assumption of equity valuation is that the actual worth of security is driven
by the underlying business of the company. There are various primary equity valuation
models which helps the financial managers and the financial analyst to evaluate the actual
worth of the company. The methods are dividend discount model, discounted cash flows,
enterprise value to assets, price to book value, price to free cash flow etc. (Ali, Klasa &
Yeung, 2008).
In case of vector limited, dividend discount model and discounted cash flow methods
have been taken into the concern to evaluate the performance and the position of the
company. On the basis of dividend discount model calculations, it has been found that the
dividend discount model takes the concern of total dividend expected, growth rate, discount
rate etc to analyze the actual worth of the stock per shares of the company.
The dividend expected has been calculated on the basis of total stockholder return of
company of last 5 years (Yahoo finance, 2018). Further, the growth rate has been calculated
on the basis of return on equity * retention rate which is 1.66% (Morningstar, 2018). In
addition, the discount rate has been calculated on the basis of total cost of equity of the
company which is 3.14%. It explains that the total intrinsic value of the stock per unit of the
company is 0.61.
Dividend Discount Model
10
Debt 1,771 4.68% 0.42 1.97%
Equity 2,431 3.14% 0.58 1.82%
4,202 Kd 3.79%
WACC calculations explain that the current cost of capital of the company is 3.79%.
The company must make the decision of new investment on the basis of it. If the internal rate
of return of the investment is lower than the 3.79% than the project should not be accepted by
the company. The current cost of capital of the company is quite lower and express that the
company could generate more funds through equity to manage the optimal capital structure,
more funds and the performance of the company.
Valuation:
Valuation of equity is a process to analyze the actual worth of the equity in the
market. The main aim of equity valuation is to analyze the value of the organization for the
society; the main assumption of equity valuation is that the actual worth of security is driven
by the underlying business of the company. There are various primary equity valuation
models which helps the financial managers and the financial analyst to evaluate the actual
worth of the company. The methods are dividend discount model, discounted cash flows,
enterprise value to assets, price to book value, price to free cash flow etc. (Ali, Klasa &
Yeung, 2008).
In case of vector limited, dividend discount model and discounted cash flow methods
have been taken into the concern to evaluate the performance and the position of the
company. On the basis of dividend discount model calculations, it has been found that the
dividend discount model takes the concern of total dividend expected, growth rate, discount
rate etc to analyze the actual worth of the stock per shares of the company.
The dividend expected has been calculated on the basis of total stockholder return of
company of last 5 years (Yahoo finance, 2018). Further, the growth rate has been calculated
on the basis of return on equity * retention rate which is 1.66% (Morningstar, 2018). In
addition, the discount rate has been calculated on the basis of total cost of equity of the
company which is 3.14%. It explains that the total intrinsic value of the stock per unit of the
company is 0.61.
Dividend Discount Model
Secure Best Marks with AI Grader
Need help grading? Try our AI Grader for instant feedback on your assignments.
Financial Statement Analysis
11
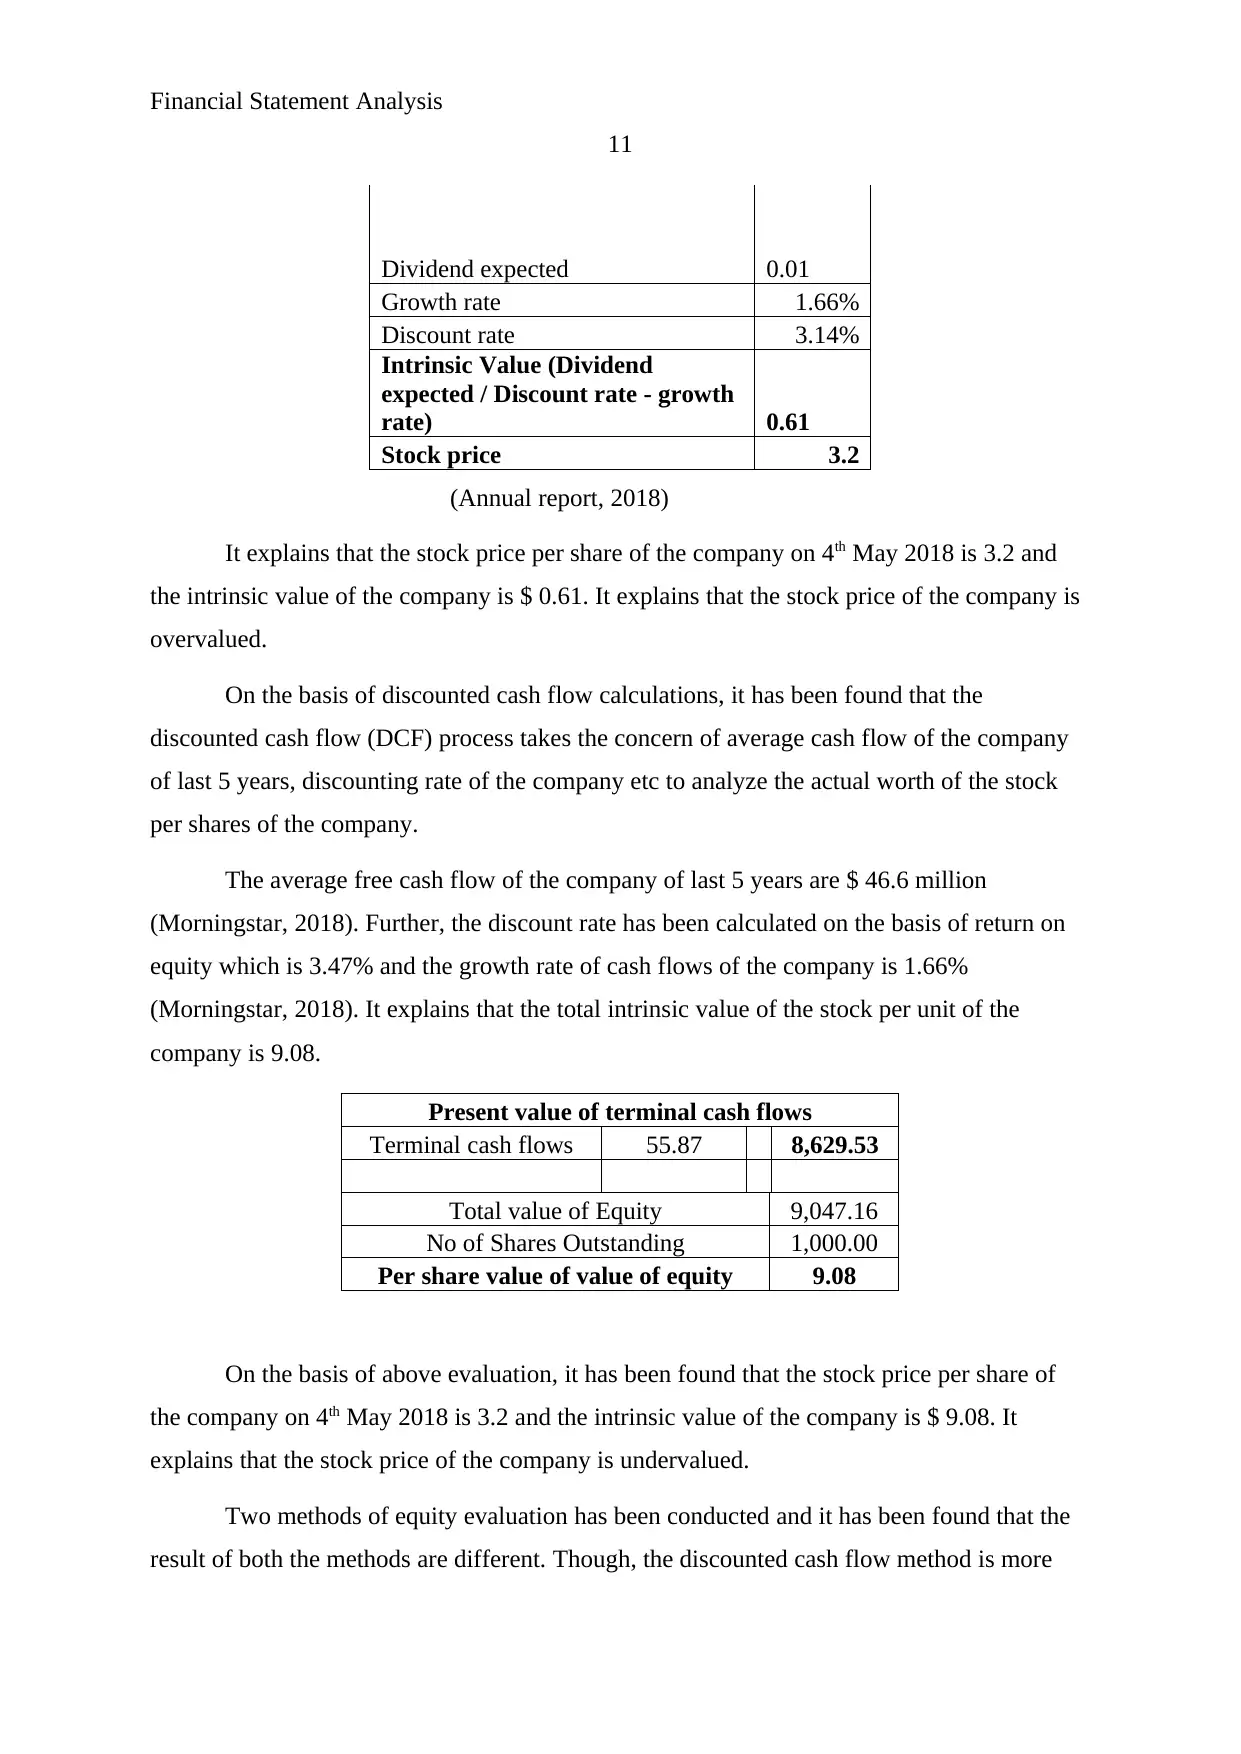
Dividend expected 0.01
Growth rate 1.66%
Discount rate 3.14%
Intrinsic Value (Dividend
expected / Discount rate - growth
rate) 0.61
Stock price 3.2
(Annual report, 2018)
It explains that the stock price per share of the company on 4th May 2018 is 3.2 and
the intrinsic value of the company is $ 0.61. It explains that the stock price of the company is
overvalued.
On the basis of discounted cash flow calculations, it has been found that the
discounted cash flow (DCF) process takes the concern of average cash flow of the company
of last 5 years, discounting rate of the company etc to analyze the actual worth of the stock
per shares of the company.
The average free cash flow of the company of last 5 years are $ 46.6 million
(Morningstar, 2018). Further, the discount rate has been calculated on the basis of return on
equity which is 3.47% and the growth rate of cash flows of the company is 1.66%
(Morningstar, 2018). It explains that the total intrinsic value of the stock per unit of the
company is 9.08.
Present value of terminal cash flows
Terminal cash flows 55.87 8,629.53
Total value of Equity 9,047.16
No of Shares Outstanding 1,000.00
Per share value of value of equity 9.08
On the basis of above evaluation, it has been found that the stock price per share of
the company on 4th May 2018 is 3.2 and the intrinsic value of the company is $ 9.08. It
explains that the stock price of the company is undervalued.
Two methods of equity evaluation has been conducted and it has been found that the
result of both the methods are different. Though, the discounted cash flow method is more
11
Dividend expected 0.01
Growth rate 1.66%
Discount rate 3.14%
Intrinsic Value (Dividend
expected / Discount rate - growth
rate) 0.61
Stock price 3.2
(Annual report, 2018)
It explains that the stock price per share of the company on 4th May 2018 is 3.2 and
the intrinsic value of the company is $ 0.61. It explains that the stock price of the company is
overvalued.
On the basis of discounted cash flow calculations, it has been found that the
discounted cash flow (DCF) process takes the concern of average cash flow of the company
of last 5 years, discounting rate of the company etc to analyze the actual worth of the stock
per shares of the company.
The average free cash flow of the company of last 5 years are $ 46.6 million
(Morningstar, 2018). Further, the discount rate has been calculated on the basis of return on
equity which is 3.47% and the growth rate of cash flows of the company is 1.66%
(Morningstar, 2018). It explains that the total intrinsic value of the stock per unit of the
company is 9.08.
Present value of terminal cash flows
Terminal cash flows 55.87 8,629.53
Total value of Equity 9,047.16
No of Shares Outstanding 1,000.00
Per share value of value of equity 9.08
On the basis of above evaluation, it has been found that the stock price per share of
the company on 4th May 2018 is 3.2 and the intrinsic value of the company is $ 9.08. It
explains that the stock price of the company is undervalued.
Two methods of equity evaluation has been conducted and it has been found that the
result of both the methods are different. Though, the discounted cash flow method is more
Financial Statement Analysis
12
reliable as it takes the concern of historical data of the company and the current trends of the
company together (Zellweger & Nason, 2008). Thus, the stock price of the company is
undervalued and this is the right time to make investment into the company.
Summary and conclusion:
The above study brief about the financial position and non financial position of
Vector limited to reach over a conclusion about the performance of the company. On the
basis of financial analysis and return on capital of the company, it has been found that the
investment into the company would offer huge loss. However, the stock evaluation explains
that the market position of the company is quite better and thus the investment into the
security of the company would offer huge return at the time of selling the security. So, it is
concluded that the investors should invest into the company for great profits; the dividends of
the company are not good but the investment into the company would offer huge profit at the
time of selling the security. Thus the investors should invest into the security of the company.
Financial Statement Analysis
13
References:
About us. (2018). Vector Limited. (Online). Retrieved on 6th May 2018 from:
https://www.vector.co.nz/about-us.
Ali, A., Klasa, S., & Yeung, E. (2008). The limitations of industry concentration measures
constructed with Compustat data: Implications for finance research. The Review of
Financial Studies, 22(10), 3839-3871.
Annual report. (2018). Vector Limited. (Online). Retrieved on 6th May 2018 from:
https://vectorwebstoreprd.blob.core.windows.net/blob/vector/media/vector-regulatory-
disclosures/annualreportvec173_ar2017_web_final.pdf.
Bloomberg. (2018). Rates and bonds. (Online). Retrieved on 6th May 2018 from:
https://www.bloomberg.com/markets/rates-bonds.
Davies, T. & Crawford, I., (2011). Business accounting and finance. Pearson.
Diversity and inclusion. (2018). Vector Limited. (Online). Retrieved on 6th May 2018 from:
https://www.vector.co.nz/about-us/diversity-and-inclusion.
Garrison, R. H., Noreen, E. W., Brewer, P. C., & McGowan, A. (2010). Managerial
accounting. Issues in Accounting Education, 25(4), 792-793.
Hansen, D., Mowen, M. & Guan, L., (2007). Cost management: accounting and control.
Cengage Learning.
Hillier, D., Grinblatt, M. & Titman, S., (2011). Financial markets and corporate strategy.
McGraw Hill.
Morninsgtar. (2018). Vector Limited. (Online). Retrieved on 6th May 2018 from:
http://financials.morningstar.com/balance-sheet/bs.html?
t=VCT®ion=nzl&culture=en-US.
Our Approach. (2018). Vector Limited. (Online). Retrieved on 6th May 2018 from:
https://www.vector.co.nz/personal/help-safety/our-approach.
Saleem, Q., & Rehman, R. U. (2011). Impacts of liquidity ratios on
profitability. Interdisciplinary Journal of Research in Business, 1(7), 95-98.
Paraphrase This Document
Need a fresh take? Get an instant paraphrase of this document with our AI Paraphraser
Financial Statement Analysis
14
Snyder, H. & Davenport, E., (2013). What does it really cost? Allocating indirect costs. Asian
Libraries.
Weygandt, J. J., Kimmel, P. D., & Kieso, D. E. (2015). Financial & Managerial Accounting.
John Wiley & Sons.
Yahoo Finance. (2018). Vector Limited. (Online). Retrieved on 6th May 2018 from:
https://finance.yahoo.com/quote/VCT.NZ/history?
period1=1367778600&period2=1525545000&interval=1mo&filter=history&frequency
=1mo.
Zellweger, T. M., & Nason, R. S. (2008). A stakeholder perspective on family firm
performance. Family Business Review, 21(3), 203-216.
Financial Statement Analysis
15
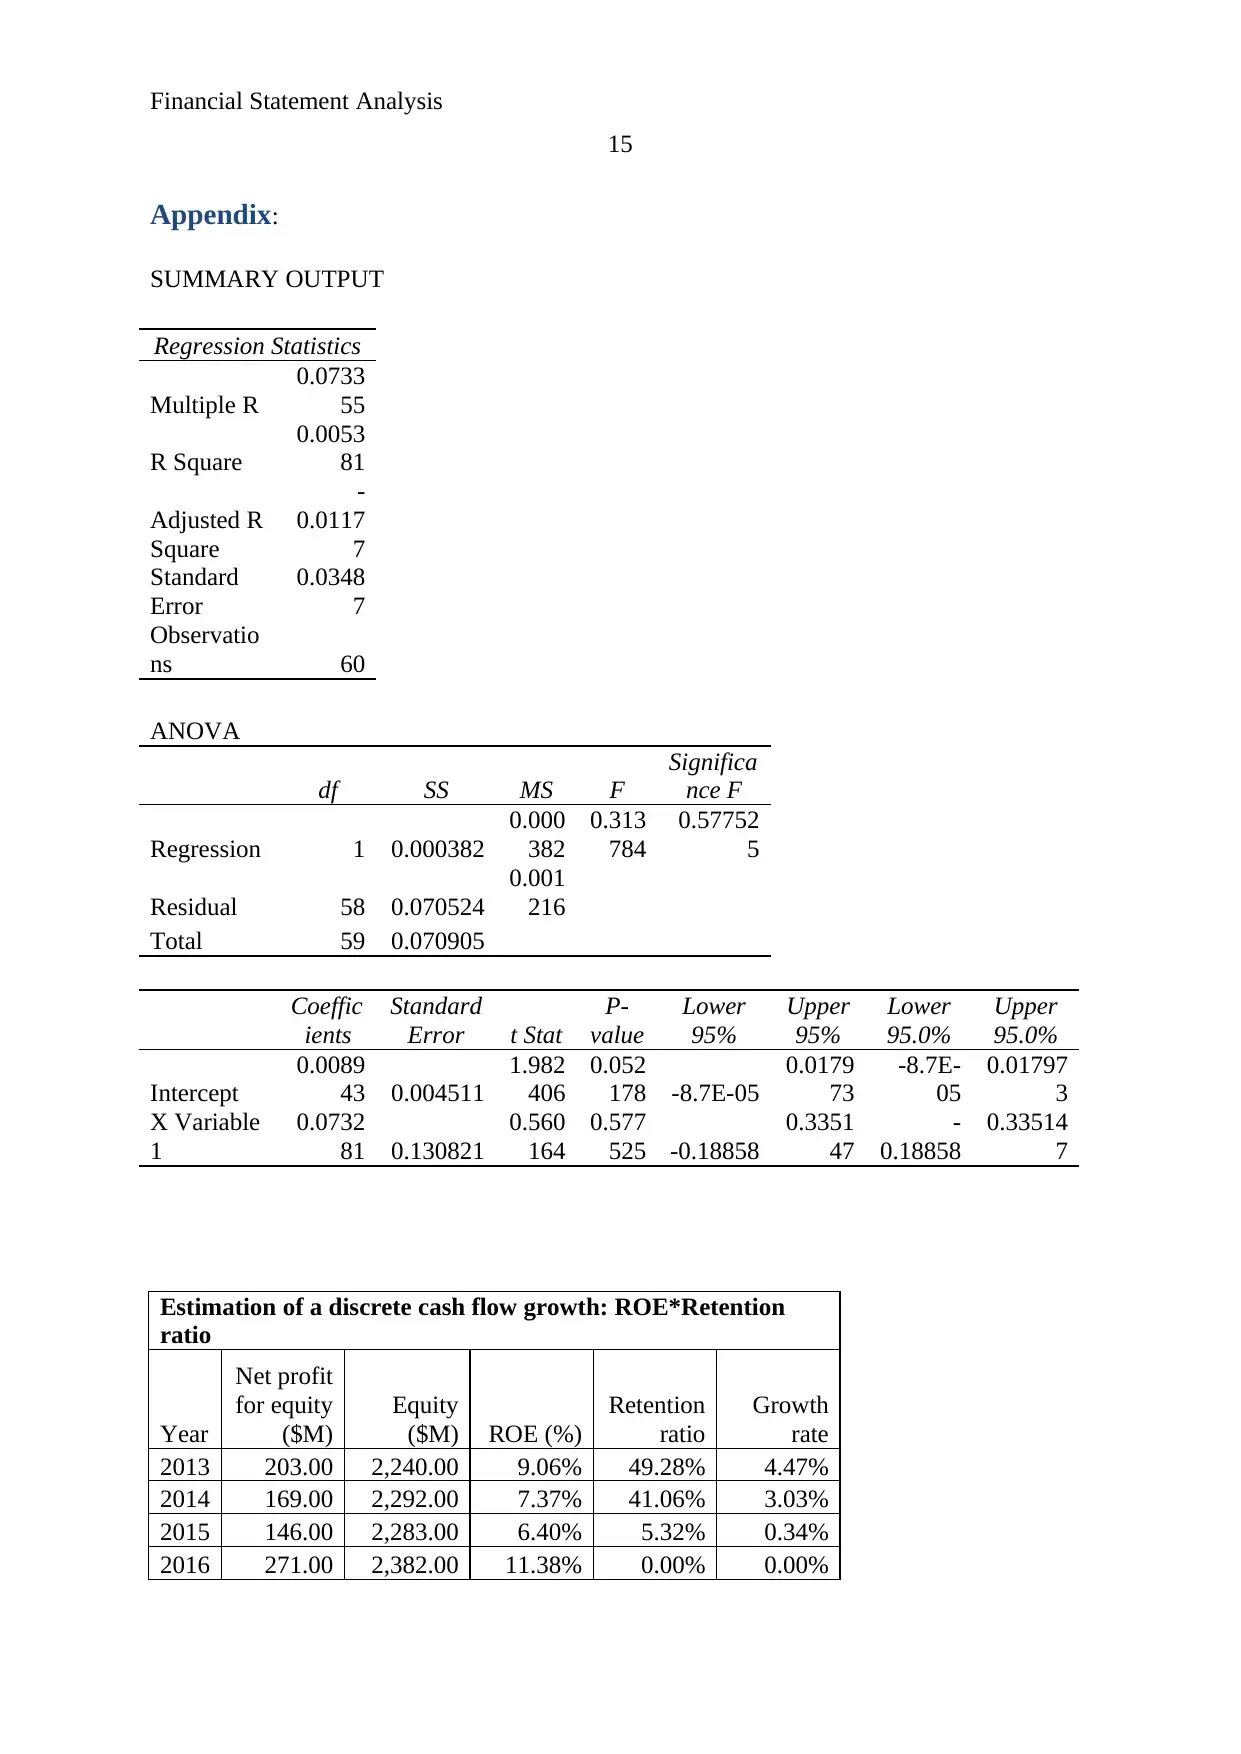
Appendix:
SUMMARY OUTPUT
Regression Statistics
Multiple R
0.0733
55
R Square
0.0053
81
Adjusted R
Square
-
0.0117
7
Standard
Error
0.0348
7
Observatio
ns 60
ANOVA
df SS MS F
Significa
nce F
Regression 1 0.000382
0.000
382
0.313
784
0.57752
5
Residual 58 0.070524
0.001
216
Total 59 0.070905
Coeffic
ients
Standard
Error t Stat
P-
value
Lower
95%
Upper
95%
Lower
95.0%
Upper
95.0%
Intercept
0.0089
43 0.004511
1.982
406
0.052
178 -8.7E-05
0.0179
73
-8.7E-
05
0.01797
3
X Variable
1
0.0732
81 0.130821
0.560
164
0.577
525 -0.18858
0.3351
47
-
0.18858
0.33514
7
Estimation of a discrete cash flow growth: ROE*Retention
ratio
Year
Net profit
for equity
($M)
Equity
($M) ROE (%)
Retention
ratio
Growth
rate
2013 203.00 2,240.00 9.06% 49.28% 4.47%
2014 169.00 2,292.00 7.37% 41.06% 3.03%
2015 146.00 2,283.00 6.40% 5.32% 0.34%
2016 271.00 2,382.00 11.38% 0.00% 0.00%
15
Appendix:
SUMMARY OUTPUT
Regression Statistics
Multiple R
0.0733
55
R Square
0.0053
81
Adjusted R
Square
-
0.0117
7
Standard
Error
0.0348
7
Observatio
ns 60
ANOVA
df SS MS F
Significa
nce F
Regression 1 0.000382
0.000
382
0.313
784
0.57752
5
Residual 58 0.070524
0.001
216
Total 59 0.070905
Coeffic
ients
Standard
Error t Stat
P-
value
Lower
95%
Upper
95%
Lower
95.0%
Upper
95.0%
Intercept
0.0089
43 0.004511
1.982
406
0.052
178 -8.7E-05
0.0179
73
-8.7E-
05
0.01797
3
X Variable
1
0.0732
81 0.130821
0.560
164
0.577
525 -0.18858
0.3351
47
-
0.18858
0.33514
7
Estimation of a discrete cash flow growth: ROE*Retention
ratio
Year
Net profit
for equity
($M)
Equity
($M) ROE (%)
Retention
ratio
Growth
rate
2013 203.00 2,240.00 9.06% 49.28% 4.47%
2014 169.00 2,292.00 7.37% 41.06% 3.03%
2015 146.00 2,283.00 6.40% 5.32% 0.34%
2016 271.00 2,382.00 11.38% 0.00% 0.00%
Financial Statement Analysis
16
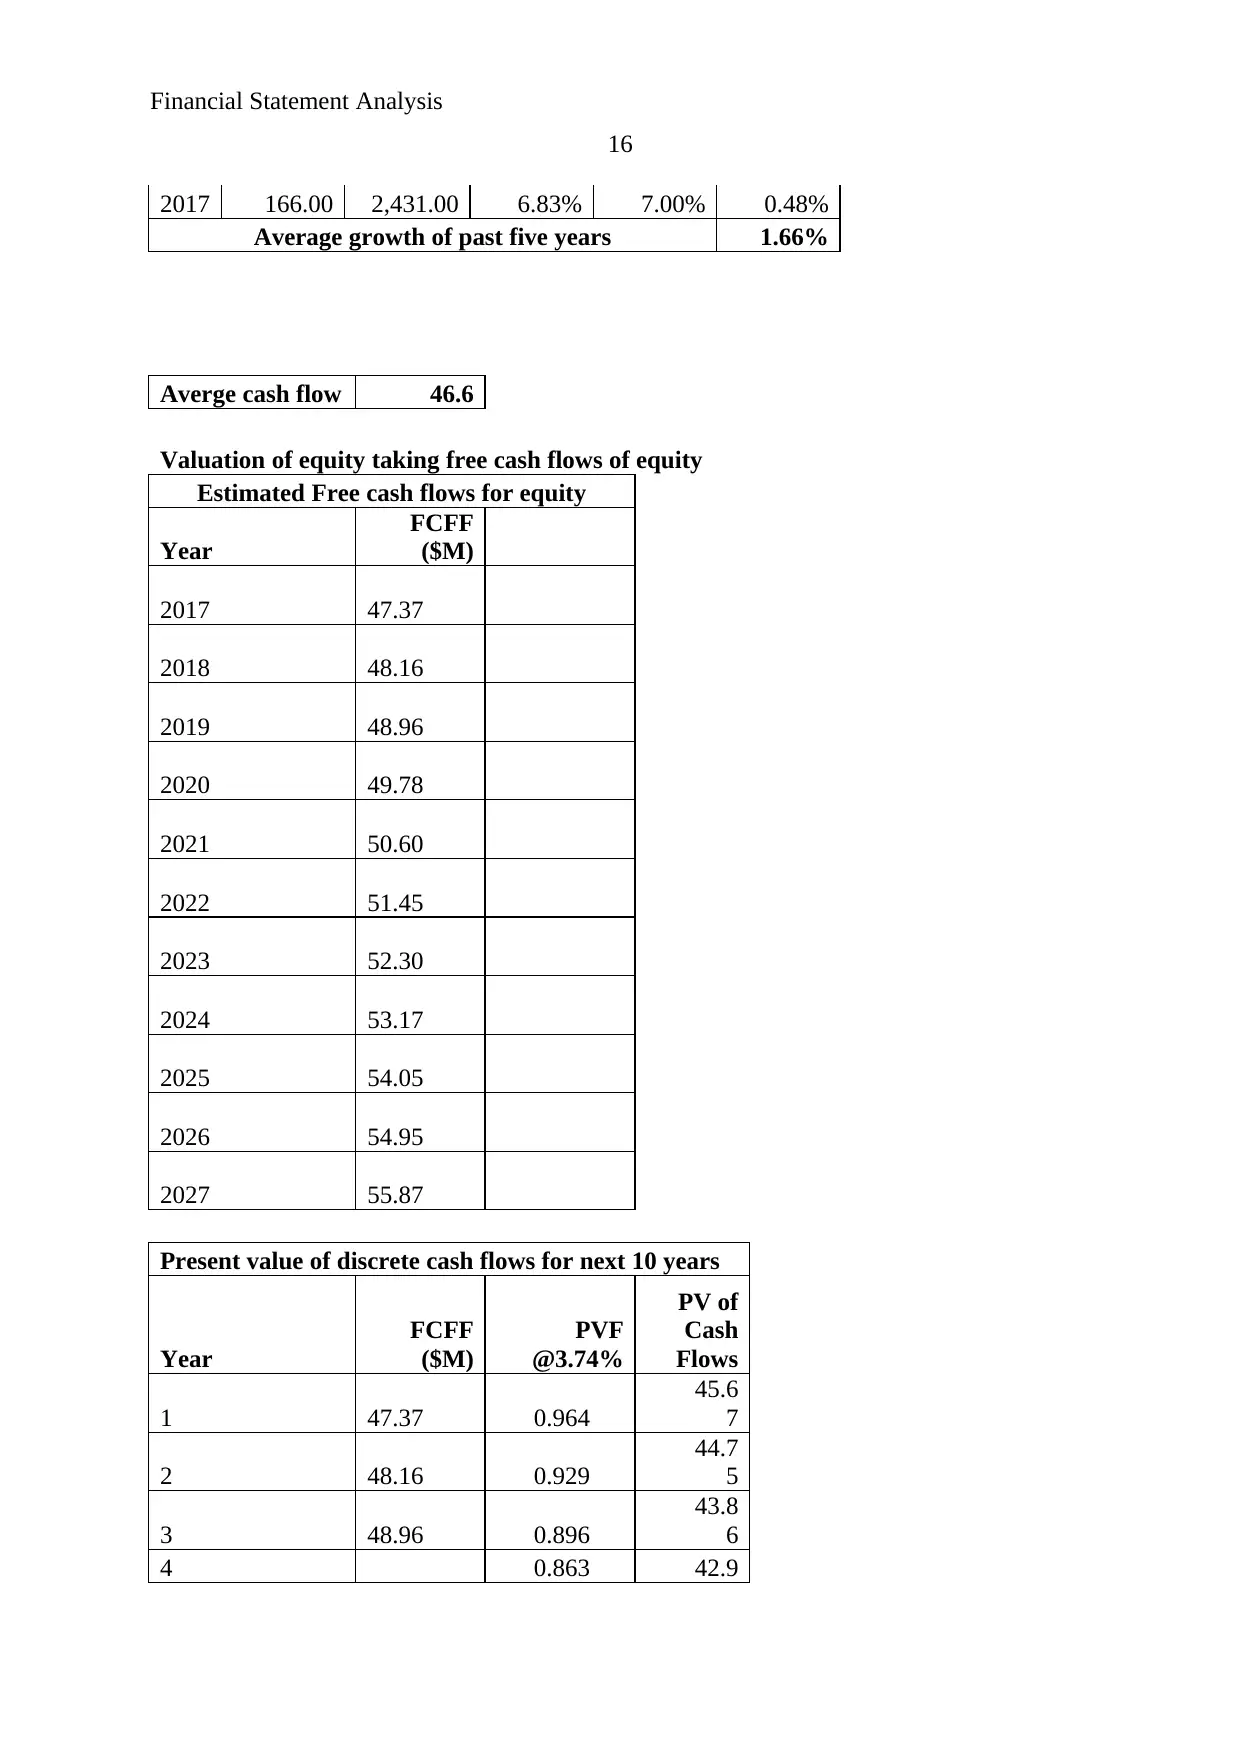
2017 166.00 2,431.00 6.83% 7.00% 0.48%
Average growth of past five years 1.66%
Averge cash flow 46.6
Valuation of equity taking free cash flows of equity
Estimated Free cash flows for equity
Year
FCFF
($M)
2017 47.37
2018 48.16
2019 48.96
2020 49.78
2021 50.60
2022 51.45
2023 52.30
2024 53.17
2025 54.05
2026 54.95
2027 55.87
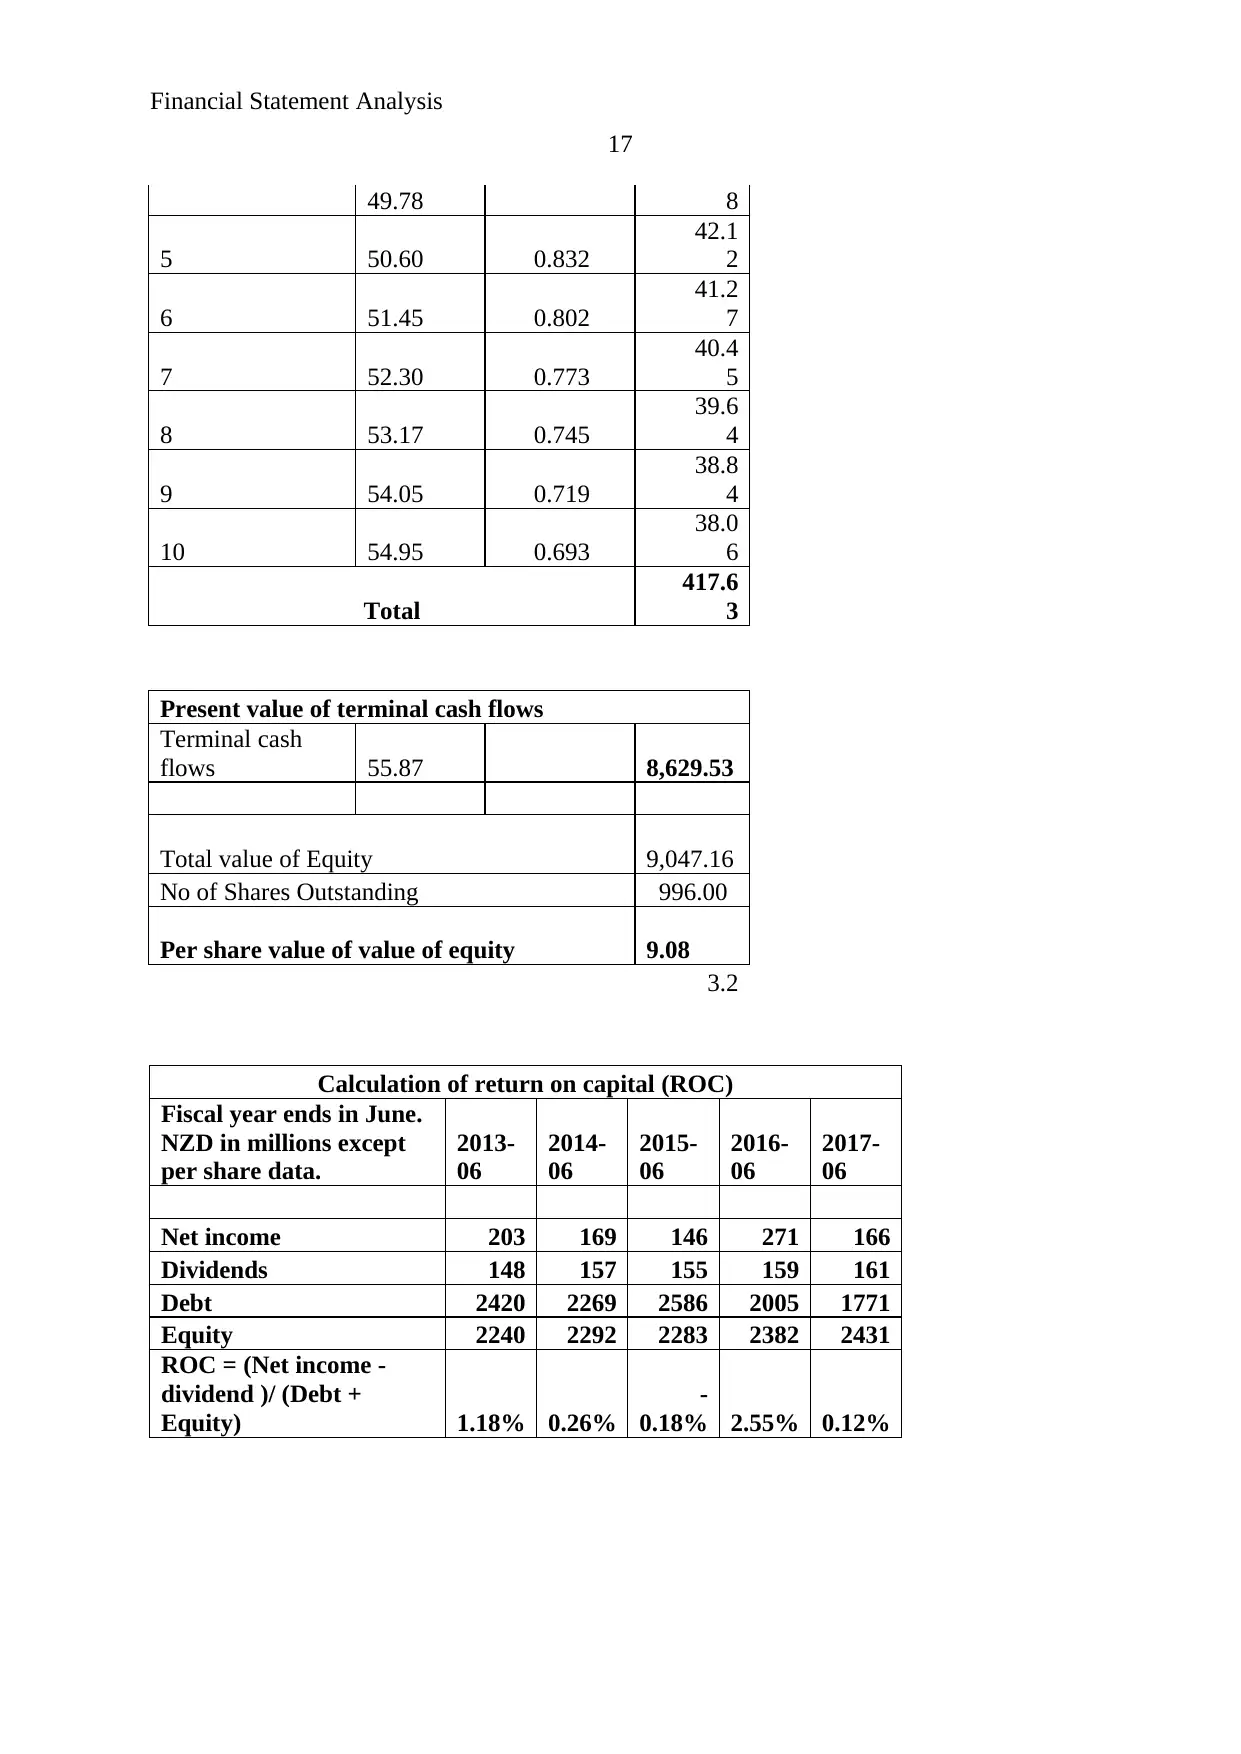
Present value of discrete cash flows for next 10 years
Year
FCFF
($M)
PVF
@3.74%
PV of
Cash
Flows
1 47.37 0.964
45.6
7
2 48.16 0.929
44.7
5
3 48.96 0.896
43.8
6
4 0.863 42.9
16
2017 166.00 2,431.00 6.83% 7.00% 0.48%
Average growth of past five years 1.66%
Averge cash flow 46.6
Valuation of equity taking free cash flows of equity
Estimated Free cash flows for equity
Year
FCFF
($M)
2017 47.37
2018 48.16
2019 48.96
2020 49.78
2021 50.60
2022 51.45
2023 52.30
2024 53.17
2025 54.05
2026 54.95
2027 55.87
Present value of discrete cash flows for next 10 years
Year
FCFF
($M)
PVF
@3.74%
PV of
Cash
Flows
1 47.37 0.964
45.6
7
2 48.16 0.929
44.7
5
3 48.96 0.896
43.8
6
4 0.863 42.9
Secure Best Marks with AI Grader
Need help grading? Try our AI Grader for instant feedback on your assignments.
Financial Statement Analysis
17
49.78 8
5 50.60 0.832
42.1
2
6 51.45 0.802
41.2
7
7 52.30 0.773
40.4
5
8 53.17 0.745
39.6
4
9 54.05 0.719
38.8
4
10 54.95 0.693
38.0
6
Total
417.6
3
Present value of terminal cash flows
Terminal cash
flows 55.87 8,629.53
Total value of Equity 9,047.16
No of Shares Outstanding 996.00
Per share value of value of equity 9.08
3.2
Calculation of return on capital (ROC)
Fiscal year ends in June.
NZD in millions except
per share data.
2013-
06
2014-
06
2015-
06
2016-
06
2017-
06
Net income 203 169 146 271 166
Dividends 148 157 155 159 161
Debt 2420 2269 2586 2005 1771
Equity 2240 2292 2283 2382 2431
ROC = (Net income -
dividend )/ (Debt +
Equity) 1.18% 0.26%
-
0.18% 2.55% 0.12%
1 out of 17
Related Documents


Your All-in-One AI-Powered Toolkit for Academic Success.
+13062052269
info@desklib.com
Available 24*7 on WhatsApp / Email
![[object Object]](/_next/static/media/star-bottom.7253800d.svg)
Unlock your academic potential
© 2024 | Zucol Services PVT LTD | All rights reserved.