Management Accounting Project Report
VerifiedAdded on 2022/11/14
|14
|3359
|120
AI Summary
This Management Accounting Project Report includes schedules, activities, and resource drivers used. It covers traditional and activity-based costing systems, management accounting factors, benefits, and limitations of ABC costing. The report also provides information on corporate management, process receivables, process payables, production planning, reports to health dept, process sales order, dispatch sales order, new product development, inspect filling ingredients, disposal of substandard ingredients, move to mixing room, set up mixer, weigh and sort ingredients, load mixer, operate mixer, unload and clean mixer, move to filling room, set up pastry cases, stack cases on filling machine, fill pastry cases, clean hopper, move to baking, stack cases on baking trays, setup ovens, move to ovens, bake products, unload oven, inspect finished products, and disposal of substandard products.
Contribute Materials
Your contribution can guide someone’s learning journey. Share your
documents today.
Running Head: Management Accounting
1
Project Report: Management Accounting
1
Project Report: Management Accounting
Secure Best Marks with AI Grader
Need help grading? Try our AI Grader for instant feedback on your assignments.
Management Accounting
2
Contents
Answer 1, 2, 3 and 4.........................................................................................................3
Schedule 1.....................................................................................................................3
Schedule 2.....................................................................................................................3
Schedule 3.....................................................................................................................4
Schedule 4.....................................................................................................................4
Schedule 5.....................................................................................................................6
Schedule 6.....................................................................................................................7
Answer 5...........................................................................................................................8
Answer 6...........................................................................................................................8
Answer 7...........................................................................................................................9
Answer 8 and 9.................................................................................................................9
Introduction...................................................................................................................9
Traditional costing system............................................................................................9
Activity based costing system....................................................................................10
Management accounting factor...................................................................................11
Benefit of ABC costing..............................................................................................11
Cost and limitation of ABC costing:..........................................................................12
Conclusion..................................................................................................................12
References.......................................................................................................................13
Management Accounting
3
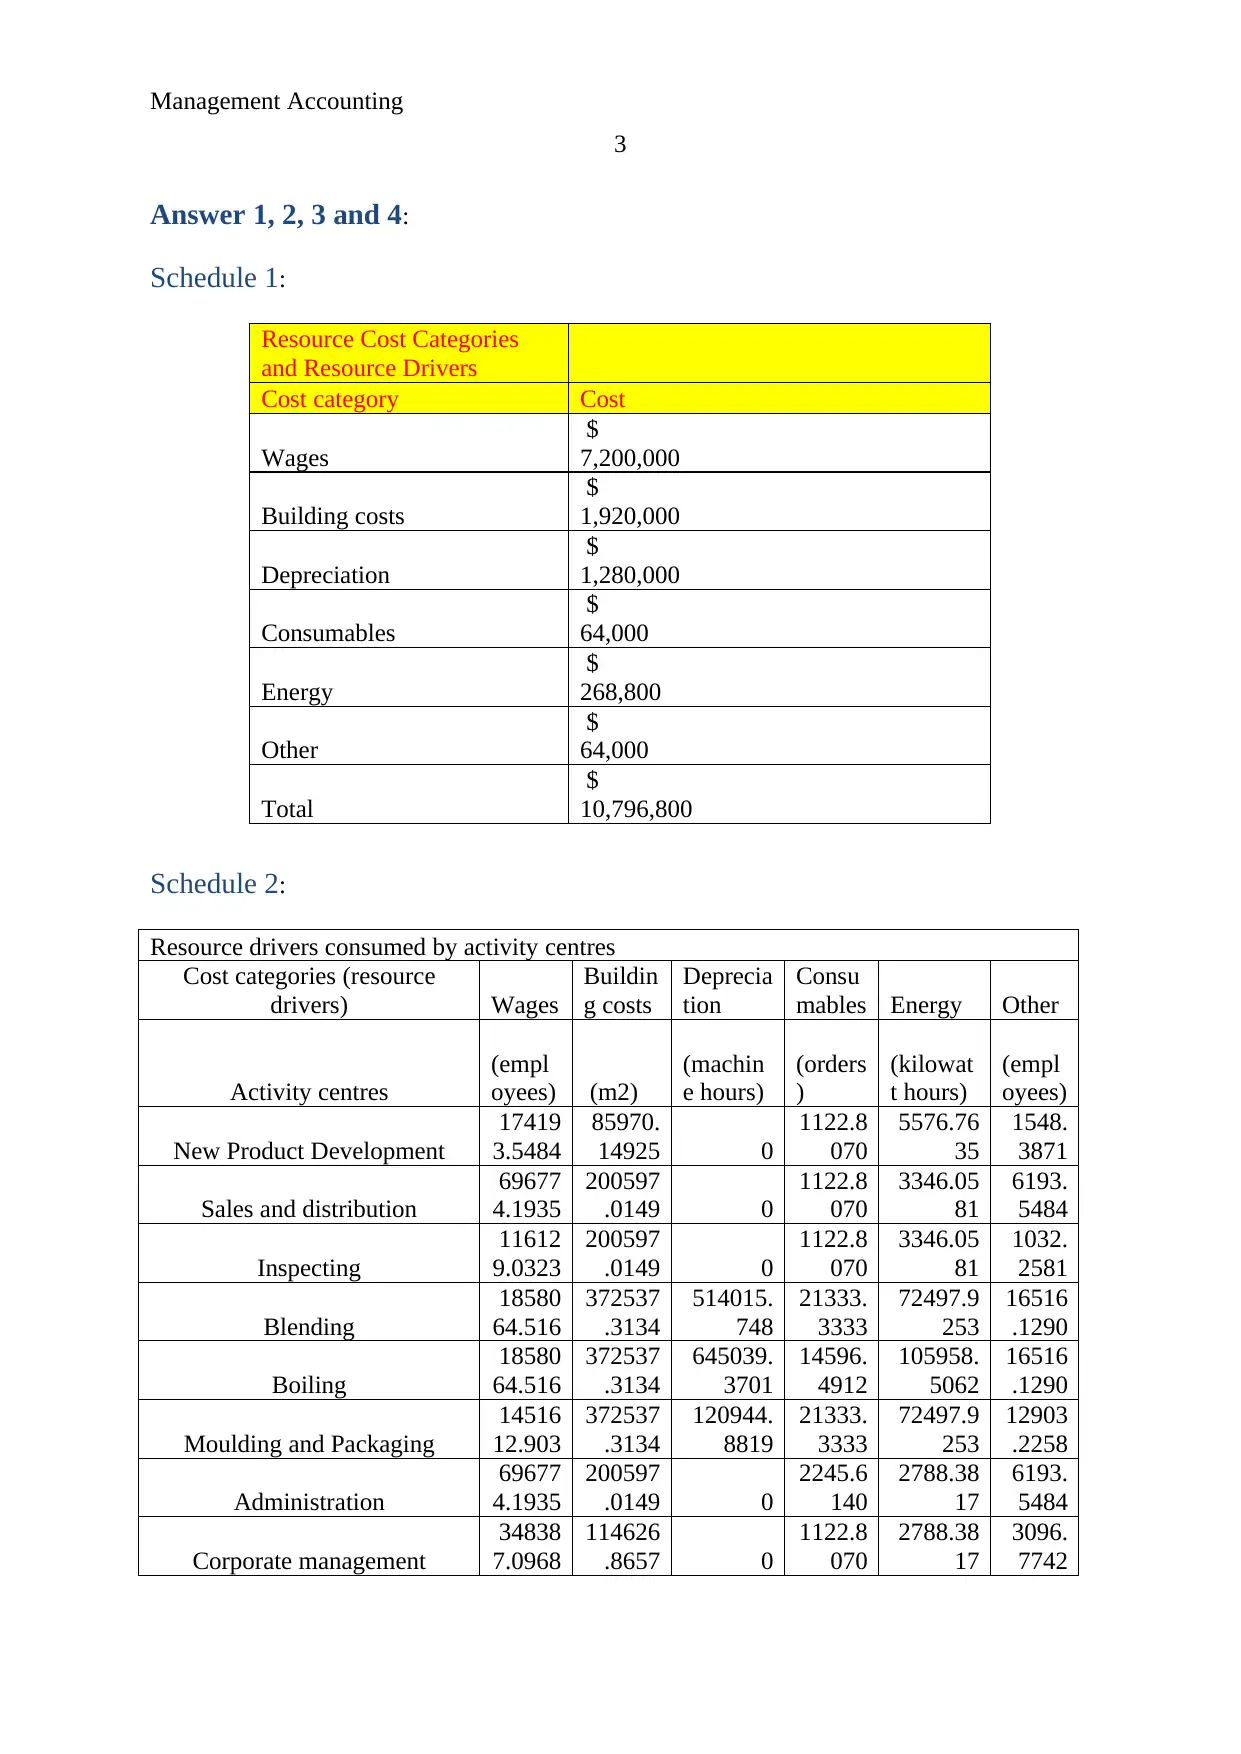
Answer 1, 2, 3 and 4:
Schedule 1:
Resource Cost Categories
and Resource Drivers
Cost category Cost
Wages
$
7,200,000
Building costs
$
1,920,000
Depreciation
$
1,280,000
Consumables
$
64,000
Energy
$
268,800
Other
$
64,000
Total
$
10,796,800
Schedule 2:
Resource drivers consumed by activity centres
Cost categories (resource
drivers) Wages
Buildin
g costs
Deprecia
tion
Consu
mables Energy Other
Activity centres
(empl
oyees) (m2)
(machin
e hours)
(orders
)
(kilowat
t hours)
(empl
oyees)
New Product Development
17419
3.5484
85970.
14925 0
1122.8
070
5576.76
35
1548.
3871
Sales and distribution
69677
4.1935
200597
.0149 0
1122.8
070
3346.05
81
6193.
5484
Inspecting
11612
9.0323
200597
.0149 0
1122.8
070
3346.05
81
1032.
2581
Blending
18580
64.516
372537
.3134
514015.
748
21333.
3333
72497.9
253
16516
.1290
Boiling
18580
64.516
372537
.3134
645039.
3701
14596.
4912
105958.
5062
16516
.1290
Moulding and Packaging
14516
12.903
372537
.3134
120944.
8819
21333.
3333
72497.9
253
12903
.2258
Administration
69677
4.1935
200597
.0149 0
2245.6
140
2788.38
17
6193.
5484
Corporate management
34838
7.0968
114626
.8657 0
1122.8
070
2788.38
17
3096.
7742
3
Answer 1, 2, 3 and 4:
Schedule 1:
Resource Cost Categories
and Resource Drivers
Cost category Cost
Wages
$
7,200,000
Building costs
$
1,920,000
Depreciation
$
1,280,000
Consumables
$
64,000
Energy
$
268,800
Other
$
64,000
Total
$
10,796,800
Schedule 2:
Resource drivers consumed by activity centres
Cost categories (resource
drivers) Wages
Buildin
g costs
Deprecia
tion
Consu
mables Energy Other
Activity centres
(empl
oyees) (m2)
(machin
e hours)
(orders
)
(kilowat
t hours)
(empl
oyees)
New Product Development
17419
3.5484
85970.
14925 0
1122.8
070
5576.76
35
1548.
3871
Sales and distribution
69677
4.1935
200597
.0149 0
1122.8
070
3346.05
81
6193.
5484
Inspecting
11612
9.0323
200597
.0149 0
1122.8
070
3346.05
81
1032.
2581
Blending
18580
64.516
372537
.3134
514015.
748
21333.
3333
72497.9
253
16516
.1290
Boiling
18580
64.516
372537
.3134
645039.
3701
14596.
4912
105958.
5062
16516
.1290
Moulding and Packaging
14516
12.903
372537
.3134
120944.
8819
21333.
3333
72497.9
253
12903
.2258
Administration
69677
4.1935
200597
.0149 0
2245.6
140
2788.38
17
6193.
5484
Corporate management
34838
7.0968
114626
.8657 0
1122.8
070
2788.38
17
3096.
7742
Management Accounting
4
Total quantity of resource
drivers across all activity
centres
72000
00
192000
0 1280000 64000 268800 64000
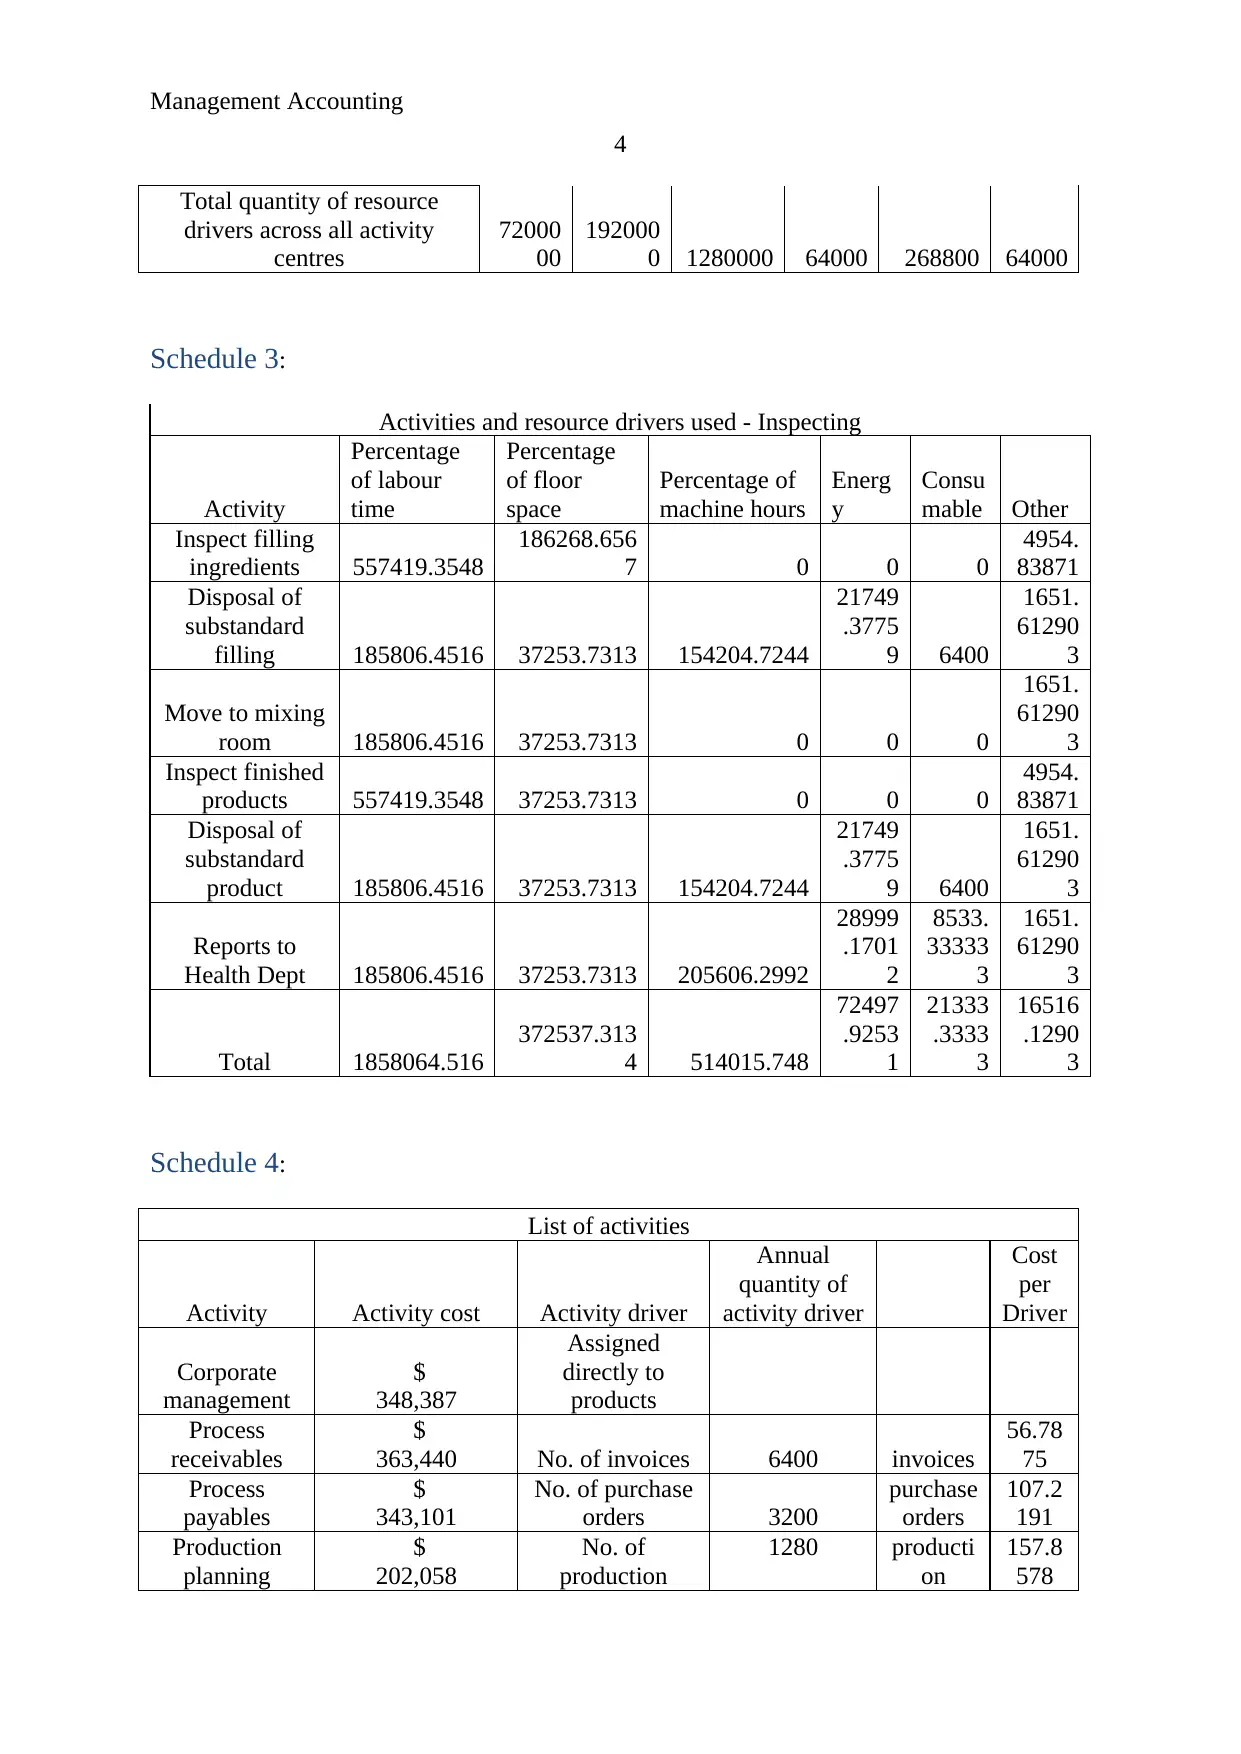
Schedule 3:
Activities and resource drivers used - Inspecting
Activity
Percentage
of labour
time
Percentage
of floor
space
Percentage of
machine hours
Energ
y
Consu
mable Other
Inspect filling
ingredients 557419.3548
186268.656
7 0 0 0
4954.
83871
Disposal of
substandard
filling 185806.4516 37253.7313 154204.7244
21749
.3775
9 6400
1651.
61290
3
Move to mixing
room 185806.4516 37253.7313 0 0 0
1651.
61290
3
Inspect finished
products 557419.3548 37253.7313 0 0 0
4954.
83871
Disposal of
substandard
product 185806.4516 37253.7313 154204.7244
21749
.3775
9 6400
1651.
61290
3
Reports to
Health Dept 185806.4516 37253.7313 205606.2992
28999
.1701
2
8533.
33333
3
1651.
61290
3
Total 1858064.516
372537.313
4 514015.748
72497
.9253
1
21333
.3333
3
16516
.1290
3
Schedule 4:
List of activities
Activity Activity cost Activity driver
Annual
quantity of
activity driver
Cost
per
Driver
Corporate
management
$
348,387
Assigned
directly to
products
Process
receivables
$
363,440 No. of invoices 6400 invoices
56.78
75
Process
payables
$
343,101
No. of purchase
orders 3200
purchase
orders
107.2
191
Production
planning
$
202,058
No. of
production
1280 producti
on
157.8
578
4
Total quantity of resource
drivers across all activity
centres
72000
00
192000
0 1280000 64000 268800 64000
Schedule 3:
Activities and resource drivers used - Inspecting
Activity
Percentage
of labour
time
Percentage
of floor
space
Percentage of
machine hours
Energ
y
Consu
mable Other
Inspect filling
ingredients 557419.3548
186268.656
7 0 0 0
4954.
83871
Disposal of
substandard
filling 185806.4516 37253.7313 154204.7244
21749
.3775
9 6400
1651.
61290
3
Move to mixing
room 185806.4516 37253.7313 0 0 0
1651.
61290
3
Inspect finished
products 557419.3548 37253.7313 0 0 0
4954.
83871
Disposal of
substandard
product 185806.4516 37253.7313 154204.7244
21749
.3775
9 6400
1651.
61290
3
Reports to
Health Dept 185806.4516 37253.7313 205606.2992
28999
.1701
2
8533.
33333
3
1651.
61290
3
Total 1858064.516
372537.313
4 514015.748
72497
.9253
1
21333
.3333
3
16516
.1290
3
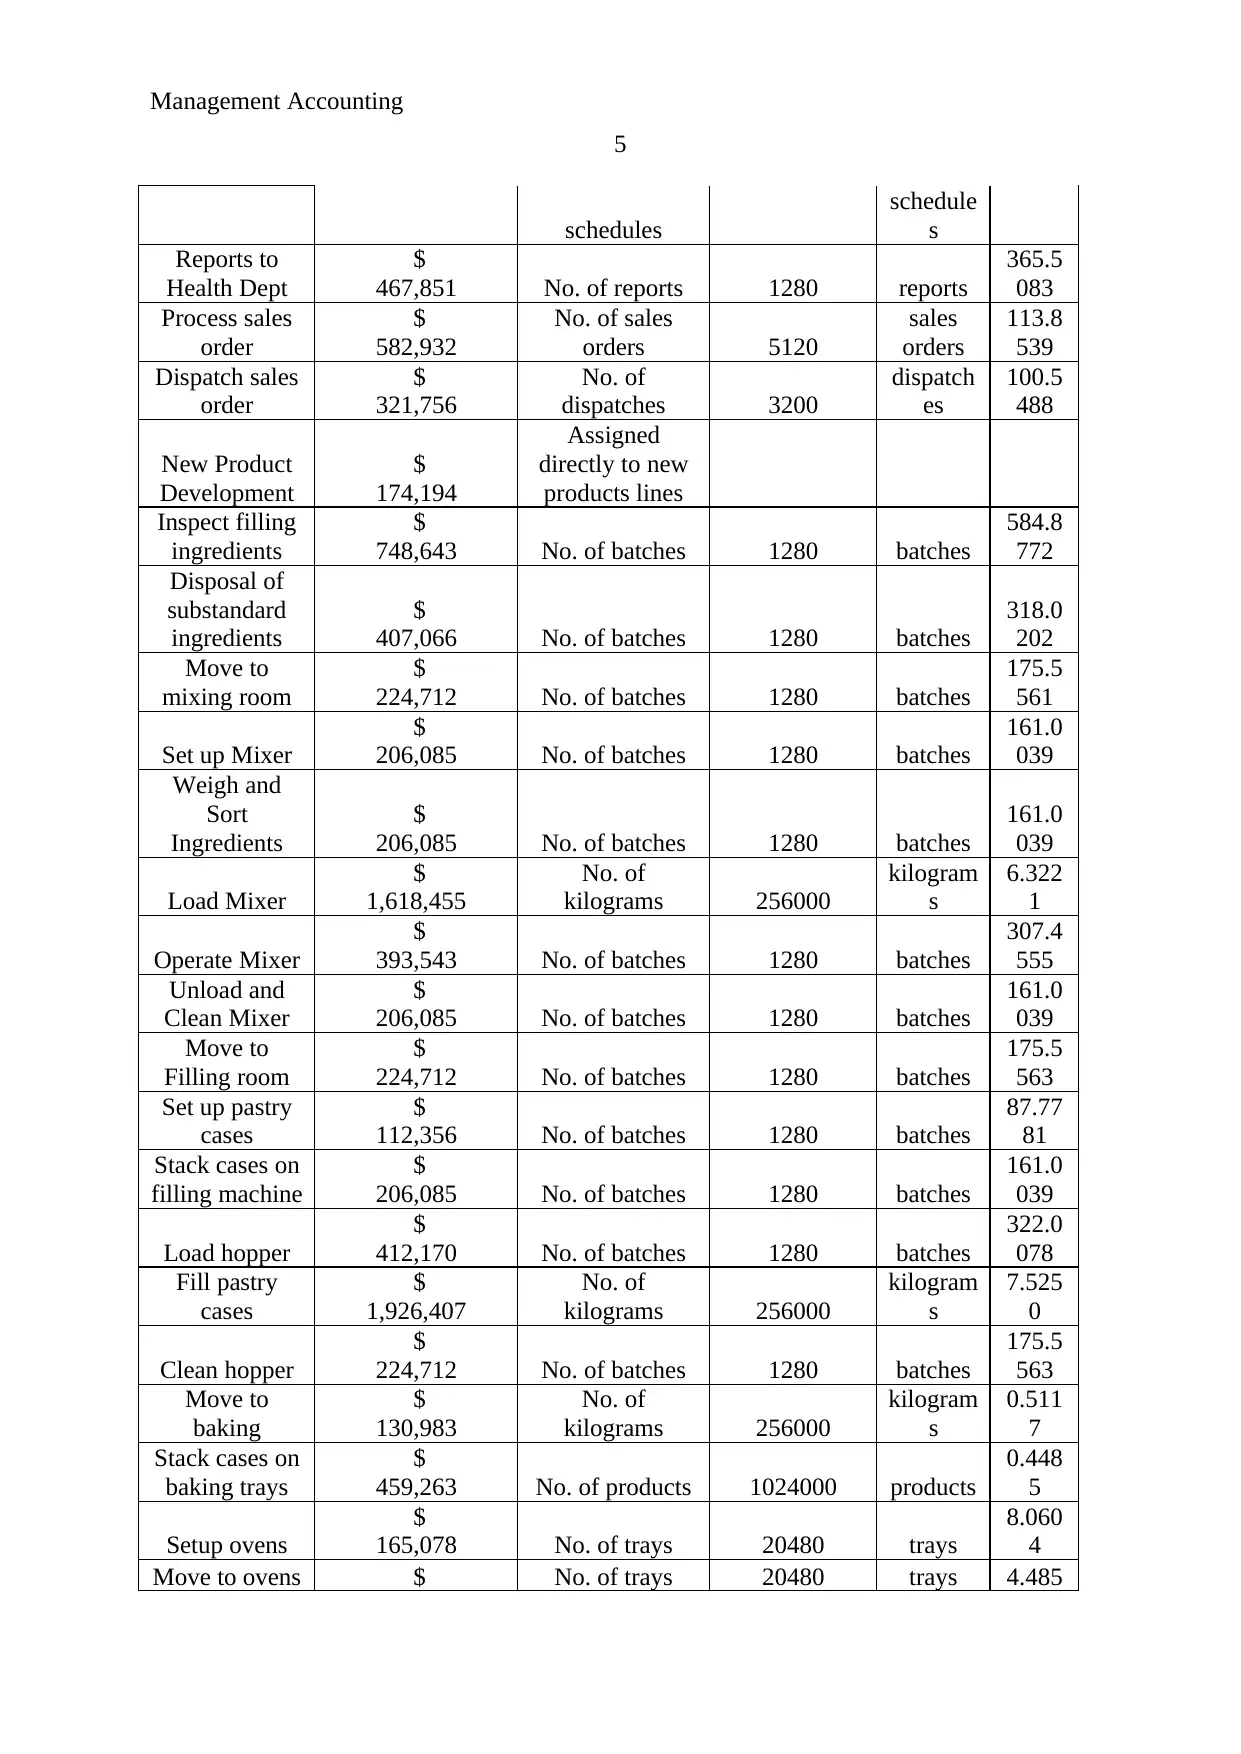
Schedule 4:
List of activities
Activity Activity cost Activity driver
Annual
quantity of
activity driver
Cost
per
Driver
Corporate
management
$
348,387
Assigned
directly to
products
Process
receivables
$
363,440 No. of invoices 6400 invoices
56.78
75
Process
payables
$
343,101
No. of purchase
orders 3200
purchase
orders
107.2
191
Production
planning
$
202,058
No. of
production
1280 producti
on
157.8
578
Secure Best Marks with AI Grader
Need help grading? Try our AI Grader for instant feedback on your assignments.
Management Accounting
5
schedules
schedule
s
Reports to
Health Dept
$
467,851 No. of reports 1280 reports
365.5
083
Process sales
order
$
582,932
No. of sales
orders 5120
sales
orders
113.8
539
Dispatch sales
order
$
321,756
No. of
dispatches 3200
dispatch
es
100.5
488
New Product
Development
$
174,194
Assigned
directly to new
products lines
Inspect filling
ingredients
$
748,643 No. of batches 1280 batches
584.8
772
Disposal of
substandard
ingredients
$
407,066 No. of batches 1280 batches
318.0
202
Move to
mixing room
$
224,712 No. of batches 1280 batches
175.5
561
Set up Mixer
$
206,085 No. of batches 1280 batches
161.0
039
Weigh and
Sort
Ingredients
$
206,085 No. of batches 1280 batches
161.0
039
Load Mixer
$
1,618,455
No. of
kilograms 256000
kilogram
s
6.322
1
Operate Mixer
$
393,543 No. of batches 1280 batches
307.4
555
Unload and
Clean Mixer
$
206,085 No. of batches 1280 batches
161.0
039
Move to
Filling room
$
224,712 No. of batches 1280 batches
175.5
563
Set up pastry
cases
$
112,356 No. of batches 1280 batches
87.77
81
Stack cases on
filling machine
$
206,085 No. of batches 1280 batches
161.0
039
Load hopper
$
412,170 No. of batches 1280 batches
322.0
078
Fill pastry
cases
$
1,926,407
No. of
kilograms 256000
kilogram
s
7.525
0
Clean hopper
$
224,712 No. of batches 1280 batches
175.5
563
Move to
baking
$
130,983
No. of
kilograms 256000
kilogram
s
0.511
7
Stack cases on
baking trays
$
459,263 No. of products 1024000 products
0.448
5
Setup ovens
$
165,078 No. of trays 20480 trays
8.060
4
Move to ovens $ No. of trays 20480 trays 4.485
5
schedules
schedule
s
Reports to
Health Dept
$
467,851 No. of reports 1280 reports
365.5
083
Process sales
order
$
582,932
No. of sales
orders 5120
sales
orders
113.8
539
Dispatch sales
order
$
321,756
No. of
dispatches 3200
dispatch
es
100.5
488
New Product
Development
$
174,194
Assigned
directly to new
products lines
Inspect filling
ingredients
$
748,643 No. of batches 1280 batches
584.8
772
Disposal of
substandard
ingredients
$
407,066 No. of batches 1280 batches
318.0
202
Move to
mixing room
$
224,712 No. of batches 1280 batches
175.5
561
Set up Mixer
$
206,085 No. of batches 1280 batches
161.0
039
Weigh and
Sort
Ingredients
$
206,085 No. of batches 1280 batches
161.0
039
Load Mixer
$
1,618,455
No. of
kilograms 256000
kilogram
s
6.322
1
Operate Mixer
$
393,543 No. of batches 1280 batches
307.4
555
Unload and
Clean Mixer
$
206,085 No. of batches 1280 batches
161.0
039
Move to
Filling room
$
224,712 No. of batches 1280 batches
175.5
563
Set up pastry
cases
$
112,356 No. of batches 1280 batches
87.77
81
Stack cases on
filling machine
$
206,085 No. of batches 1280 batches
161.0
039
Load hopper
$
412,170 No. of batches 1280 batches
322.0
078
Fill pastry
cases
$
1,926,407
No. of
kilograms 256000
kilogram
s
7.525
0
Clean hopper
$
224,712 No. of batches 1280 batches
175.5
563
Move to
baking
$
130,983
No. of
kilograms 256000
kilogram
s
0.511
7
Stack cases on
baking trays
$
459,263 No. of products 1024000 products
0.448
5
Setup ovens
$
165,078 No. of trays 20480 trays
8.060
4
Move to ovens $ No. of trays 20480 trays 4.485
Management Accounting
6
91,853 0
Bake products
$
1,133,303 No. of trays 20480 trays
55.33
71
Unload oven
$
91,853 No. of trays 20480 trays
4.485
0
Inspect
finished
products
$
599,628 No. of trays 20480 trays
29.27
87
Disposal of
substandard
product
$
407,066 No. of trays 20480 trays
19.87
63
Move to truck
$
110,480 No. of trays 19460
Finished
trays
5.677
3
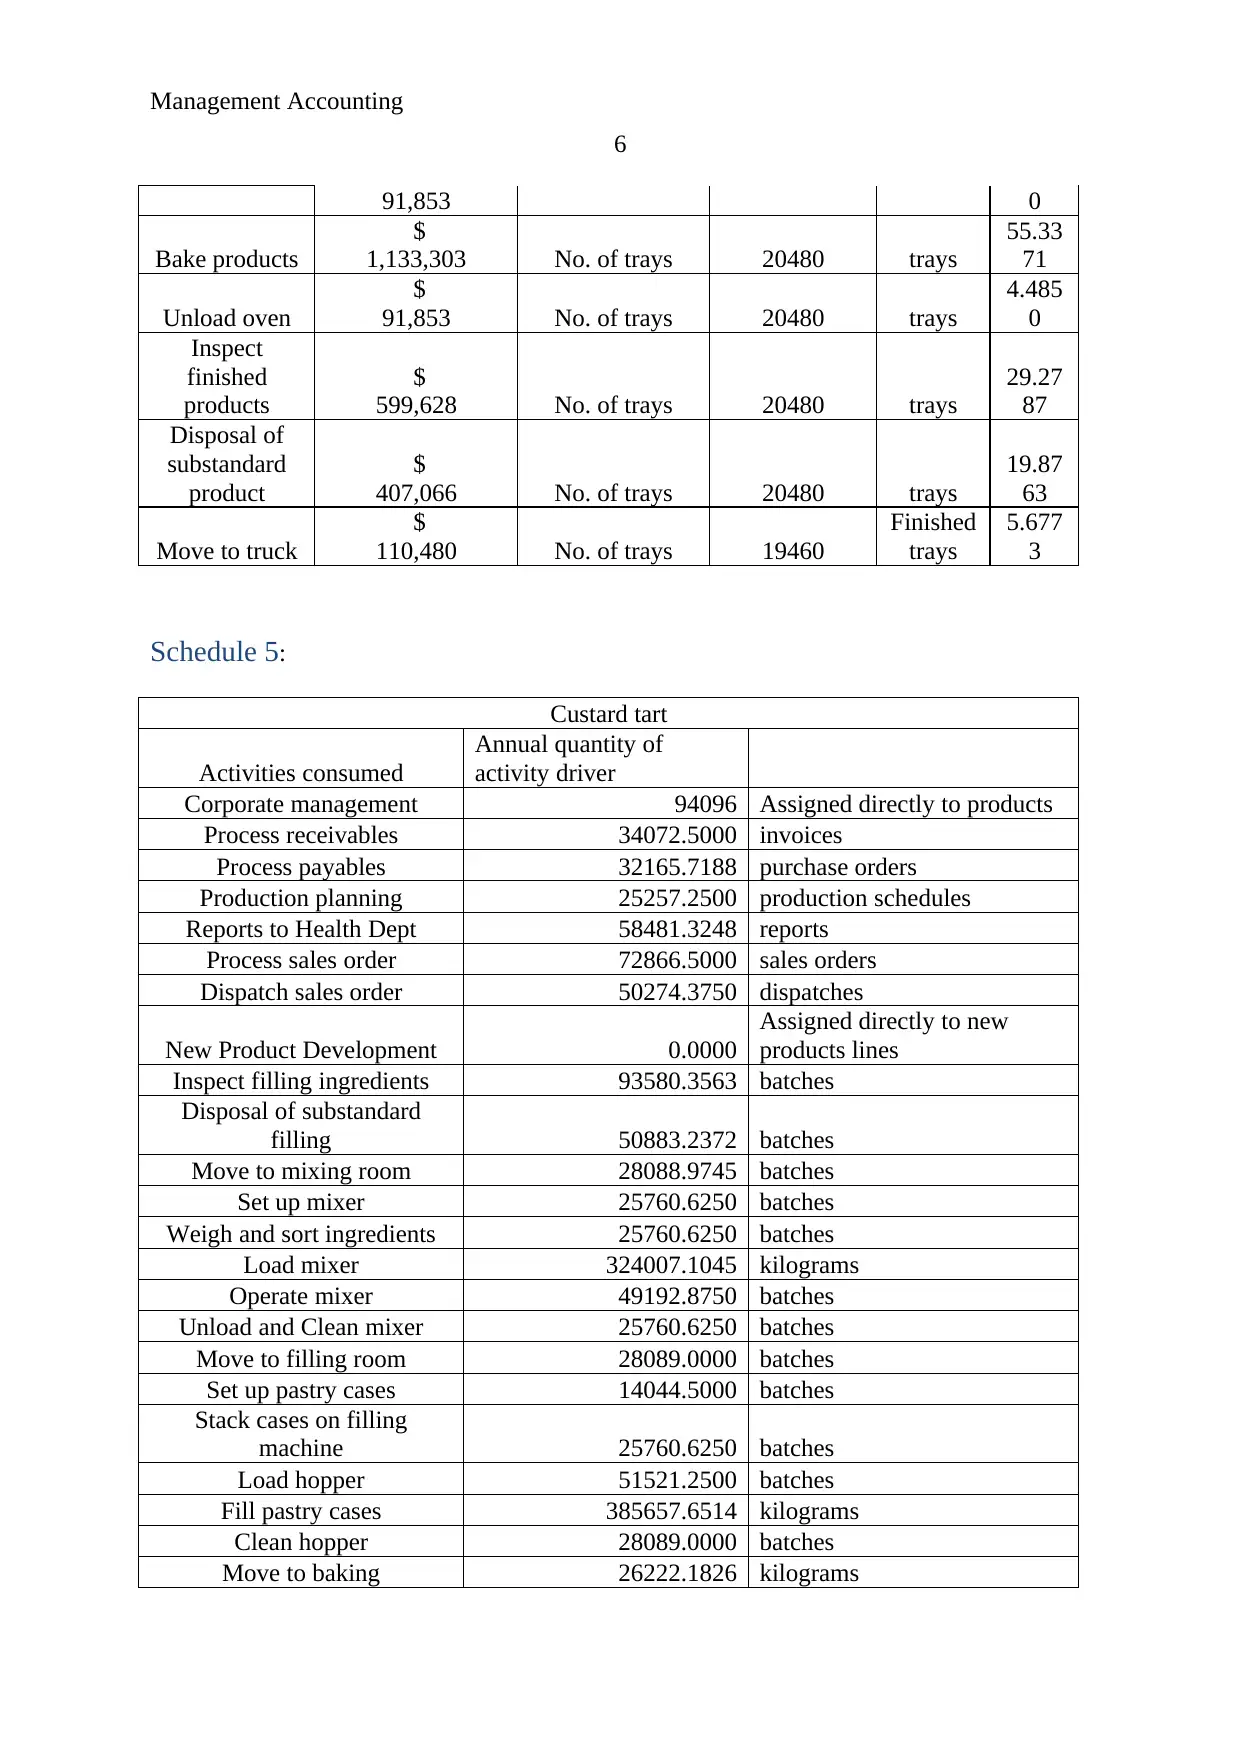
Schedule 5:
Custard tart
Activities consumed
Annual quantity of
activity driver
Corporate management 94096 Assigned directly to products
Process receivables 34072.5000 invoices
Process payables 32165.7188 purchase orders
Production planning 25257.2500 production schedules
Reports to Health Dept 58481.3248 reports
Process sales order 72866.5000 sales orders
Dispatch sales order 50274.3750 dispatches
New Product Development 0.0000
Assigned directly to new
products lines
Inspect filling ingredients 93580.3563 batches
Disposal of substandard
filling 50883.2372 batches
Move to mixing room 28088.9745 batches
Set up mixer 25760.6250 batches
Weigh and sort ingredients 25760.6250 batches
Load mixer 324007.1045 kilograms
Operate mixer 49192.8750 batches
Unload and Clean mixer 25760.6250 batches
Move to filling room 28089.0000 batches
Set up pastry cases 14044.5000 batches
Stack cases on filling
machine 25760.6250 batches
Load hopper 51521.2500 batches
Fill pastry cases 385657.6514 kilograms
Clean hopper 28089.0000 batches
Move to baking 26222.1826 kilograms
6
91,853 0
Bake products
$
1,133,303 No. of trays 20480 trays
55.33
71
Unload oven
$
91,853 No. of trays 20480 trays
4.485
0
Inspect
finished
products
$
599,628 No. of trays 20480 trays
29.27
87
Disposal of
substandard
product
$
407,066 No. of trays 20480 trays
19.87
63
Move to truck
$
110,480 No. of trays 19460
Finished
trays
5.677
3
Schedule 5:
Custard tart
Activities consumed
Annual quantity of
activity driver
Corporate management 94096 Assigned directly to products
Process receivables 34072.5000 invoices
Process payables 32165.7188 purchase orders
Production planning 25257.2500 production schedules
Reports to Health Dept 58481.3248 reports
Process sales order 72866.5000 sales orders
Dispatch sales order 50274.3750 dispatches
New Product Development 0.0000
Assigned directly to new
products lines
Inspect filling ingredients 93580.3563 batches
Disposal of substandard
filling 50883.2372 batches
Move to mixing room 28088.9745 batches
Set up mixer 25760.6250 batches
Weigh and sort ingredients 25760.6250 batches
Load mixer 324007.1045 kilograms
Operate mixer 49192.8750 batches
Unload and Clean mixer 25760.6250 batches
Move to filling room 28089.0000 batches
Set up pastry cases 14044.5000 batches
Stack cases on filling
machine 25760.6250 batches
Load hopper 51521.2500 batches
Fill pastry cases 385657.6514 kilograms
Clean hopper 28089.0000 batches
Move to baking 26222.1826 kilograms
Management Accounting
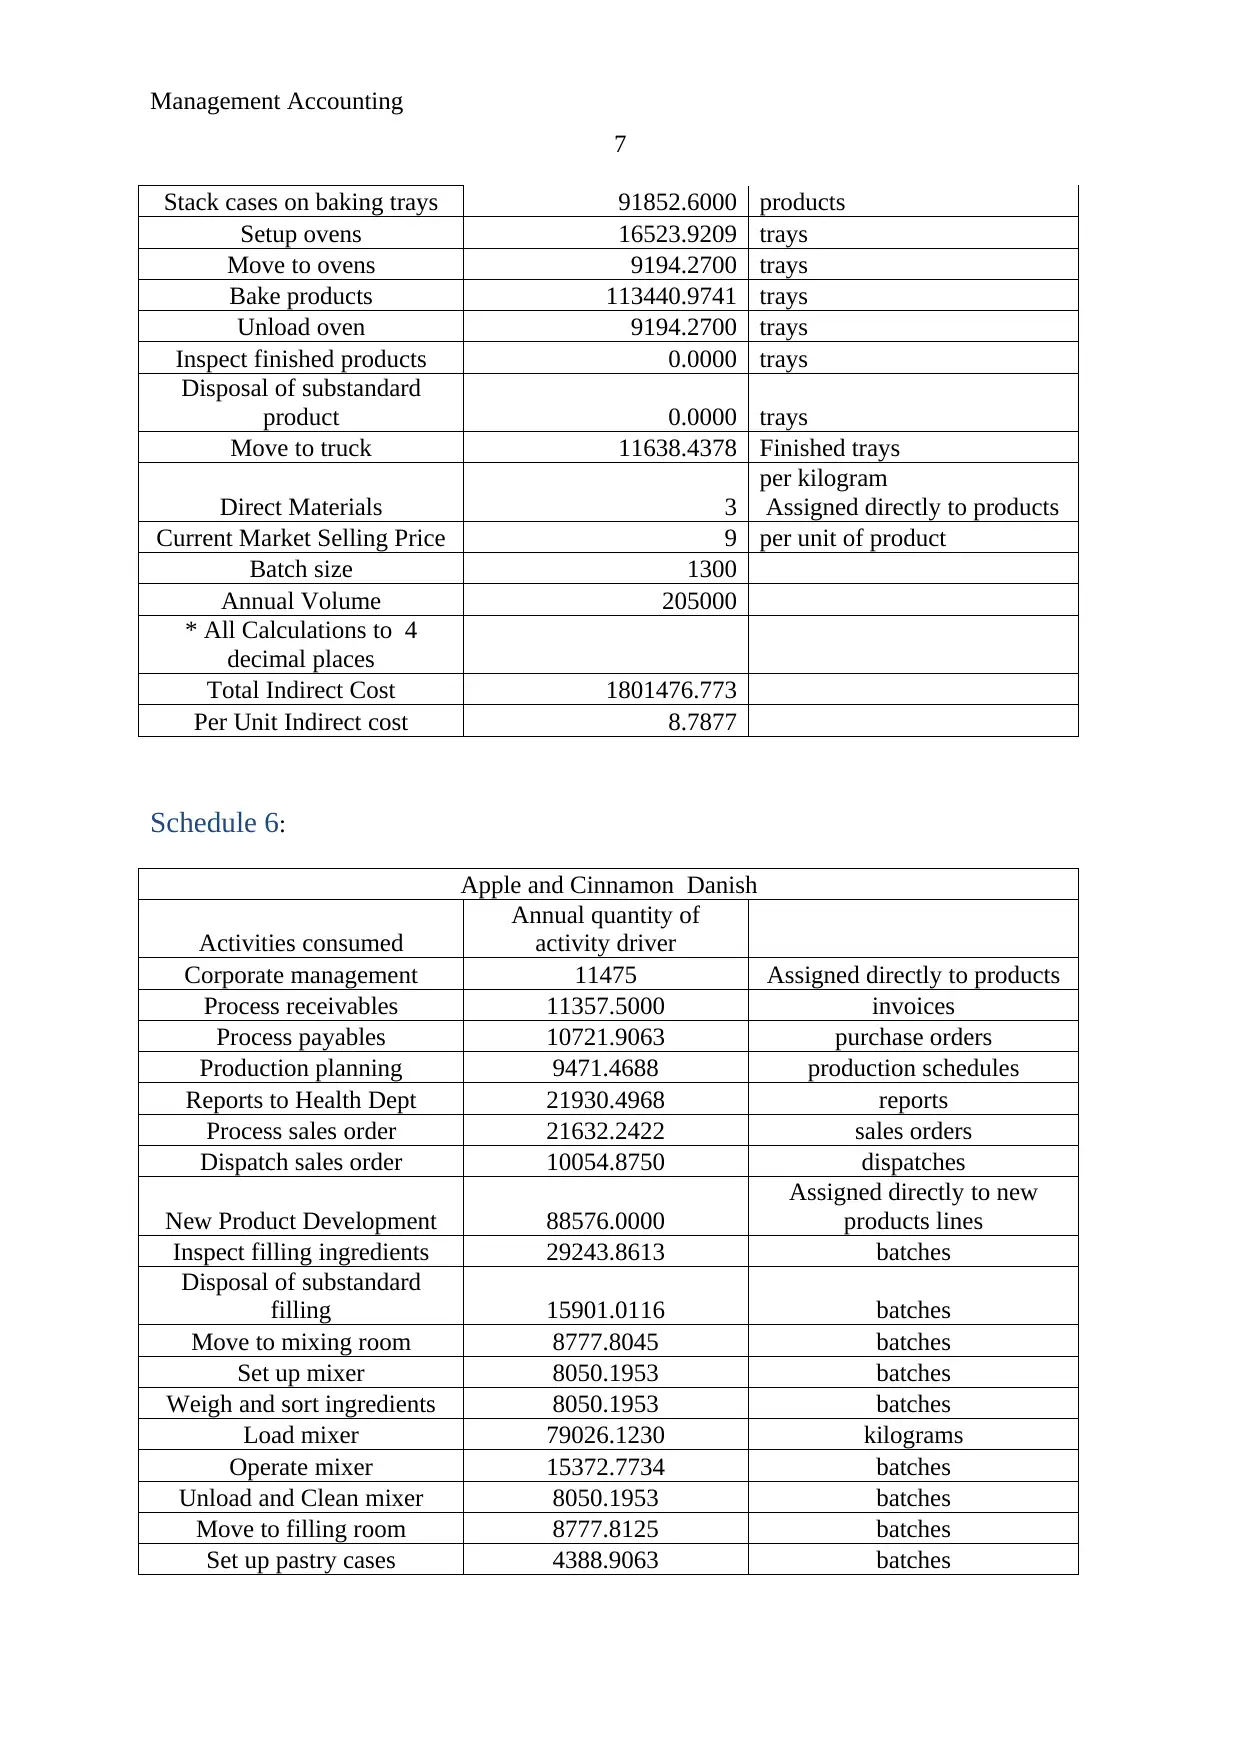
7
Stack cases on baking trays 91852.6000 products
Setup ovens 16523.9209 trays
Move to ovens 9194.2700 trays
Bake products 113440.9741 trays
Unload oven 9194.2700 trays
Inspect finished products 0.0000 trays
Disposal of substandard
product 0.0000 trays
Move to truck 11638.4378 Finished trays
Direct Materials 3
per kilogram
Assigned directly to products
Current Market Selling Price 9 per unit of product
Batch size 1300
Annual Volume 205000
* All Calculations to 4
decimal places
Total Indirect Cost 1801476.773
Per Unit Indirect cost 8.7877
Schedule 6:
Apple and Cinnamon Danish
Activities consumed
Annual quantity of
activity driver
Corporate management 11475 Assigned directly to products
Process receivables 11357.5000 invoices
Process payables 10721.9063 purchase orders
Production planning 9471.4688 production schedules
Reports to Health Dept 21930.4968 reports
Process sales order 21632.2422 sales orders
Dispatch sales order 10054.8750 dispatches
New Product Development 88576.0000
Assigned directly to new
products lines
Inspect filling ingredients 29243.8613 batches
Disposal of substandard
filling 15901.0116 batches
Move to mixing room 8777.8045 batches
Set up mixer 8050.1953 batches
Weigh and sort ingredients 8050.1953 batches
Load mixer 79026.1230 kilograms
Operate mixer 15372.7734 batches
Unload and Clean mixer 8050.1953 batches
Move to filling room 8777.8125 batches
Set up pastry cases 4388.9063 batches
Paraphrase This Document
Need a fresh take? Get an instant paraphrase of this document with our AI Paraphraser
Management Accounting
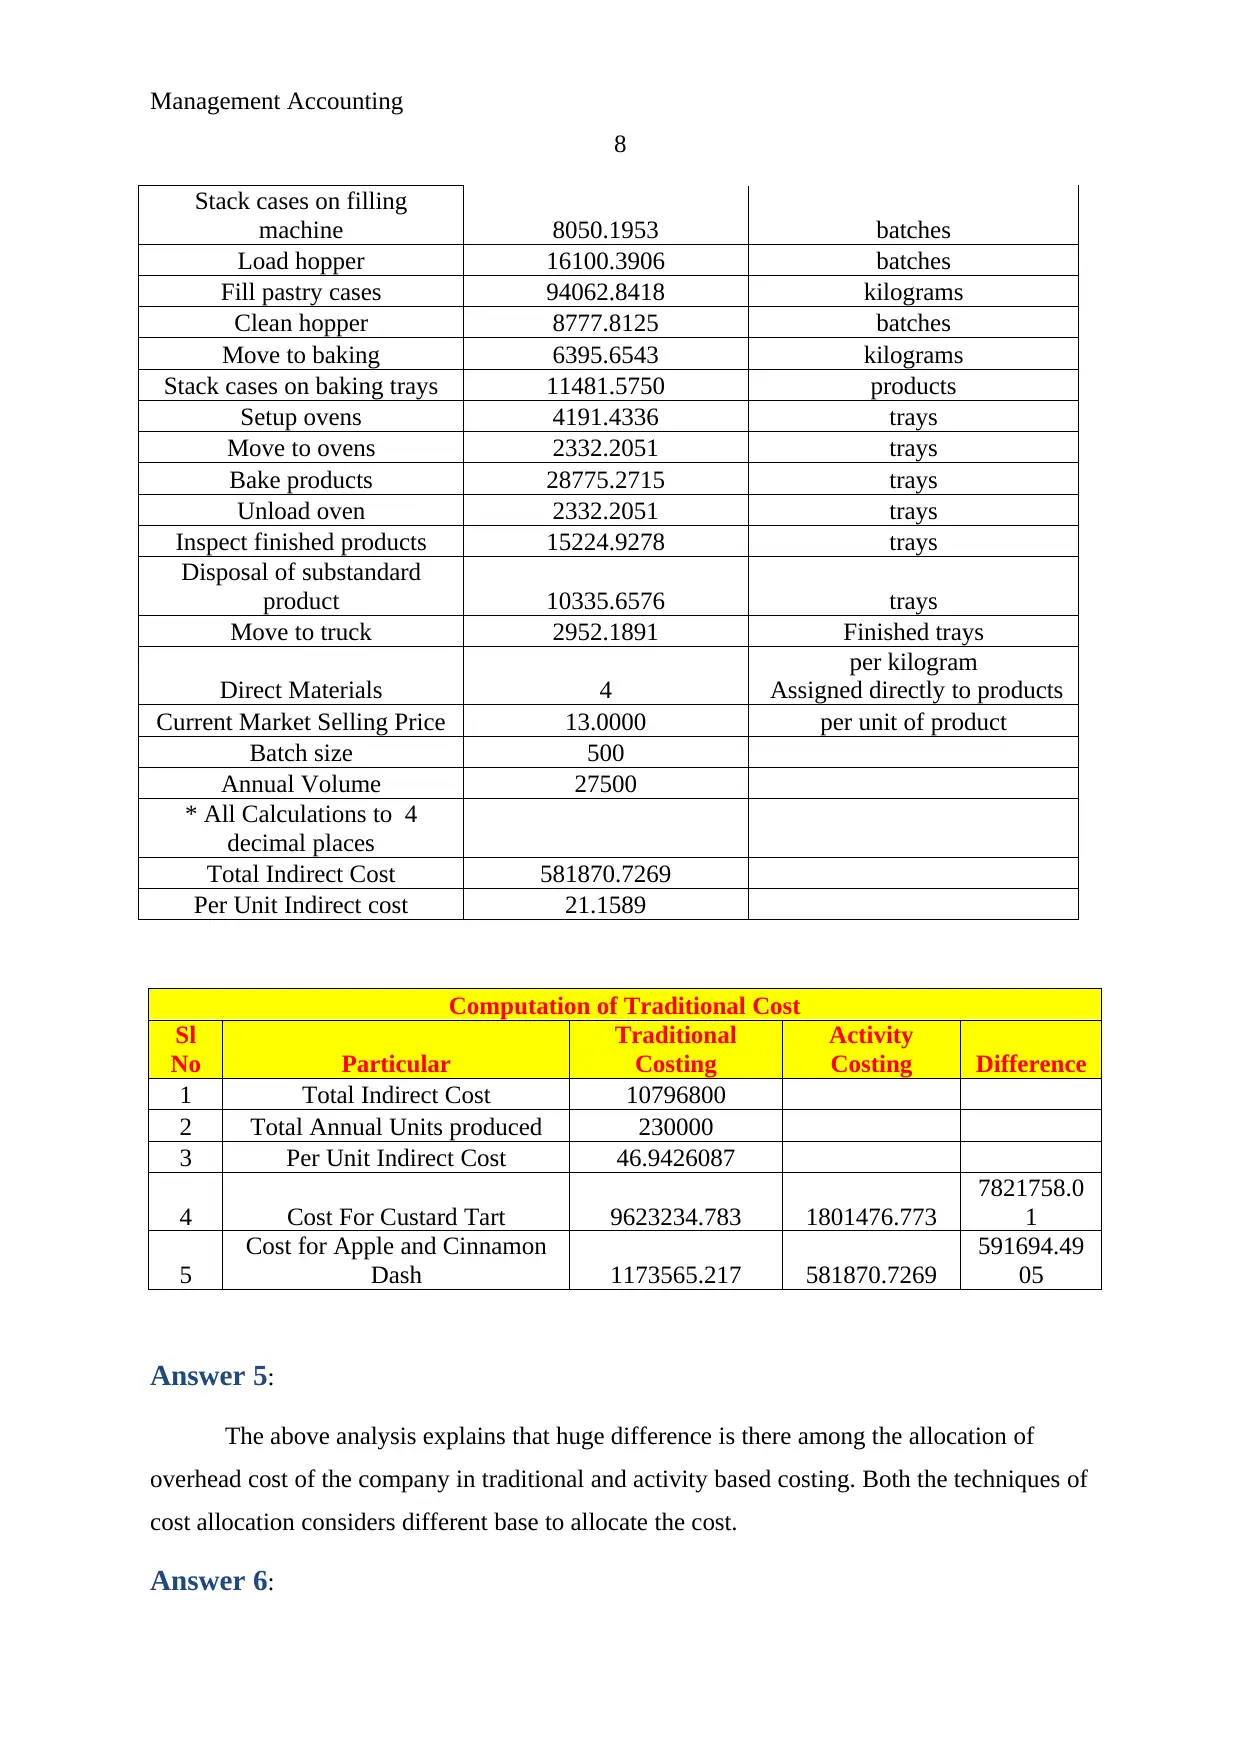
8
Stack cases on filling
machine 8050.1953 batches
Load hopper 16100.3906 batches
Fill pastry cases 94062.8418 kilograms
Clean hopper 8777.8125 batches
Move to baking 6395.6543 kilograms
Stack cases on baking trays 11481.5750 products
Setup ovens 4191.4336 trays
Move to ovens 2332.2051 trays
Bake products 28775.2715 trays
Unload oven 2332.2051 trays
Inspect finished products 15224.9278 trays
Disposal of substandard
product 10335.6576 trays
Move to truck 2952.1891 Finished trays
Direct Materials 4
per kilogram
Assigned directly to products
Current Market Selling Price 13.0000 per unit of product
Batch size 500
Annual Volume 27500
* All Calculations to 4
decimal places
Total Indirect Cost 581870.7269
Per Unit Indirect cost 21.1589
Computation of Traditional Cost
Sl
No Particular
Traditional
Costing
Activity
Costing Difference
1 Total Indirect Cost 10796800
2 Total Annual Units produced 230000
3 Per Unit Indirect Cost 46.9426087
4 Cost For Custard Tart 9623234.783 1801476.773
7821758.0
1
5
Cost for Apple and Cinnamon
Dash 1173565.217 581870.7269
591694.49
05
Answer 5:
The above analysis explains that huge difference is there among the allocation of
overhead cost of the company in traditional and activity based costing. Both the techniques of
cost allocation considers different base to allocate the cost.
Answer 6:
Management Accounting
9
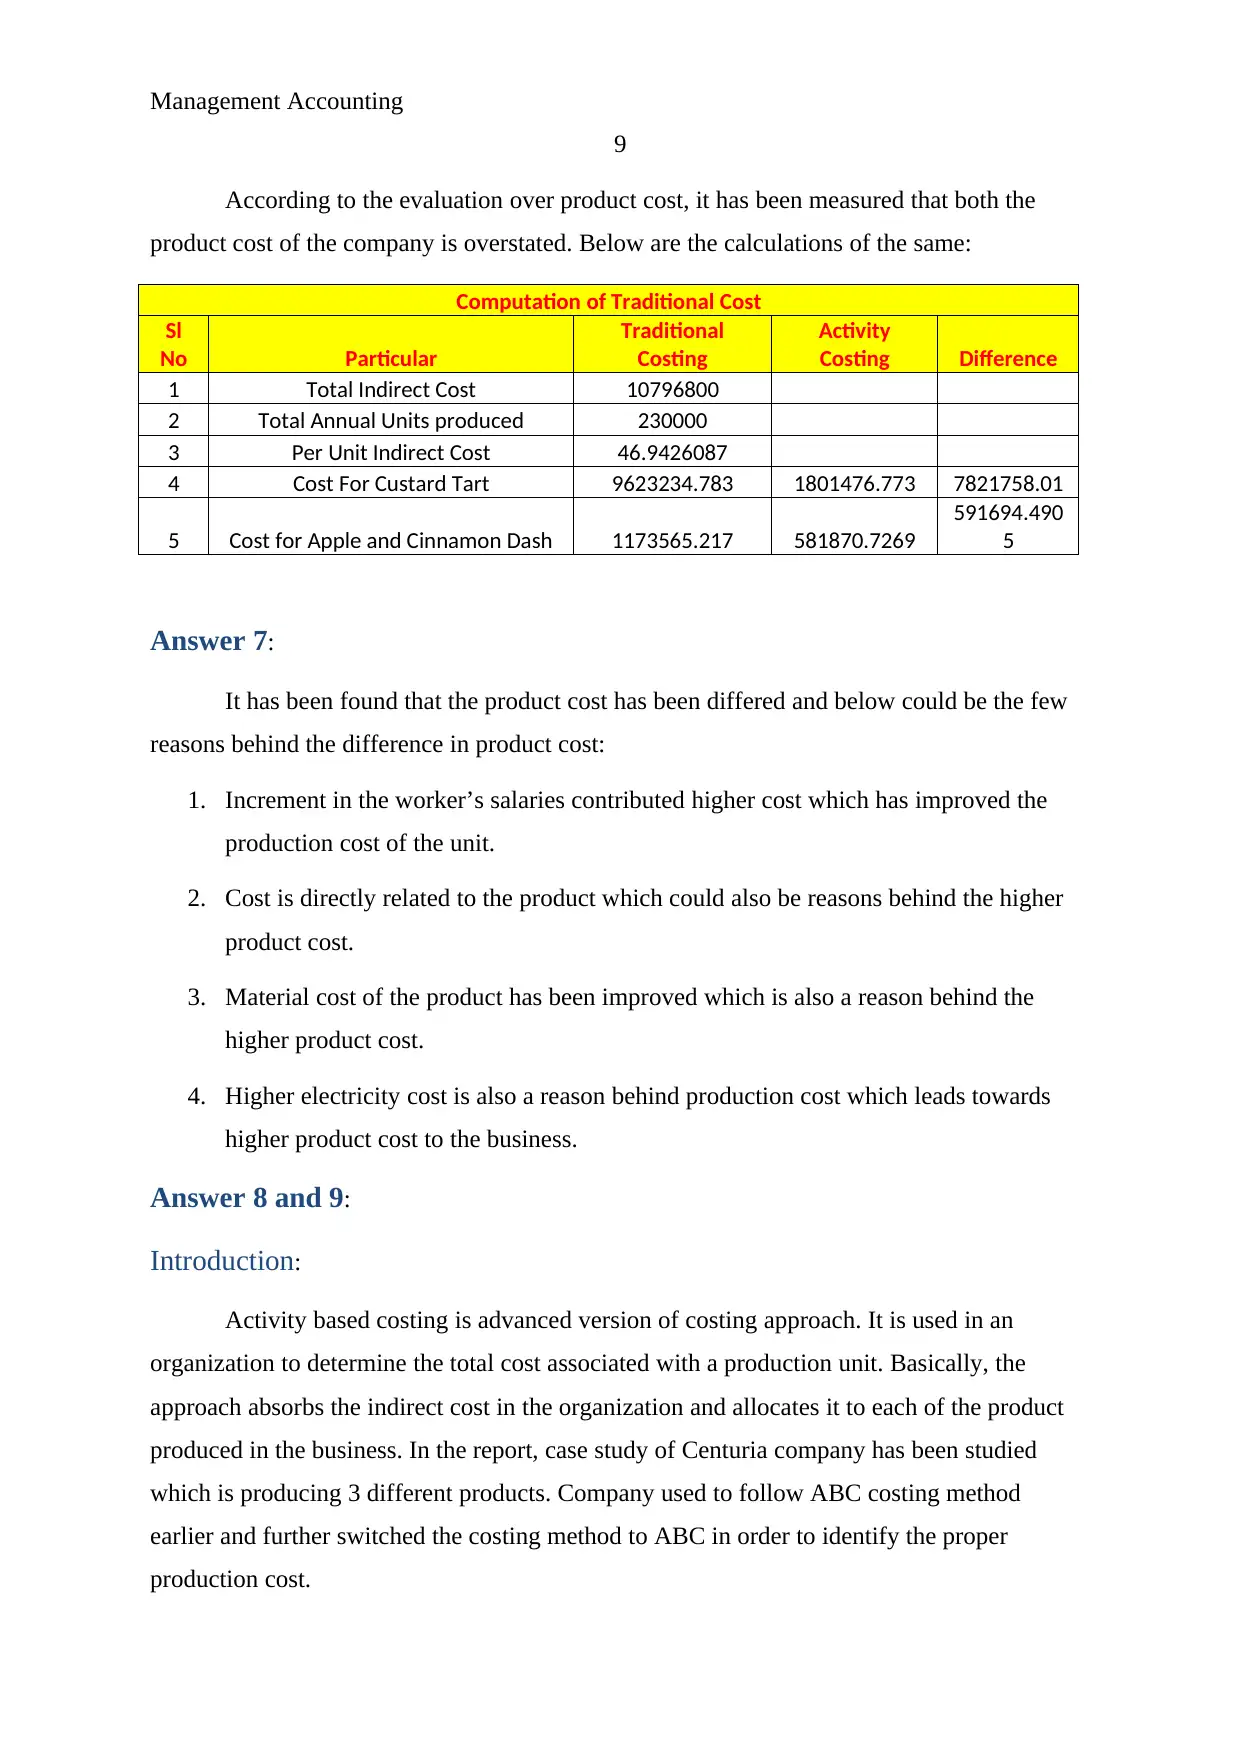
According to the evaluation over product cost, it has been measured that both the
product cost of the company is overstated. Below are the calculations of the same:
Computation of Traditional Cost
Sl
No Particular
Traditional
Costing
Activity
Costing Difference
1 Total Indirect Cost 10796800
2 Total Annual Units produced 230000
3 Per Unit Indirect Cost 46.9426087
4 Cost For Custard Tart 9623234.783 1801476.773 7821758.01
5 Cost for Apple and Cinnamon Dash 1173565.217 581870.7269
591694.490
5
Answer 7:
It has been found that the product cost has been differed and below could be the few
reasons behind the difference in product cost:
1. Increment in the worker’s salaries contributed higher cost which has improved the
production cost of the unit.
2. Cost is directly related to the product which could also be reasons behind the higher
product cost.
3. Material cost of the product has been improved which is also a reason behind the
higher product cost.
4. Higher electricity cost is also a reason behind production cost which leads towards
higher product cost to the business.
Answer 8 and 9:
Introduction:
Activity based costing is advanced version of costing approach. It is used in an
organization to determine the total cost associated with a production unit. Basically, the
approach absorbs the indirect cost in the organization and allocates it to each of the product
produced in the business. In the report, case study of Centuria company has been studied
which is producing 3 different products. Company used to follow ABC costing method
earlier and further switched the costing method to ABC in order to identify the proper
production cost.
9
According to the evaluation over product cost, it has been measured that both the
product cost of the company is overstated. Below are the calculations of the same:
Computation of Traditional Cost
Sl
No Particular
Traditional
Costing
Activity
Costing Difference
1 Total Indirect Cost 10796800
2 Total Annual Units produced 230000
3 Per Unit Indirect Cost 46.9426087
4 Cost For Custard Tart 9623234.783 1801476.773 7821758.01
5 Cost for Apple and Cinnamon Dash 1173565.217 581870.7269
591694.490
5
Answer 7:
It has been found that the product cost has been differed and below could be the few
reasons behind the difference in product cost:
1. Increment in the worker’s salaries contributed higher cost which has improved the
production cost of the unit.
2. Cost is directly related to the product which could also be reasons behind the higher
product cost.
3. Material cost of the product has been improved which is also a reason behind the
higher product cost.
4. Higher electricity cost is also a reason behind production cost which leads towards
higher product cost to the business.
Answer 8 and 9:
Introduction:
Activity based costing is advanced version of costing approach. It is used in an
organization to determine the total cost associated with a production unit. Basically, the
approach absorbs the indirect cost in the organization and allocates it to each of the product
produced in the business. In the report, case study of Centuria company has been studied
which is producing 3 different products. Company used to follow ABC costing method
earlier and further switched the costing method to ABC in order to identify the proper
production cost.
Management Accounting
10
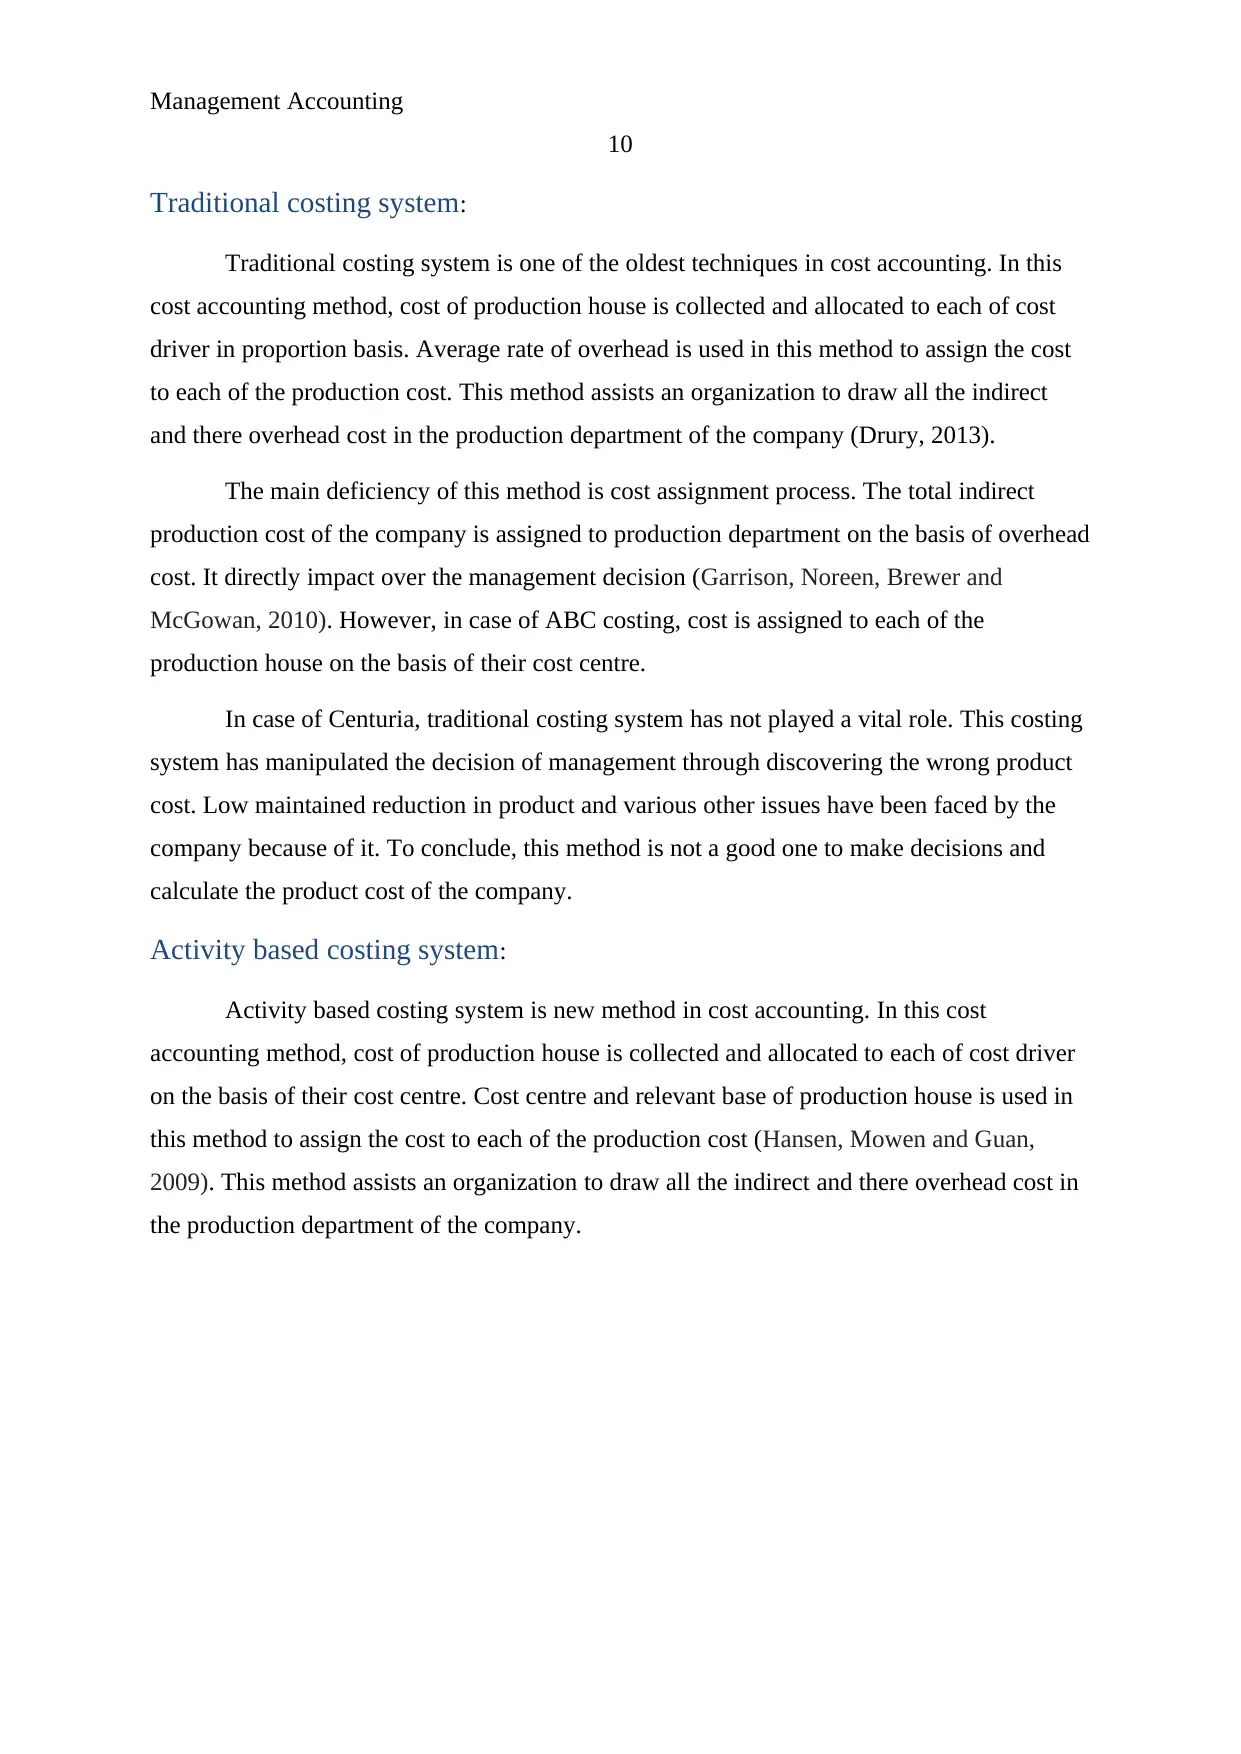
Traditional costing system:
Traditional costing system is one of the oldest techniques in cost accounting. In this
cost accounting method, cost of production house is collected and allocated to each of cost
driver in proportion basis. Average rate of overhead is used in this method to assign the cost
to each of the production cost. This method assists an organization to draw all the indirect
and there overhead cost in the production department of the company (Drury, 2013).
The main deficiency of this method is cost assignment process. The total indirect
production cost of the company is assigned to production department on the basis of overhead
cost. It directly impact over the management decision (Garrison, Noreen, Brewer and
McGowan, 2010). However, in case of ABC costing, cost is assigned to each of the
production house on the basis of their cost centre.
In case of Centuria, traditional costing system has not played a vital role. This costing
system has manipulated the decision of management through discovering the wrong product
cost. Low maintained reduction in product and various other issues have been faced by the
company because of it. To conclude, this method is not a good one to make decisions and
calculate the product cost of the company.
Activity based costing system:
Activity based costing system is new method in cost accounting. In this cost
accounting method, cost of production house is collected and allocated to each of cost driver
on the basis of their cost centre. Cost centre and relevant base of production house is used in
this method to assign the cost to each of the production cost (Hansen, Mowen and Guan,
2009). This method assists an organization to draw all the indirect and there overhead cost in
the production department of the company.
10
Traditional costing system:
Traditional costing system is one of the oldest techniques in cost accounting. In this
cost accounting method, cost of production house is collected and allocated to each of cost
driver in proportion basis. Average rate of overhead is used in this method to assign the cost
to each of the production cost. This method assists an organization to draw all the indirect
and there overhead cost in the production department of the company (Drury, 2013).
The main deficiency of this method is cost assignment process. The total indirect
production cost of the company is assigned to production department on the basis of overhead
cost. It directly impact over the management decision (Garrison, Noreen, Brewer and
McGowan, 2010). However, in case of ABC costing, cost is assigned to each of the
production house on the basis of their cost centre.
In case of Centuria, traditional costing system has not played a vital role. This costing
system has manipulated the decision of management through discovering the wrong product
cost. Low maintained reduction in product and various other issues have been faced by the
company because of it. To conclude, this method is not a good one to make decisions and
calculate the product cost of the company.
Activity based costing system:
Activity based costing system is new method in cost accounting. In this cost
accounting method, cost of production house is collected and allocated to each of cost driver
on the basis of their cost centre. Cost centre and relevant base of production house is used in
this method to assign the cost to each of the production cost (Hansen, Mowen and Guan,
2009). This method assists an organization to draw all the indirect and there overhead cost in
the production department of the company.
Secure Best Marks with AI Grader
Need help grading? Try our AI Grader for instant feedback on your assignments.
Management Accounting
11
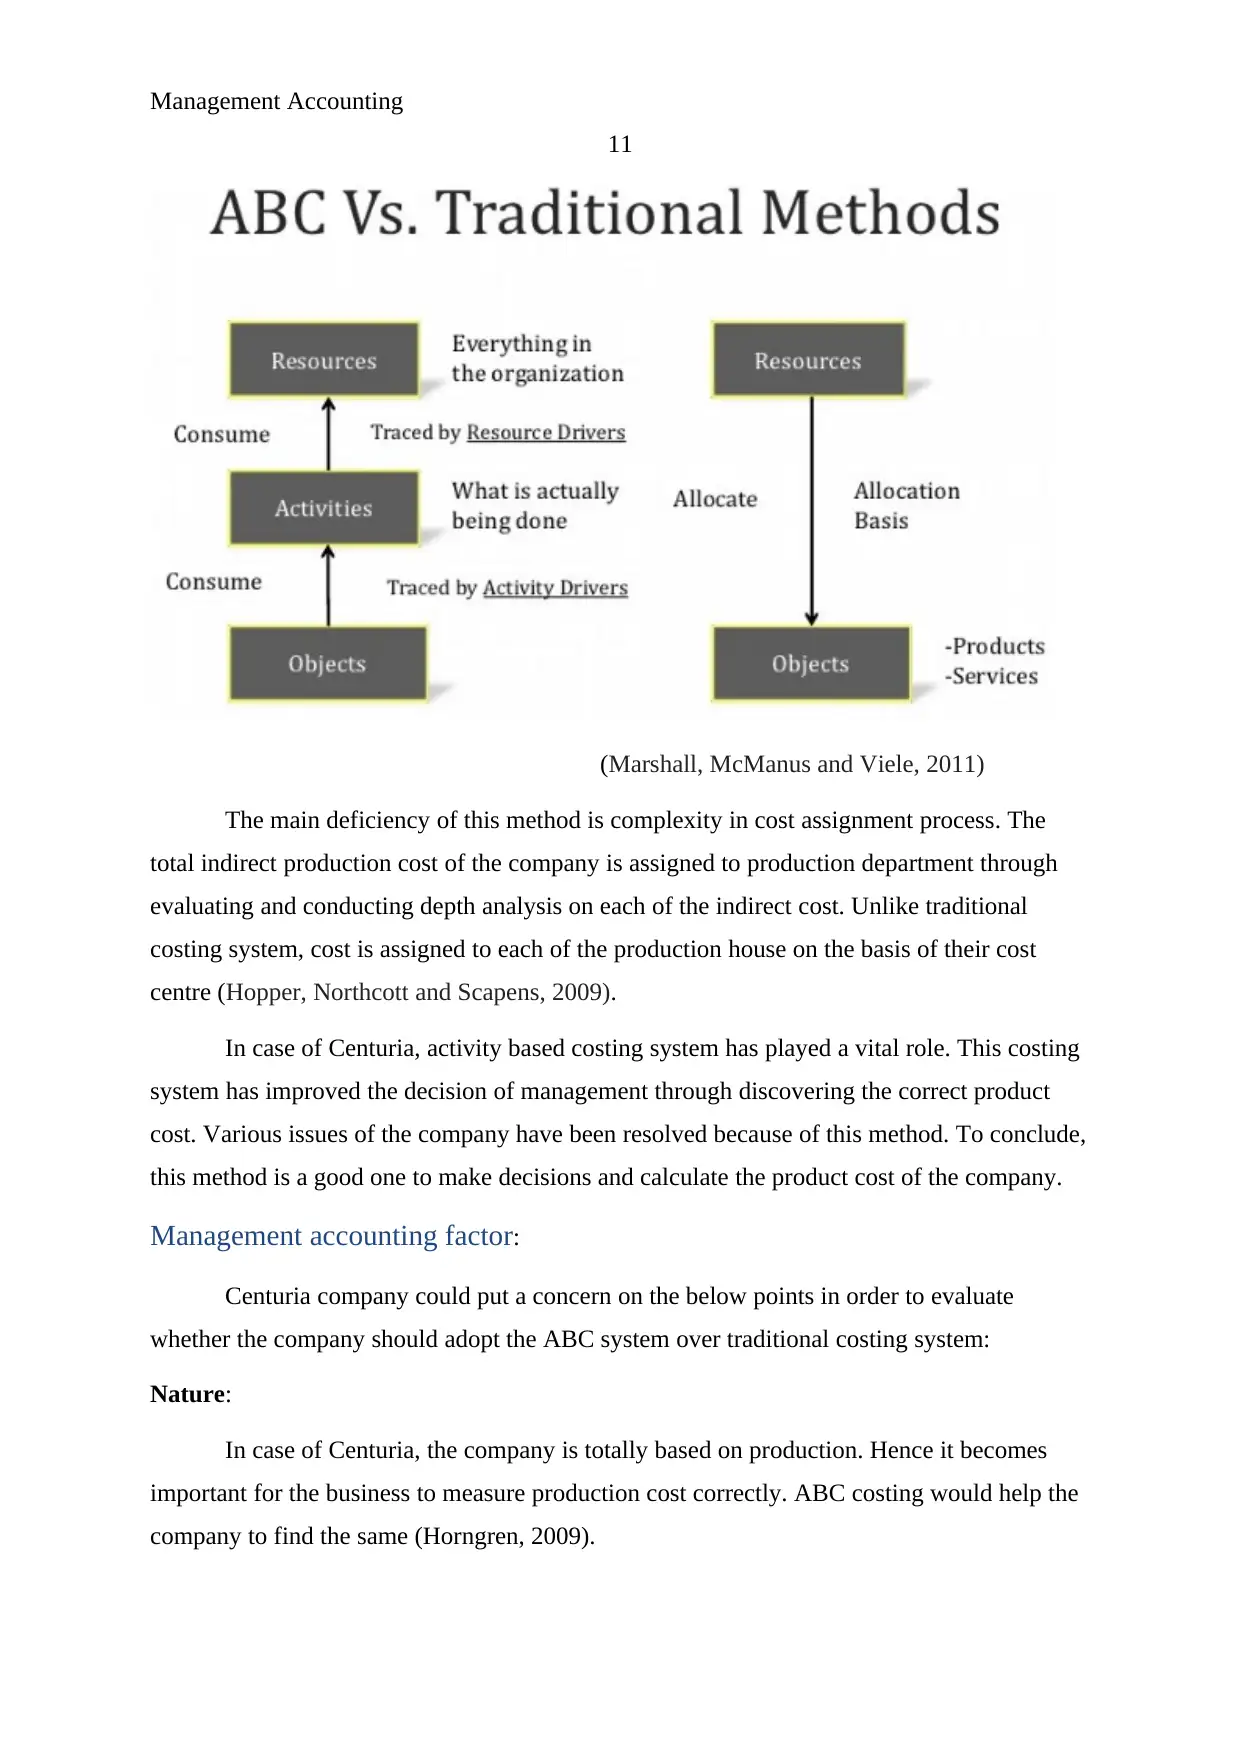
(Marshall, McManus and Viele, 2011)
The main deficiency of this method is complexity in cost assignment process. The
total indirect production cost of the company is assigned to production department through
evaluating and conducting depth analysis on each of the indirect cost. Unlike traditional
costing system, cost is assigned to each of the production house on the basis of their cost
centre (Hopper, Northcott and Scapens, 2009).
In case of Centuria, activity based costing system has played a vital role. This costing
system has improved the decision of management through discovering the correct product
cost. Various issues of the company have been resolved because of this method. To conclude,
this method is a good one to make decisions and calculate the product cost of the company.
Management accounting factor:
Centuria company could put a concern on the below points in order to evaluate
whether the company should adopt the ABC system over traditional costing system:
Nature:
In case of Centuria, the company is totally based on production. Hence it becomes
important for the business to measure production cost correctly. ABC costing would help the
company to find the same (Horngren, 2009).
11
(Marshall, McManus and Viele, 2011)
The main deficiency of this method is complexity in cost assignment process. The
total indirect production cost of the company is assigned to production department through
evaluating and conducting depth analysis on each of the indirect cost. Unlike traditional
costing system, cost is assigned to each of the production house on the basis of their cost
centre (Hopper, Northcott and Scapens, 2009).
In case of Centuria, activity based costing system has played a vital role. This costing
system has improved the decision of management through discovering the correct product
cost. Various issues of the company have been resolved because of this method. To conclude,
this method is a good one to make decisions and calculate the product cost of the company.
Management accounting factor:
Centuria company could put a concern on the below points in order to evaluate
whether the company should adopt the ABC system over traditional costing system:
Nature:
In case of Centuria, the company is totally based on production. Hence it becomes
important for the business to measure production cost correctly. ABC costing would help the
company to find the same (Horngren, 2009).
Management Accounting
12
Amount:
In case of Centuria, it is important for the company to calculated exact amount of
production for each of the product. Hence, it becomes important for the business to measure
production cost correctly. ABC costing would help the company to find the same.
Rigidness of employees:
Company is using traditional costing system from last 15 years. Hence, it would be bit
tough for the employees of the company to shift to ABC. A proper discussion must be done
by the company before making any decision (Silvi, Bartolini and Hines, 2017).
Total number of product:
In case of Centuria, the company is producing 2 products. Hence, it becomes
important for the business to measure production cost of each of the product correctly. ABC
costing would help the company to find the same.
Benefit of ABC costing:
More to it, the ABC costing would help the business in below manner:
classify the correct cost on the basis of associated product and services
ABC technique is recognized concerned and appreciated in practice life.
It improves the profit and prosperity of a production house.
Differentiate in services and products of a manufacturing house (Kaplan and
Anderson, 2013).
Cost and limitation of ABC costing:
The analysis explains that huge difference is there among the allocation of overhead
cost of the company in traditional and activity based costing. Both the techniques of cost
allocation considers different base to allocate the cost.
Further, it has been measured that the outcome from ABC method is not always
reliable. It also contains few error which could affect over the management decision of the
company.
Conclusion:
Management Accounting
13
On the basis of calculations over company, a huge difference has been found among
the ABC costing and traditional costing method. The study brief that ABC costing method
would make it easier for the business to reach over better conclusion and ait would also help
the management to make further decisions accordingly for the betterment of the company.
Centuria Company is recommended to use ABC costing method to improve overall process
of the business.
Paraphrase This Document
Need a fresh take? Get an instant paraphrase of this document with our AI Paraphraser
Management Accounting
14
References:
DRURY, C. M. (2013). Management and cost accounting. Springer.
Garrison, R. H., Noreen, E. W., Brewer, P. C., and McGowan, A. (2010). Managerial
accounting. Issues in Accounting Education, 25(4), 792-793.
Hansen, D., Mowen, M., and Guan, L. (2009). Cost management: accounting and control.
Cengage Learning.
Hopper, T., Northcott, D., and Scapens, R. (2009). Issues in management accounting.
Pearson education.
Horngren, C. T. (2009). Cost accounting: A managerial emphasis, 13/e. Pearson Education
India.
Kaplan, R., and Anderson, S. R. (2013). Time-driven activity-based costing: a simpler and
more powerful path to higher profits. Harvard business press.
Marshall, D. H., McManus, W. W., and Viele, D. F. (2011). Accounting. McGraw-Hill
Irwin,.
Silvi, R., Bartolini, M., and Hines, P. (2017). Strategic cost management and lean thinking: A
framework for management accounting. Issues in management accounting. Pearson
education.
1 out of 14
Related Documents


Your All-in-One AI-Powered Toolkit for Academic Success.
+13062052269
info@desklib.com
Available 24*7 on WhatsApp / Email
![[object Object]](/_next/static/media/star-bottom.7253800d.svg)
Unlock your academic potential
© 2024 | Zucol Services PVT LTD | All rights reserved.