Management Accounting Project Report
VerifiedAdded on 2022/11/14
|14
|3542
|252
AI Summary
This Management Accounting Project Report includes schedules, activities, and resource drivers used in blending, custard tart, and other activities. It covers traditional and activity-based costing systems, management accounting factors, benefits, costs, and limitations. The report also provides references for further reading.
Contribute Materials
Your contribution can guide someone’s learning journey. Share your
documents today.
Running Head: Management Accounting
1
Project Report: Management Accounting
1
Project Report: Management Accounting
Secure Best Marks with AI Grader
Need help grading? Try our AI Grader for instant feedback on your assignments.
Management Accounting
2
Contents
Answer 1, 2, 3 and 4.........................................................................................................3
Schedule 1.....................................................................................................................3
Schedule 2.....................................................................................................................3
Schedule 3.....................................................................................................................3
Schedule 4.....................................................................................................................4
Schedule 5.....................................................................................................................6
Schedule 6.....................................................................................................................7
Answer 5...........................................................................................................................8
Answer 6...........................................................................................................................8
Answer 7...........................................................................................................................9
Answer 8 and 9.................................................................................................................9
Introduction...................................................................................................................9
Traditional costing system..........................................................................................10
Activity based costing system....................................................................................10
Management accounting factor...................................................................................11
Benefit, cost and limitations.......................................................................................12
Conclusion..................................................................................................................12
References.......................................................................................................................13
Management Accounting
3
Answer 1, 2, 3 and 4:
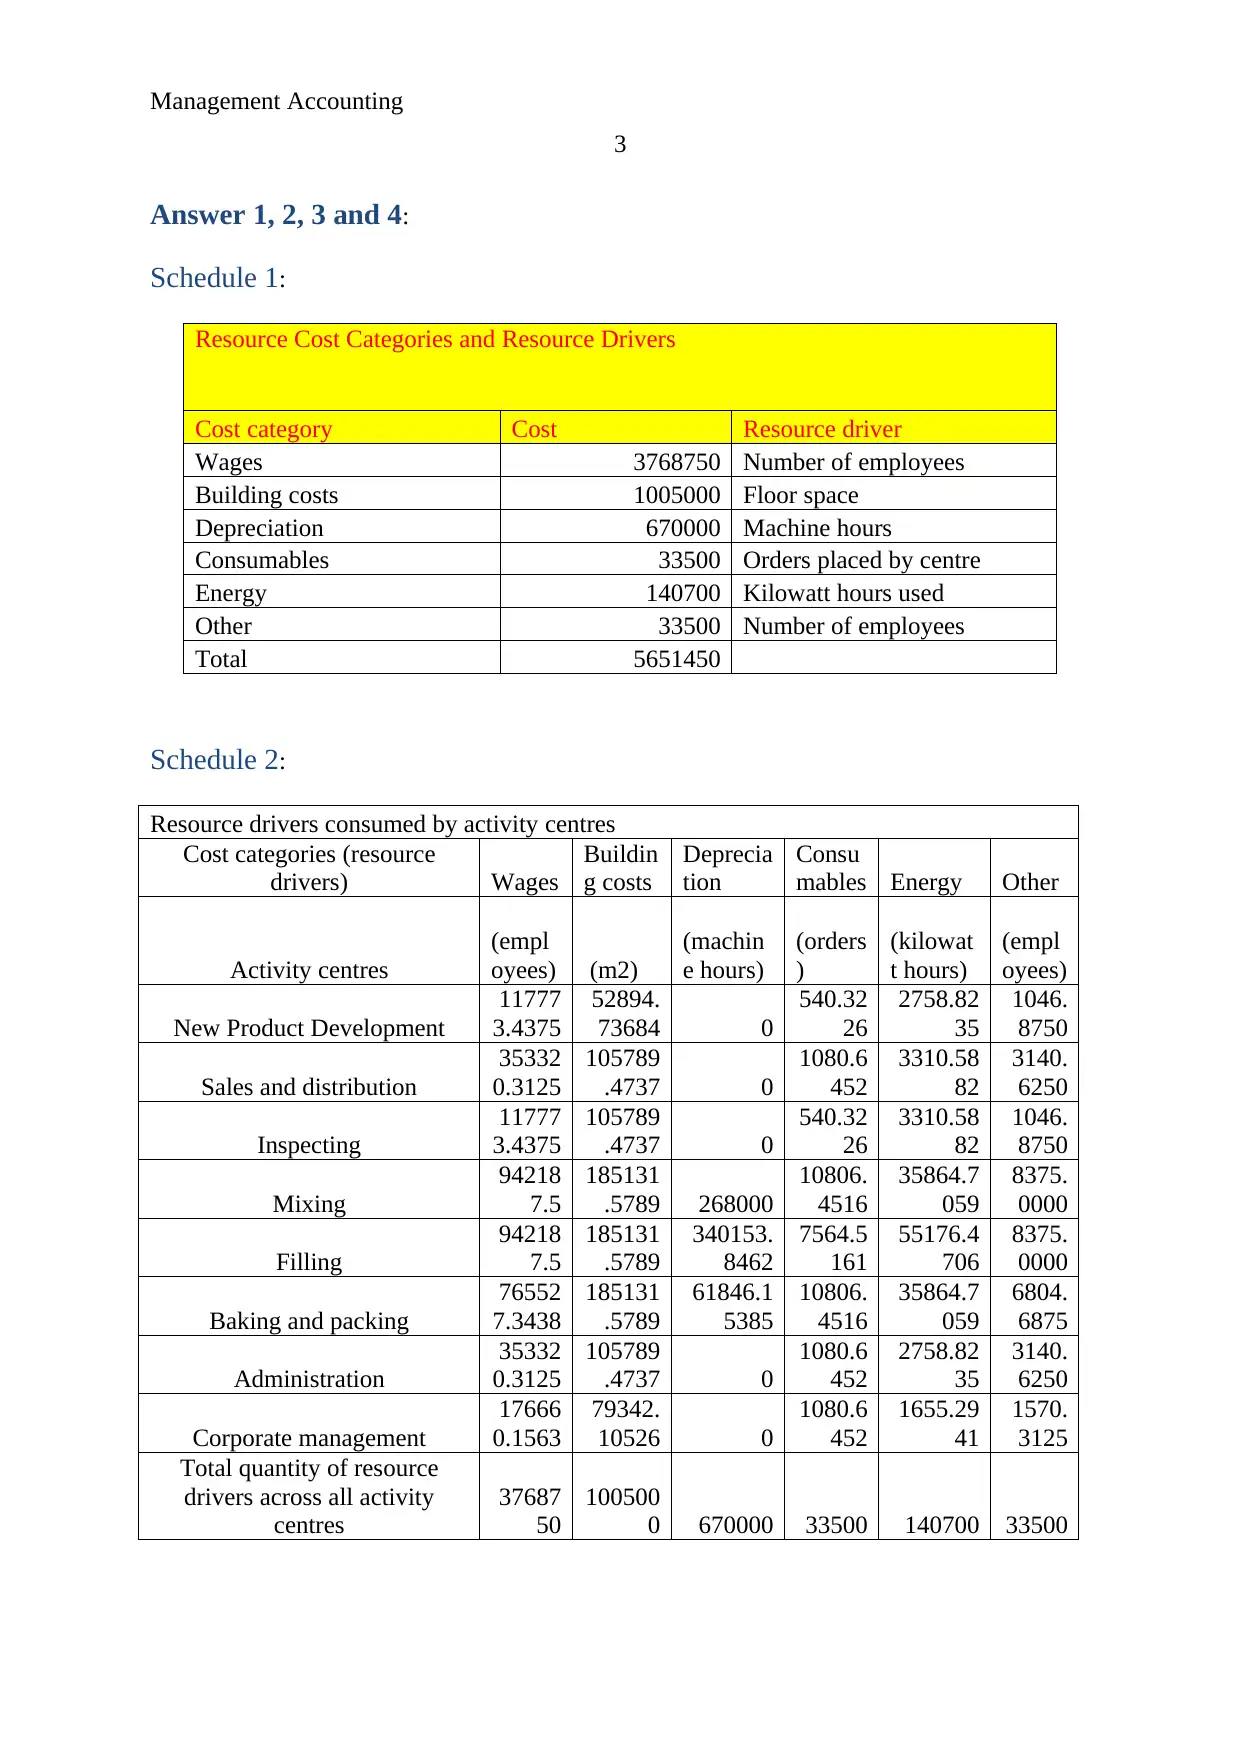
Schedule 1:
Resource Cost Categories and Resource Drivers
Cost category Cost Resource driver
Wages 3768750 Number of employees
Building costs 1005000 Floor space
Depreciation 670000 Machine hours
Consumables 33500 Orders placed by centre
Energy 140700 Kilowatt hours used
Other 33500 Number of employees
Total 5651450
Schedule 2:
Resource drivers consumed by activity centres
Cost categories (resource
drivers) Wages
Buildin
g costs
Deprecia
tion
Consu
mables Energy Other
Activity centres
(empl
oyees) (m2)
(machin
e hours)
(orders
)
(kilowat
t hours)
(empl
oyees)
New Product Development
11777
3.4375
52894.
73684 0
540.32
26
2758.82
35
1046.
8750
Sales and distribution
35332
0.3125
105789
.4737 0
1080.6
452
3310.58
82
3140.
6250
Inspecting
11777
3.4375
105789
.4737 0
540.32
26
3310.58
82
1046.
8750
Mixing
94218
7.5
185131
.5789 268000
10806.
4516
35864.7
059
8375.
0000
Filling
94218
7.5
185131
.5789
340153.
8462
7564.5
161
55176.4
706
8375.
0000
Baking and packing
76552
7.3438
185131
.5789
61846.1
5385
10806.
4516
35864.7
059
6804.
6875
Administration
35332
0.3125
105789
.4737 0
1080.6
452
2758.82
35
3140.
6250
Corporate management
17666
0.1563
79342.
10526 0
1080.6
452
1655.29
41
1570.
3125
Total quantity of resource
drivers across all activity
centres
37687
50
100500
0 670000 33500 140700 33500
3
Answer 1, 2, 3 and 4:
Schedule 1:
Resource Cost Categories and Resource Drivers
Cost category Cost Resource driver
Wages 3768750 Number of employees
Building costs 1005000 Floor space
Depreciation 670000 Machine hours
Consumables 33500 Orders placed by centre
Energy 140700 Kilowatt hours used
Other 33500 Number of employees
Total 5651450
Schedule 2:
Resource drivers consumed by activity centres
Cost categories (resource
drivers) Wages
Buildin
g costs
Deprecia
tion
Consu
mables Energy Other
Activity centres
(empl
oyees) (m2)
(machin
e hours)
(orders
)
(kilowat
t hours)
(empl
oyees)
New Product Development
11777
3.4375
52894.
73684 0
540.32
26
2758.82
35
1046.
8750
Sales and distribution
35332
0.3125
105789
.4737 0
1080.6
452
3310.58
82
3140.
6250
Inspecting
11777
3.4375
105789
.4737 0
540.32
26
3310.58
82
1046.
8750
Mixing
94218
7.5
185131
.5789 268000
10806.
4516
35864.7
059
8375.
0000
Filling
94218
7.5
185131
.5789
340153.
8462
7564.5
161
55176.4
706
8375.
0000
Baking and packing
76552
7.3438
185131
.5789
61846.1
5385
10806.
4516
35864.7
059
6804.
6875
Administration
35332
0.3125
105789
.4737 0
1080.6
452
2758.82
35
3140.
6250
Corporate management
17666
0.1563
79342.
10526 0
1080.6
452
1655.29
41
1570.
3125
Total quantity of resource
drivers across all activity
centres
37687
50
100500
0 670000 33500 140700 33500
Management Accounting
4
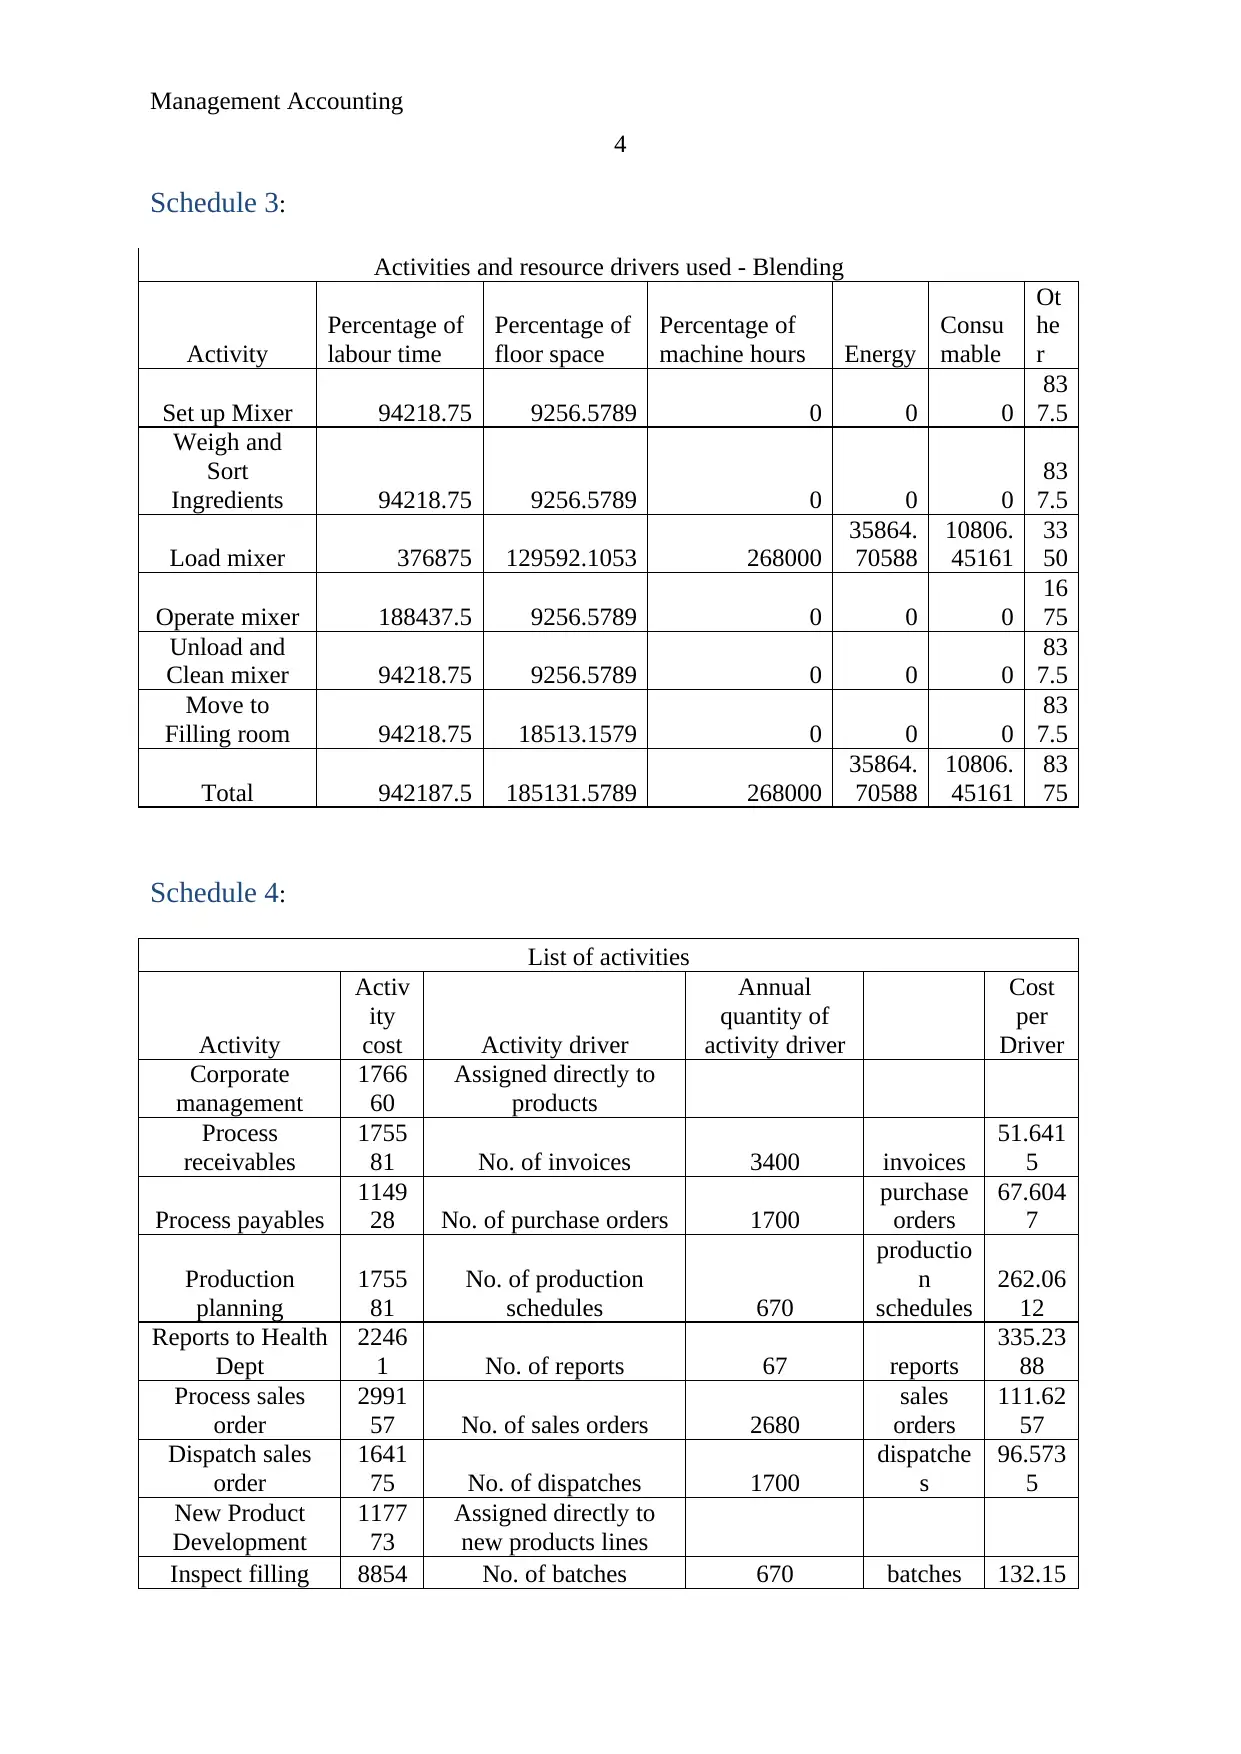
Schedule 3:
Activities and resource drivers used - Blending
Activity
Percentage of
labour time
Percentage of
floor space
Percentage of
machine hours Energy
Consu
mable
Ot
he
r
Set up Mixer 94218.75 9256.5789 0 0 0
83
7.5
Weigh and
Sort
Ingredients 94218.75 9256.5789 0 0 0
83
7.5
Load mixer 376875 129592.1053 268000
35864.
70588
10806.
45161
33
50
Operate mixer 188437.5 9256.5789 0 0 0
16
75
Unload and
Clean mixer 94218.75 9256.5789 0 0 0
83
7.5
Move to
Filling room 94218.75 18513.1579 0 0 0
83
7.5
Total 942187.5 185131.5789 268000
35864.
70588
10806.
45161
83
75
Schedule 4:
List of activities
Activity
Activ
ity
cost Activity driver
Annual
quantity of
activity driver
Cost
per
Driver
Corporate
management
1766
60
Assigned directly to
products
Process
receivables
1755
81 No. of invoices 3400 invoices
51.641
5
Process payables
1149
28 No. of purchase orders 1700
purchase
orders
67.604
7
Production
planning
1755
81
No. of production
schedules 670
productio
n
schedules
262.06
12
Reports to Health
Dept
2246
1 No. of reports 67 reports
335.23
88
Process sales
order
2991
57 No. of sales orders 2680
sales
orders
111.62
57
Dispatch sales
order
1641
75 No. of dispatches 1700
dispatche
s
96.573
5
New Product
Development
1177
73
Assigned directly to
new products lines
Inspect filling 8854 No. of batches 670 batches 132.15
4
Schedule 3:
Activities and resource drivers used - Blending
Activity
Percentage of
labour time
Percentage of
floor space
Percentage of
machine hours Energy
Consu
mable
Ot
he
r
Set up Mixer 94218.75 9256.5789 0 0 0
83
7.5
Weigh and
Sort
Ingredients 94218.75 9256.5789 0 0 0
83
7.5
Load mixer 376875 129592.1053 268000
35864.
70588
10806.
45161
33
50
Operate mixer 188437.5 9256.5789 0 0 0
16
75
Unload and
Clean mixer 94218.75 9256.5789 0 0 0
83
7.5
Move to
Filling room 94218.75 18513.1579 0 0 0
83
7.5
Total 942187.5 185131.5789 268000
35864.
70588
10806.
45161
83
75
Schedule 4:
List of activities
Activity
Activ
ity
cost Activity driver
Annual
quantity of
activity driver
Cost
per
Driver
Corporate
management
1766
60
Assigned directly to
products
Process
receivables
1755
81 No. of invoices 3400 invoices
51.641
5
Process payables
1149
28 No. of purchase orders 1700
purchase
orders
67.604
7
Production
planning
1755
81
No. of production
schedules 670
productio
n
schedules
262.06
12
Reports to Health
Dept
2246
1 No. of reports 67 reports
335.23
88
Process sales
order
2991
57 No. of sales orders 2680
sales
orders
111.62
57
Dispatch sales
order
1641
75 No. of dispatches 1700
dispatche
s
96.573
5
New Product
Development
1177
73
Assigned directly to
new products lines
Inspect filling 8854 No. of batches 670 batches 132.15
Secure Best Marks with AI Grader
Need help grading? Try our AI Grader for instant feedback on your assignments.
Management Accounting
5
ingredients 1 07
Disposal of
substandard
ingredients
2246
1 No. of batches 670 batches
33.523
9
Move to mixing
room
2246
1 No. of batches 670 batches
33.523
9
Set up Mixer
1043
12.82
89 No. of batches 670 batches
155.69
08
Weigh and Sort
Ingredients
1043
12.82
89 No. of batches 670 batches
155.69
08
Load Mixer
8244
88.26
28 No. of kilograms 134000
kilogram
s 6.1529
Operate Mixer
1993
69.07
89 No. of batches 670 batches
297.56
58
Unload and
Clean Mixer
1043
12.82
89 No. of batches 670 batches
155.69
08
Move to Filling
room
1135
69.40
79 No. of batches 670 batches
169.50
66
Set up pastry
cases
5678
5 No. of batches 670 batches
84.753
7
Stack cases on
filling machine
1043
13 No. of batches 670 batches
155.69
10
Load Hopper
2086
26 No. of batches 670 batches
311.38
21
Fill pastry cases
9892
55 No. of kilograms 134000
kilogram
s 7.3825
Clean Hopper
1135
69 No. of batches 670 batches
169.50
60
Move to baking
6604
1 No. of kilograms 134000
kilogram
s 0.4928
Stack cases on
baking trays
2393
66 No. of products 536000 products 0.4466
Setup ovens
8649
0 No. of trays 10720 trays 8.0681
Move to ovens
4787
3 No. of trays 10720 trays 4.4658
Bake products
5872
49 No. of trays 10720 trays
54.780
7
Unload oven
4787
3 No. of trays 10720 trays 4.4658
Inspect finished
products
4622
5 No. of trays 10720 trays 4.3120
Management Accounting
6
Disposal of
substandard
product
2246
1 No. of trays 10720 trays 2.0952
Move to truck
5713
0 No. of trays 10180
Finished
trays 5.6120
* All
Calculations to 4
decimal places
“??” indicates that
these figures must be
calculated.
Schedule 5:
Custard Tart
Activities consumed
Annual quantity of
activity driver
Corporate management 52450 Assigned directly to products
Process receivables 15492.4412 invoices
Process payables 6760.4706 purchase orders
Production planning 41929.7910 production schedules
Reports to Health Dept 5363.8209 reports
Process sales order 37952.7537 sales orders
Dispatch sales order 28972.0588 dispatches
New Product Development 0.0000
Assigned directly to new
products lines
Inspect filling ingredients 21144.1194 batches
Disposal of substandard
ingredients 5363.8209 batches
Move to mixing room 5363.8209 batches
Set up Mixer 24910.5263 batches
Weigh and Sort Ingredients 24910.5263 batches
Load Mixer 166128.2320 kilograms
Operate Mixer 47610.5263 batches
Unload and Clean Mixer 24910.5263 batches
Move to Filling room 27121.0526 batches
Set up pastry cases 13560.5970 batches
Stack cases on filling
machine 24910.5672 batches
Load Hopper 49821.1343 batches
Fill pastry cases 199327.5000 kilograms
Clean Hopper 27120.9552 batches
Move to baking 13306.7687 kilograms
Stack cases on baking trays 47873.2000 products
Setup ovens 8713.5448 trays
Move to ovens 4823.0261 trays
Management Accounting
7
Bake products 59163.1455 trays
Unload oven 4823.0261 trays
Inspect finished products 0.0000 trays
Disposal of substandard
product 0.0000 trays
Move to truck 6060.9430 Finished trays
Direct Materials 1
per kilogram
Assigned directly to products
Current Market Selling Price 9 per unit of product
Batch size 700
Annual Volume 108000
* All Calculations to 4
decimal places
Total Indirect Cost 995888.8953
Per Unit Indirect cost 9.2212
Schedule 6:
Apple and Cinnamon Danish
Activities consumed
Annual quantity of
activity driver
Corporate management 6313 Assigned directly to products
Process receivables 5164.1471 invoices
Process payables 6760.4706 purchase orders
Production planning 7861.8358 production schedules
Reports to Health Dept 1676.1940 reports
Process sales order 11162.5746 sales orders
Dispatch sales order 9657.3529 dispatches
New Product Development 57755.0000
Assigned directly to new
products lines
Inspect filling ingredients 6607.5373 batches
Disposal of substandard
ingredients 1676.1940 batches
Move to mixing room 1676.1940 batches
Set up Mixer 7784.5395 batches
Weigh and Sort Ingredients 7784.5395 batches
Load Mixer 39993.8336 kilograms
Operate Mixer 14878.2895 batches
Unload and Clean Mixer 7784.5395 batches
Move to Filling room 8475.3289 batches
Set up pastry cases 4237.6866 batches
Stack cases on filling
machine 7784.5522 batches
Paraphrase This Document
Need a fresh take? Get an instant paraphrase of this document with our AI Paraphraser
Management Accounting
8
Load Hopper 15569.1045 batches
Fill pastry cases 47986.2500 kilograms
Clean Hopper 8475.2985 batches
Move to baking 3203.4813 kilograms
Stack cases on baking trays 5984.1500 products
Setup ovens 2178.3862 trays
Move to ovens 1205.7565 trays
Bake products 14790.7864 trays
Unload oven 1205.7565 trays
Inspect finished products 1164.2491 trays
Disposal of substandard
product 565.7155 trays
Move to truck 1459.1159 Finished trays
Direct Materials 4
per kilogram
Assigned directly to products
Current Market Selling Price 12.0000 per unit of product
Batch size 500
Annual Volume 27500
* All Calculations to 4
decimal places
Total Indirect Cost 318821.8602
Per Unit Indirect cost 11.5935
Computation of Traditional Cost
Sl
No Particular
Traditional
Costing
Activity
Costing Difference
1 Total Indirect Cost 5651450
2 Total Annual Units produced 500000
3 Per Unit Indirect Cost 11.3029
4 Cost For Custard Tart 1220713.2 995888.8953
224824.304
7
5
Cost for Apple and Cinnamon
Dash 146937.7 318821.8602
-
171884.160
2
Answer 5:
On the basis of above calculations, it has been measured that the product cost of from
traditional costing system and activity based costing system is different. The reason behind
difference in the cost is due to the different process and consideration of both the accounting
system.
Management Accounting
9
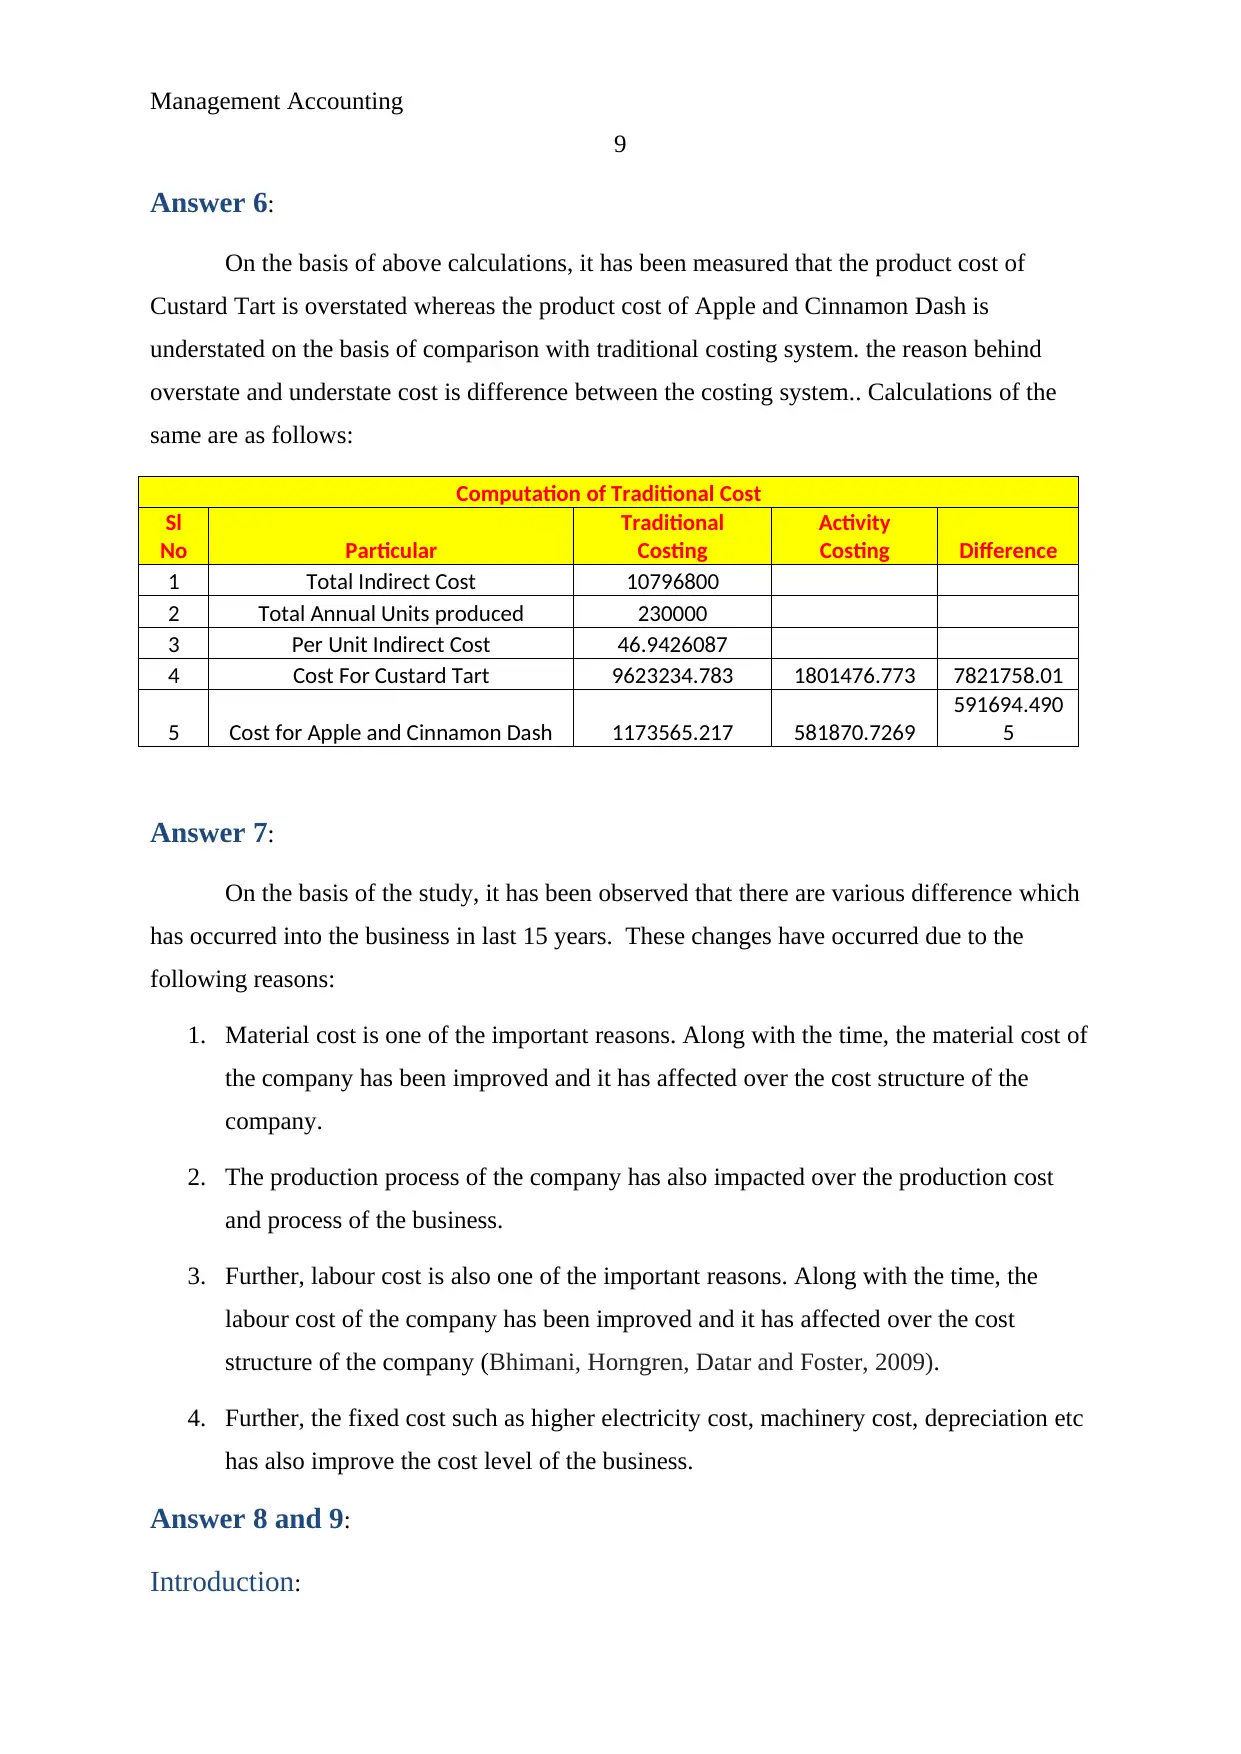
Answer 6:
On the basis of above calculations, it has been measured that the product cost of
Custard Tart is overstated whereas the product cost of Apple and Cinnamon Dash is
understated on the basis of comparison with traditional costing system. the reason behind
overstate and understate cost is difference between the costing system.. Calculations of the
same are as follows:
Computation of Traditional Cost
Sl
No Particular
Traditional
Costing
Activity
Costing Difference
1 Total Indirect Cost 10796800
2 Total Annual Units produced 230000
3 Per Unit Indirect Cost 46.9426087
4 Cost For Custard Tart 9623234.783 1801476.773 7821758.01
5 Cost for Apple and Cinnamon Dash 1173565.217 581870.7269
591694.490
5
Answer 7:
On the basis of the study, it has been observed that there are various difference which
has occurred into the business in last 15 years. These changes have occurred due to the
following reasons:
1. Material cost is one of the important reasons. Along with the time, the material cost of
the company has been improved and it has affected over the cost structure of the
company.
2. The production process of the company has also impacted over the production cost
and process of the business.
3. Further, labour cost is also one of the important reasons. Along with the time, the
labour cost of the company has been improved and it has affected over the cost
structure of the company (Bhimani, Horngren, Datar and Foster, 2009).
4. Further, the fixed cost such as higher electricity cost, machinery cost, depreciation etc
has also improve the cost level of the business.
Answer 8 and 9:
Introduction:
9
Answer 6:
On the basis of above calculations, it has been measured that the product cost of
Custard Tart is overstated whereas the product cost of Apple and Cinnamon Dash is
understated on the basis of comparison with traditional costing system. the reason behind
overstate and understate cost is difference between the costing system.. Calculations of the
same are as follows:
Computation of Traditional Cost
Sl
No Particular
Traditional
Costing
Activity
Costing Difference
1 Total Indirect Cost 10796800
2 Total Annual Units produced 230000
3 Per Unit Indirect Cost 46.9426087
4 Cost For Custard Tart 9623234.783 1801476.773 7821758.01
5 Cost for Apple and Cinnamon Dash 1173565.217 581870.7269
591694.490
5
Answer 7:
On the basis of the study, it has been observed that there are various difference which
has occurred into the business in last 15 years. These changes have occurred due to the
following reasons:
1. Material cost is one of the important reasons. Along with the time, the material cost of
the company has been improved and it has affected over the cost structure of the
company.
2. The production process of the company has also impacted over the production cost
and process of the business.
3. Further, labour cost is also one of the important reasons. Along with the time, the
labour cost of the company has been improved and it has affected over the cost
structure of the company (Bhimani, Horngren, Datar and Foster, 2009).
4. Further, the fixed cost such as higher electricity cost, machinery cost, depreciation etc
has also improve the cost level of the business.
Answer 8 and 9:
Introduction:
Management Accounting
10
Costing is a strategy or a system that is utilizes by organizations to collect, evaluate,
distribute and manage the expense to every asset driver and every component of costing and
overheads in an production organization. Costing method must be successful as a compelling
and huge costing strategy which offers the required information, certainty sheet and data to
the administrators and the organization for dealing with the orders, diminishing the waste and
limiting the expense.
Costing systems are constantly utilized by each manufacturing house to improve the
benefits and limit the expenses to accomplish the objectives and upgrade the value of the
manufacturing house. This report has been set up to examine the exchanging costing strategy
and movement costing technique (Drury, 2013). This report delineates about the inadequacies
of both the systems.
The case study of Centuria Company has been studied. The company is operating
since last 15 years in the market and producing various products in the market. the company
is using traduitional costing system from last 15 years to manage the cost of the company.
Howevre, along with the time, the management of the company is seeking changes. Hence,
the company is planning to adopt activity based costing.
Traditional costing system:
Traditional costing framework is one of the most used and oldest method among each
of the strategies of cost accounting method. This system is utilized by the manufacturing
house and organizations to identify classify and allocate the expense to each cost driver and
component of cost accounting system. This procedure does not investigate the complexity
data of the manufacturing house. It assigns all the expense to the cost centre as per the normal
rate of overhead. This technique recommends the organization to draw all the indirect
overhead and other overhead expense into the manufacturing division. This strategy just uses
one cost driver to apply all the expense similarly to each item.
The principle deficiency with this strategy is its technique for appointing cost. It
allocates the whole indirect expense under the manufacturing head and it has an effect over
the expense of manufacturing by expanding it. This system impacts the choice of the
management in regards to the cost (Garrison et al, 2010). In ABC costing method, the cost is
allocated to the production department on the basis of the cost centres.
Secure Best Marks with AI Grader
Need help grading? Try our AI Grader for instant feedback on your assignments.
Management Accounting
11
Through breaking down the contextual analysis of Centuria Company, it has been
recognized that the traditional costing framework isn't agreeable to the organization. Because
of this costing technique, organization has faced numerous issues, for example, decrease in
benefits, low support and different issues. It has been discovered that this method don't give
the precise figures to the management thus that the process and strategies of the business
could be manipulated.
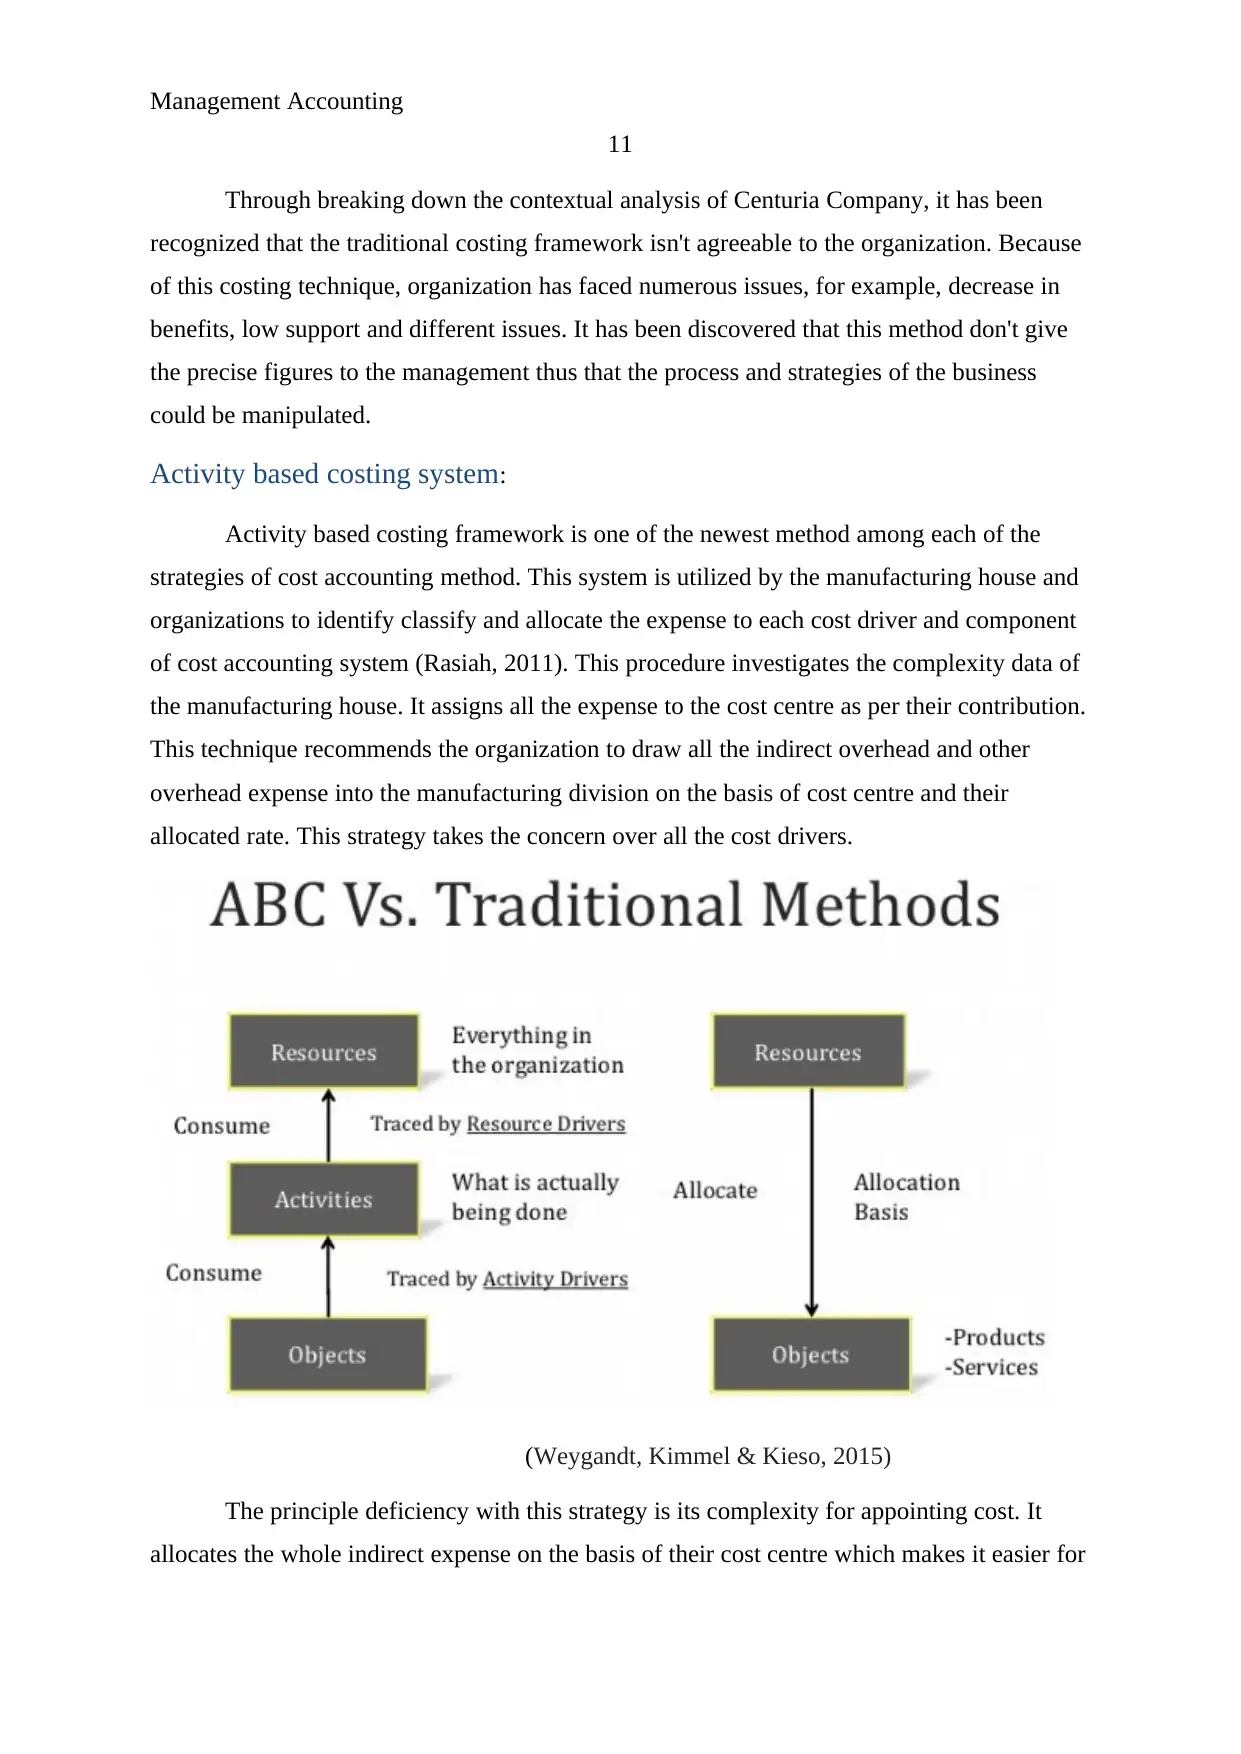
Activity based costing system:
Activity based costing framework is one of the newest method among each of the
strategies of cost accounting method. This system is utilized by the manufacturing house and
organizations to identify classify and allocate the expense to each cost driver and component
of cost accounting system (Rasiah, 2011). This procedure investigates the complexity data of
the manufacturing house. It assigns all the expense to the cost centre as per their contribution.
This technique recommends the organization to draw all the indirect overhead and other
overhead expense into the manufacturing division on the basis of cost centre and their
allocated rate. This strategy takes the concern over all the cost drivers.
(Weygandt, Kimmel & Kieso, 2015)
The principle deficiency with this strategy is its complexity for appointing cost. It
allocates the whole indirect expense on the basis of their cost centre which makes it easier for
11
Through breaking down the contextual analysis of Centuria Company, it has been
recognized that the traditional costing framework isn't agreeable to the organization. Because
of this costing technique, organization has faced numerous issues, for example, decrease in
benefits, low support and different issues. It has been discovered that this method don't give
the precise figures to the management thus that the process and strategies of the business
could be manipulated.
Activity based costing system:
Activity based costing framework is one of the newest method among each of the
strategies of cost accounting method. This system is utilized by the manufacturing house and
organizations to identify classify and allocate the expense to each cost driver and component
of cost accounting system (Rasiah, 2011). This procedure investigates the complexity data of
the manufacturing house. It assigns all the expense to the cost centre as per their contribution.
This technique recommends the organization to draw all the indirect overhead and other
overhead expense into the manufacturing division on the basis of cost centre and their
allocated rate. This strategy takes the concern over all the cost drivers.
(Weygandt, Kimmel & Kieso, 2015)
The principle deficiency with this strategy is its complexity for appointing cost. It
allocates the whole indirect expense on the basis of their cost centre which makes it easier for
Management Accounting
12
the management to make better decision. This system impacts the choice of the management
in regards to the cost (Silvi, Bartolini & Hines, 2017).
Through breaking down the contextual analysis of Centuria Company, it has been
recognized that the activity based costing framework is agreeable to the organization.
Because of this costing technique, it has been discovered that this method would help the
management to improve the overall performance of the company.
Management accounting factor:
Below are few management accounting factors which must be considered by Centuria
company to make decision about ABC costing method:
Nature:
Nature of the business is one of the important factors to be considered. In case of
Centuria, company owns a production house and it is important for the production house to
make decision on the basis of production cost. Hence, it is important for the company to
adopt ABC costing (Bhimani, Horngren, Datar & Foster, 2009).
Amount:
Identifying the exact cost of the business is exact factor. In case of Centuria, company
owns a production house and it is important for the production house to identify the exact
production cost. Hence, it is important for the company to adopt ABC costing (Marshall,
McManus & Viele, 2011).
Rigidness of employees:
Company is working since last 15 years and using the traditional costing system.
Hence it is important for the business to consider their views.
Benefit, cost and limitations:
Benefits of the ABC define that this activity would help the business to resolve the
issue related to the product cost and identify the sales price of the business. Along with that,
it would offer a good base to the management to make better decision about overall related
cost and performance of the business.
On the basis of above calculations, it has been measured that the product cost from
traditional costing system and activity based costing system is different. The reason behind
Management Accounting
13
difference in the cost is due to the different process and consideration by both the accounting
system (Drury, 2013).
Lastly, the main limitation of the company is its complexity and few errors related to
the process. It sometimes manipulate the management to make wrong decisions.
Conclusion:
Through considering the calculations over company, it has been recognized that
various issues are faced by the company due to backward costing system, If company adopts
the new costing system then it would not only improve the profitability level of the business
but also it would help the business to make better decision for the company’s betterment.
Hence, Centuria company is recommended to make the changes in the costing system
and adopt ABC costing method to improve the overall performance of the company.
Paraphrase This Document
Need a fresh take? Get an instant paraphrase of this document with our AI Paraphraser
Management Accounting
14
References:
Bhimani, A., Horngren, C. T., Datar, S. M., & Foster, G. (2009). Management and cost
accounting (Vol. 1). Pearson Education.
DRURY, C. M. (2013). Management and cost accounting. Springer.
Garrison, R. H., Noreen, E. W., Brewer, P. C., & McGowan, A. (2010). Managerial
accounting. Issues in Accounting Education, 25(4), 792-793.
Marshall, D. H., McManus, W. W., & Viele, D. F. (2011). Accounting. McGraw-Hill Irwin,.
Rasiah, D. (2011). Why Activity Based Costing (ABC) is still tagging behind the traditional
costing in Malaysia?. Journal of Applied Finance and Banking, 1(1), 83.
Silvi, R., Bartolini, M., & Hines, P. (2017). Strategic cost management and lean thinking: A
framework for management accounting.
Weygandt, J. J., Kimmel, P. D., & Kieso, D. E. (2015). Financial & Managerial Accounting.
John Wiley & Sons.
1 out of 14
Related Documents


Your All-in-One AI-Powered Toolkit for Academic Success.
+13062052269
info@desklib.com
Available 24*7 on WhatsApp / Email
![[object Object]](/_next/static/media/star-bottom.7253800d.svg)
Unlock your academic potential
© 2024 | Zucol Services PVT LTD | All rights reserved.