Financial Statement Analysis and Review
VerifiedAdded on 2020/04/01
|11
|1702
|197
AI Summary
This assignment provides a detailed financial statement with various line items like revenues, expenses, assets, liabilities, and equity. The user needs to analyze the provided information, calculate key financial ratios, and draw conclusions about the company's profitability, solvency, and overall financial health. Specific figures for income, expenses, profits, and other financial indicators are given in the document.
Contribute Materials
Your contribution can guide someone’s learning journey. Share your
documents today.

Financial Reporting
Secure Best Marks with AI Grader
Need help grading? Try our AI Grader for instant feedback on your assignments.
Executive Summary:
This assignment has been developed to describe that a how a financial report should be
structured for proper understanding of the financial health of the company and also to identify
the financial position of the company within the industry. The assignment describes how the
different financial statements are connected and how the accounting data can be derived in a
meaningful manner from the books of account of a company. After preparing the financial
statements the tools of ratio analysis are to be applied to understand the financial health of the
company and also to identify the possible heads of accounts where measure should be applied for
better performance of the company in comparison to the industry benchmark.
Table of Contents
Executive Summary:........................................................................................................................1
Introduction:....................................................................................................................................1
Results & Findings:.........................................................................................................................1
Discussion:.......................................................................................................................................4
Conclusion & Recommendation......................................................................................................4
Reference:........................................................................................................................................5
Appendix:........................................................................................................................................5
Introduction:
This assignment has been prepared to discuss that how an analyst should proceed step by step
starting from the books of accounts of the company for understanding the financial health of the
company(Biddle et al.,2009). Here the analyst first check the raw books of accounts of the
company and prepare the journal entries for each financial transactions, then the journal entries
are posted to the general leader under the appropriate heads of accounts. After that, the trial
balance has been prepared and then profit & loss accounts and balance sheets have been created
to develop the ratio analysis as the calculated ratios are good indicators of the financial health of
the company. The ratios are then analysed to understand the financial health of the company and
what are the underlying factors that are contributing to the good or bad financial performance of
the company.
Results & Findings:
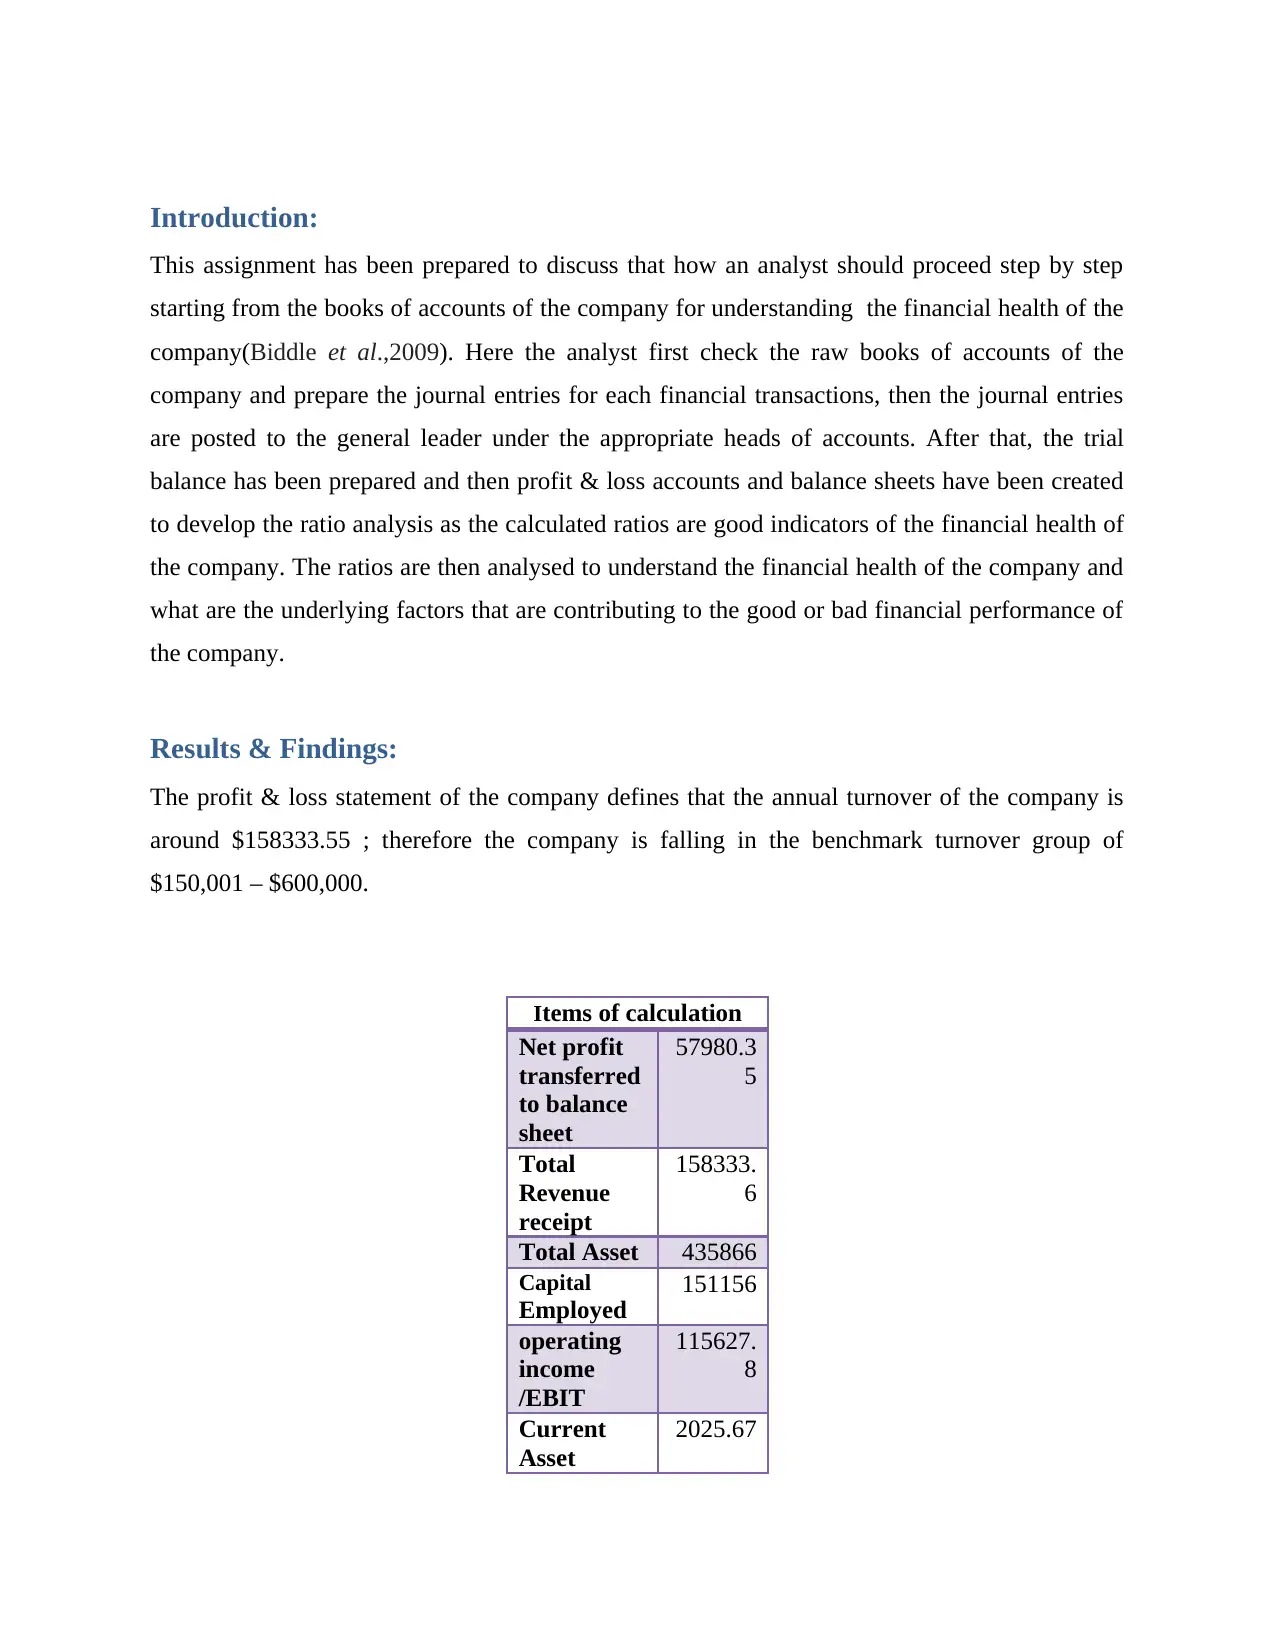
The profit & loss statement of the company defines that the annual turnover of the company is
around $158333.55 ; therefore the company is falling in the benchmark turnover group of
$150,001 – $600,000.
Items of calculation
Net profit
transferred
to balance
sheet
57980.3
5
Total
Revenue
receipt
158333.
6
Total Asset 435866
Capital
Employed
151156
operating
income
/EBIT
115627.
8
Current
Asset
2025.67
This assignment has been prepared to discuss that how an analyst should proceed step by step
starting from the books of accounts of the company for understanding the financial health of the
company(Biddle et al.,2009). Here the analyst first check the raw books of accounts of the
company and prepare the journal entries for each financial transactions, then the journal entries
are posted to the general leader under the appropriate heads of accounts. After that, the trial
balance has been prepared and then profit & loss accounts and balance sheets have been created
to develop the ratio analysis as the calculated ratios are good indicators of the financial health of
the company. The ratios are then analysed to understand the financial health of the company and
what are the underlying factors that are contributing to the good or bad financial performance of
the company.
Results & Findings:
The profit & loss statement of the company defines that the annual turnover of the company is
around $158333.55 ; therefore the company is falling in the benchmark turnover group of
$150,001 – $600,000.
Items of calculation
Net profit
transferred
to balance
sheet
57980.3
5
Total
Revenue
receipt
158333.
6
Total Asset 435866
Capital
Employed
151156
operating
income
/EBIT
115627.
8
Current
Asset
2025.67
Secure Best Marks with AI Grader
Need help grading? Try our AI Grader for instant feedback on your assignments.
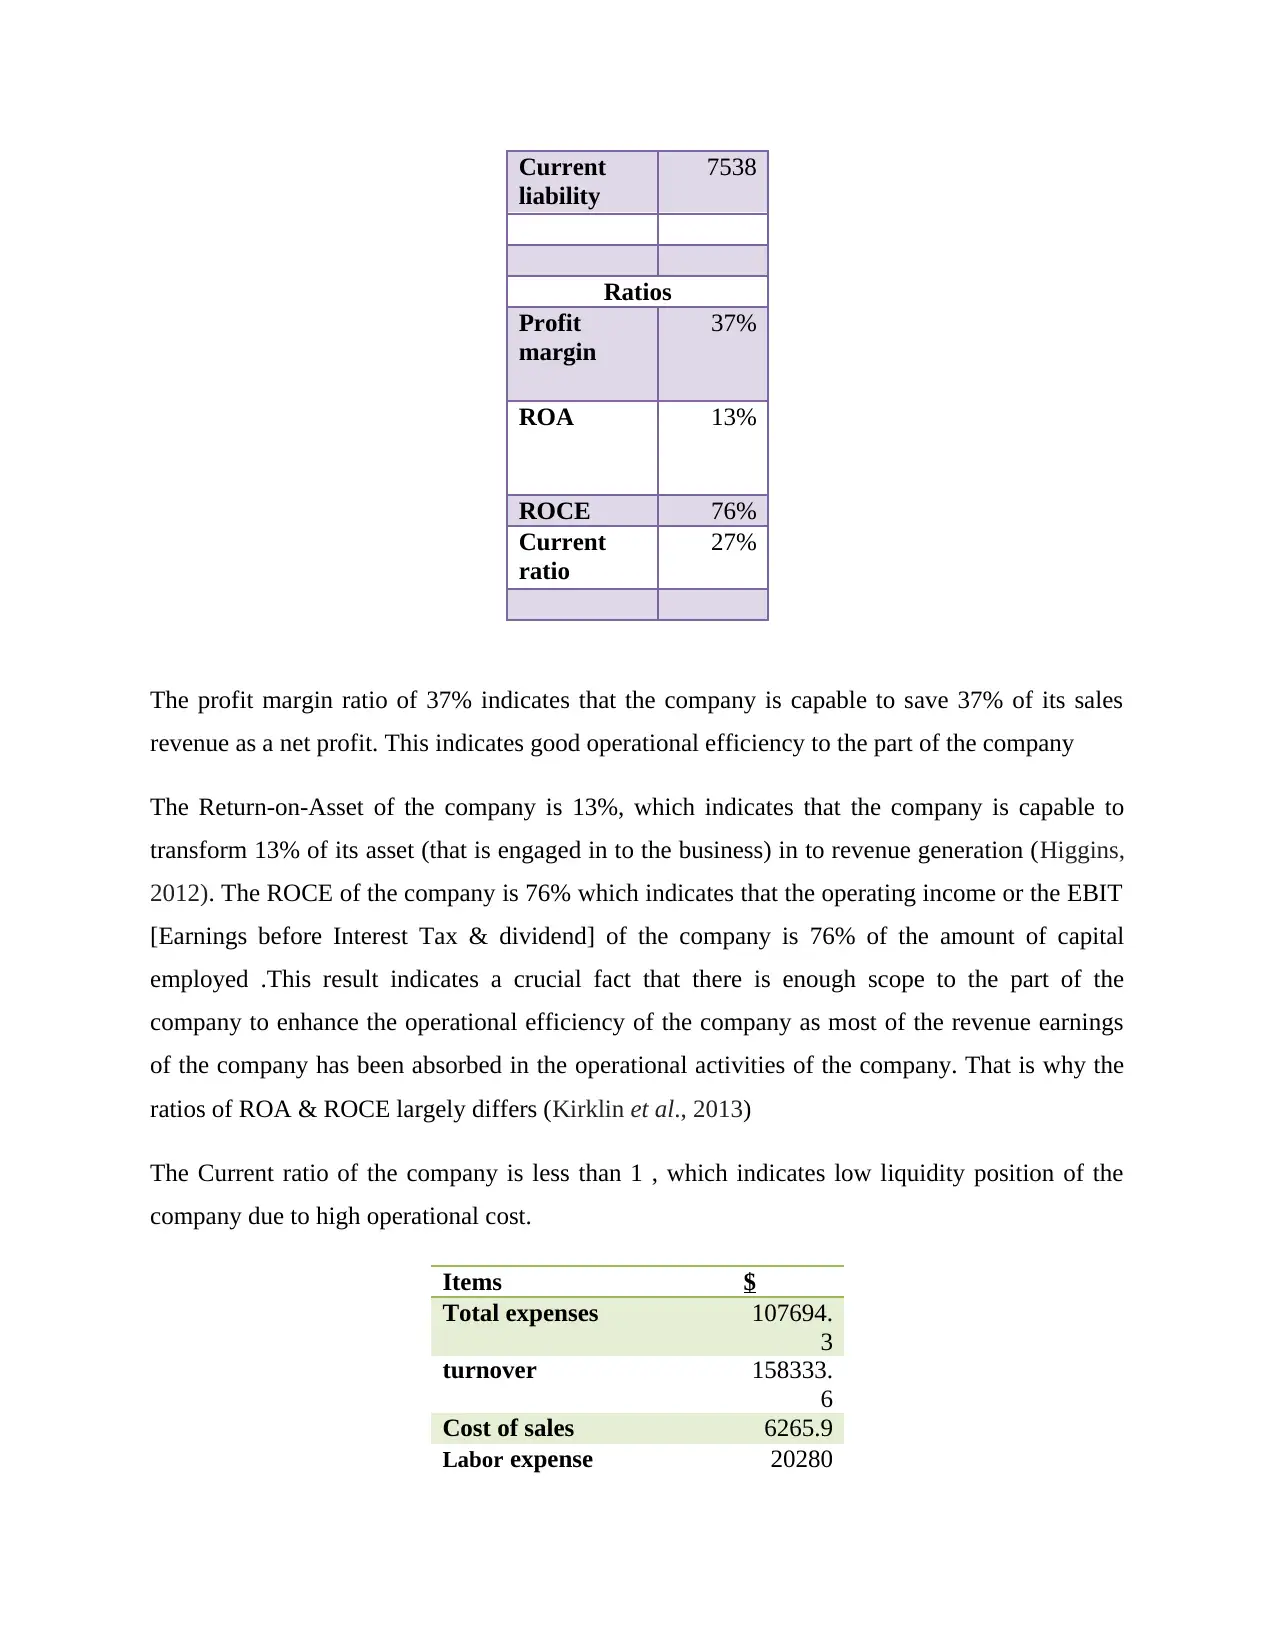
Current
liability
7538
Ratios
Profit
margin
37%
ROA 13%
ROCE 76%
Current
ratio
27%
The profit margin ratio of 37% indicates that the company is capable to save 37% of its sales
revenue as a net profit. This indicates good operational efficiency to the part of the company
The Return-on-Asset of the company is 13%, which indicates that the company is capable to
transform 13% of its asset (that is engaged in to the business) in to revenue generation (Higgins,
2012). The ROCE of the company is 76% which indicates that the operating income or the EBIT
[Earnings before Interest Tax & dividend] of the company is 76% of the amount of capital
employed .This result indicates a crucial fact that there is enough scope to the part of the
company to enhance the operational efficiency of the company as most of the revenue earnings
of the company has been absorbed in the operational activities of the company. That is why the
ratios of ROA & ROCE largely differs (Kirklin et al., 2013)
The Current ratio of the company is less than 1 , which indicates low liquidity position of the
company due to high operational cost.
Items $
Total expenses 107694.
3
turnover 158333.
6
Cost of sales 6265.9
Labor expense 20280
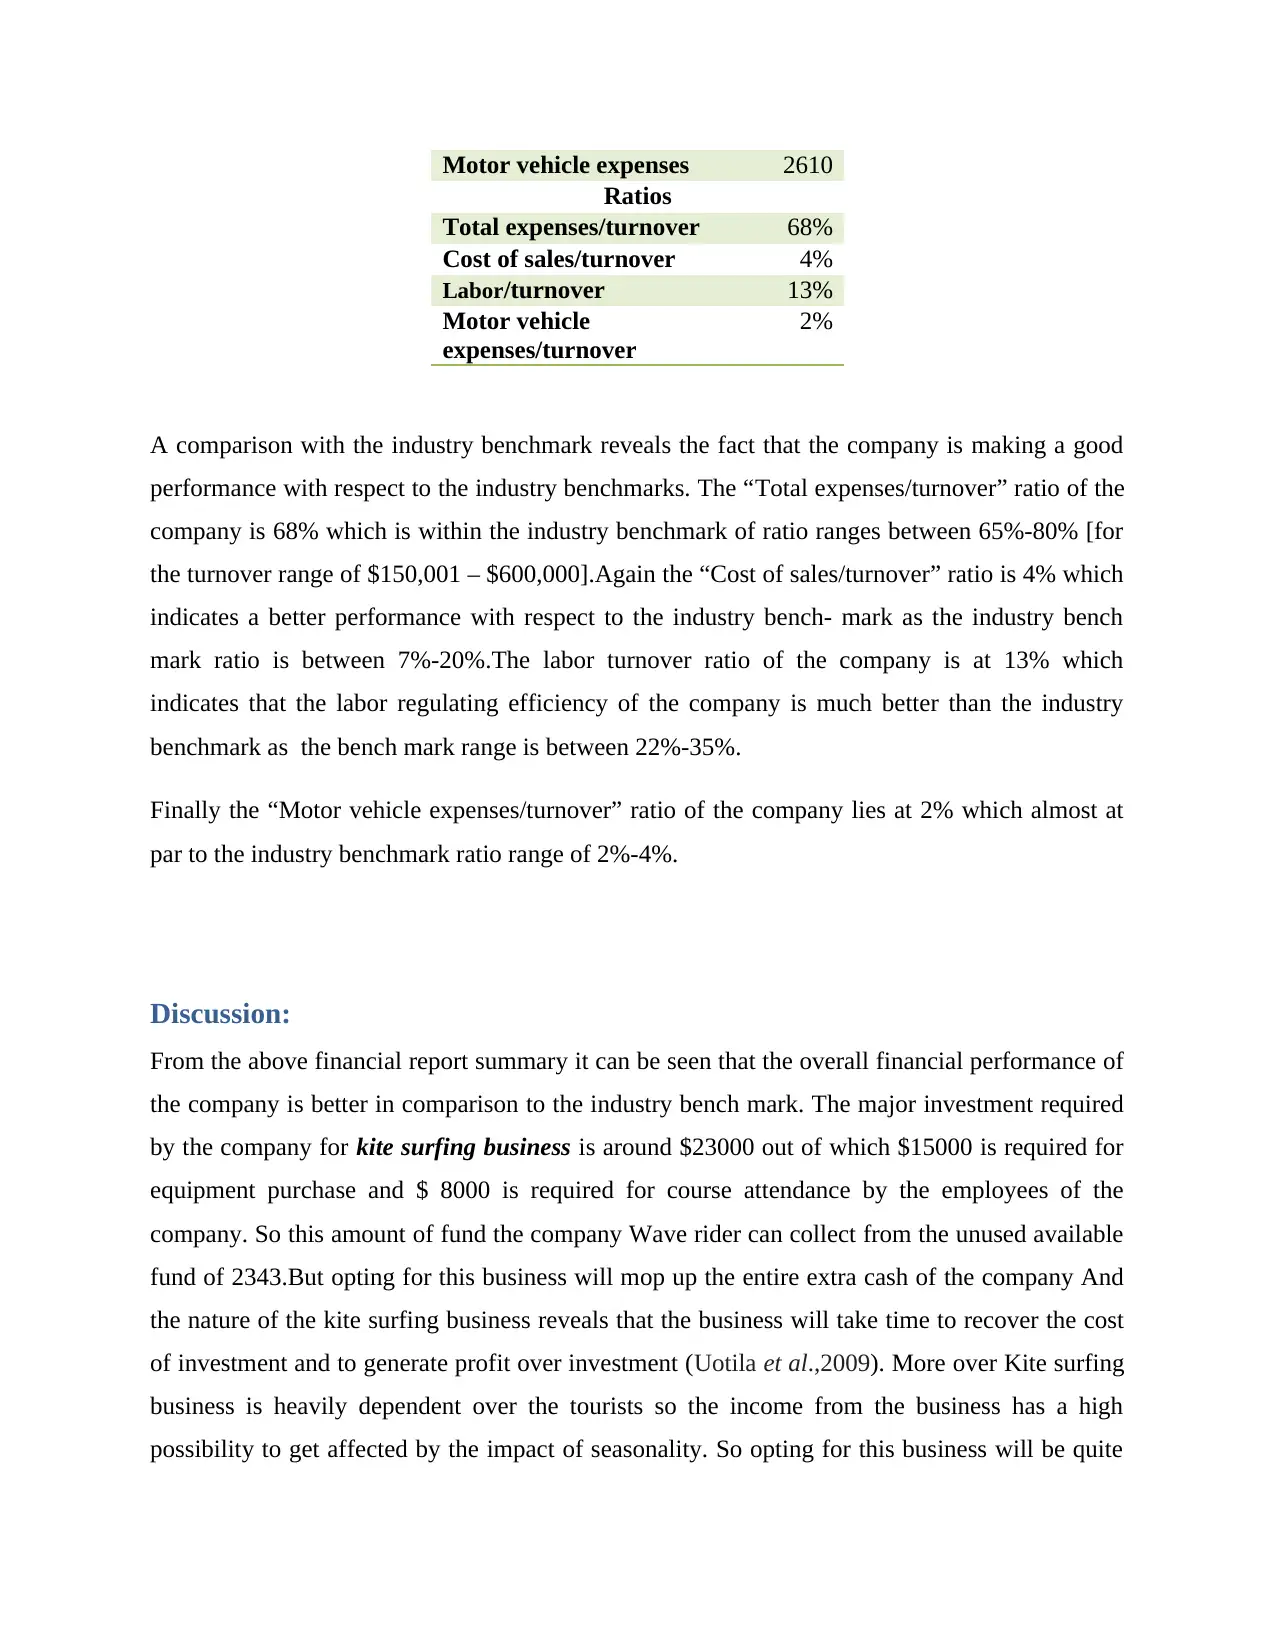
Motor vehicle expenses 2610
Ratios
Total expenses/turnover 68%
Cost of sales/turnover 4%
Labor/turnover 13%
Motor vehicle
expenses/turnover
2%
A comparison with the industry benchmark reveals the fact that the company is making a good
performance with respect to the industry benchmarks. The “Total expenses/turnover” ratio of the
company is 68% which is within the industry benchmark of ratio ranges between 65%-80% [for
the turnover range of $150,001 – $600,000].Again the “Cost of sales/turnover” ratio is 4% which
indicates a better performance with respect to the industry bench- mark as the industry bench
mark ratio is between 7%-20%.The labor turnover ratio of the company is at 13% which
indicates that the labor regulating efficiency of the company is much better than the industry
benchmark as the bench mark range is between 22%-35%.
Finally the “Motor vehicle expenses/turnover” ratio of the company lies at 2% which almost at
par to the industry benchmark ratio range of 2%-4%.
Discussion:
From the above financial report summary it can be seen that the overall financial performance of
the company is better in comparison to the industry bench mark. The major investment required
by the company for kite surfing business is around $23000 out of which $15000 is required for
equipment purchase and $ 8000 is required for course attendance by the employees of the
company. So this amount of fund the company Wave rider can collect from the unused available
fund of 2343.But opting for this business will mop up the entire extra cash of the company And
the nature of the kite surfing business reveals that the business will take time to recover the cost
of investment and to generate profit over investment (Uotila et al.,2009). More over Kite surfing
business is heavily dependent over the tourists so the income from the business has a high
possibility to get affected by the impact of seasonality. So opting for this business will be quite
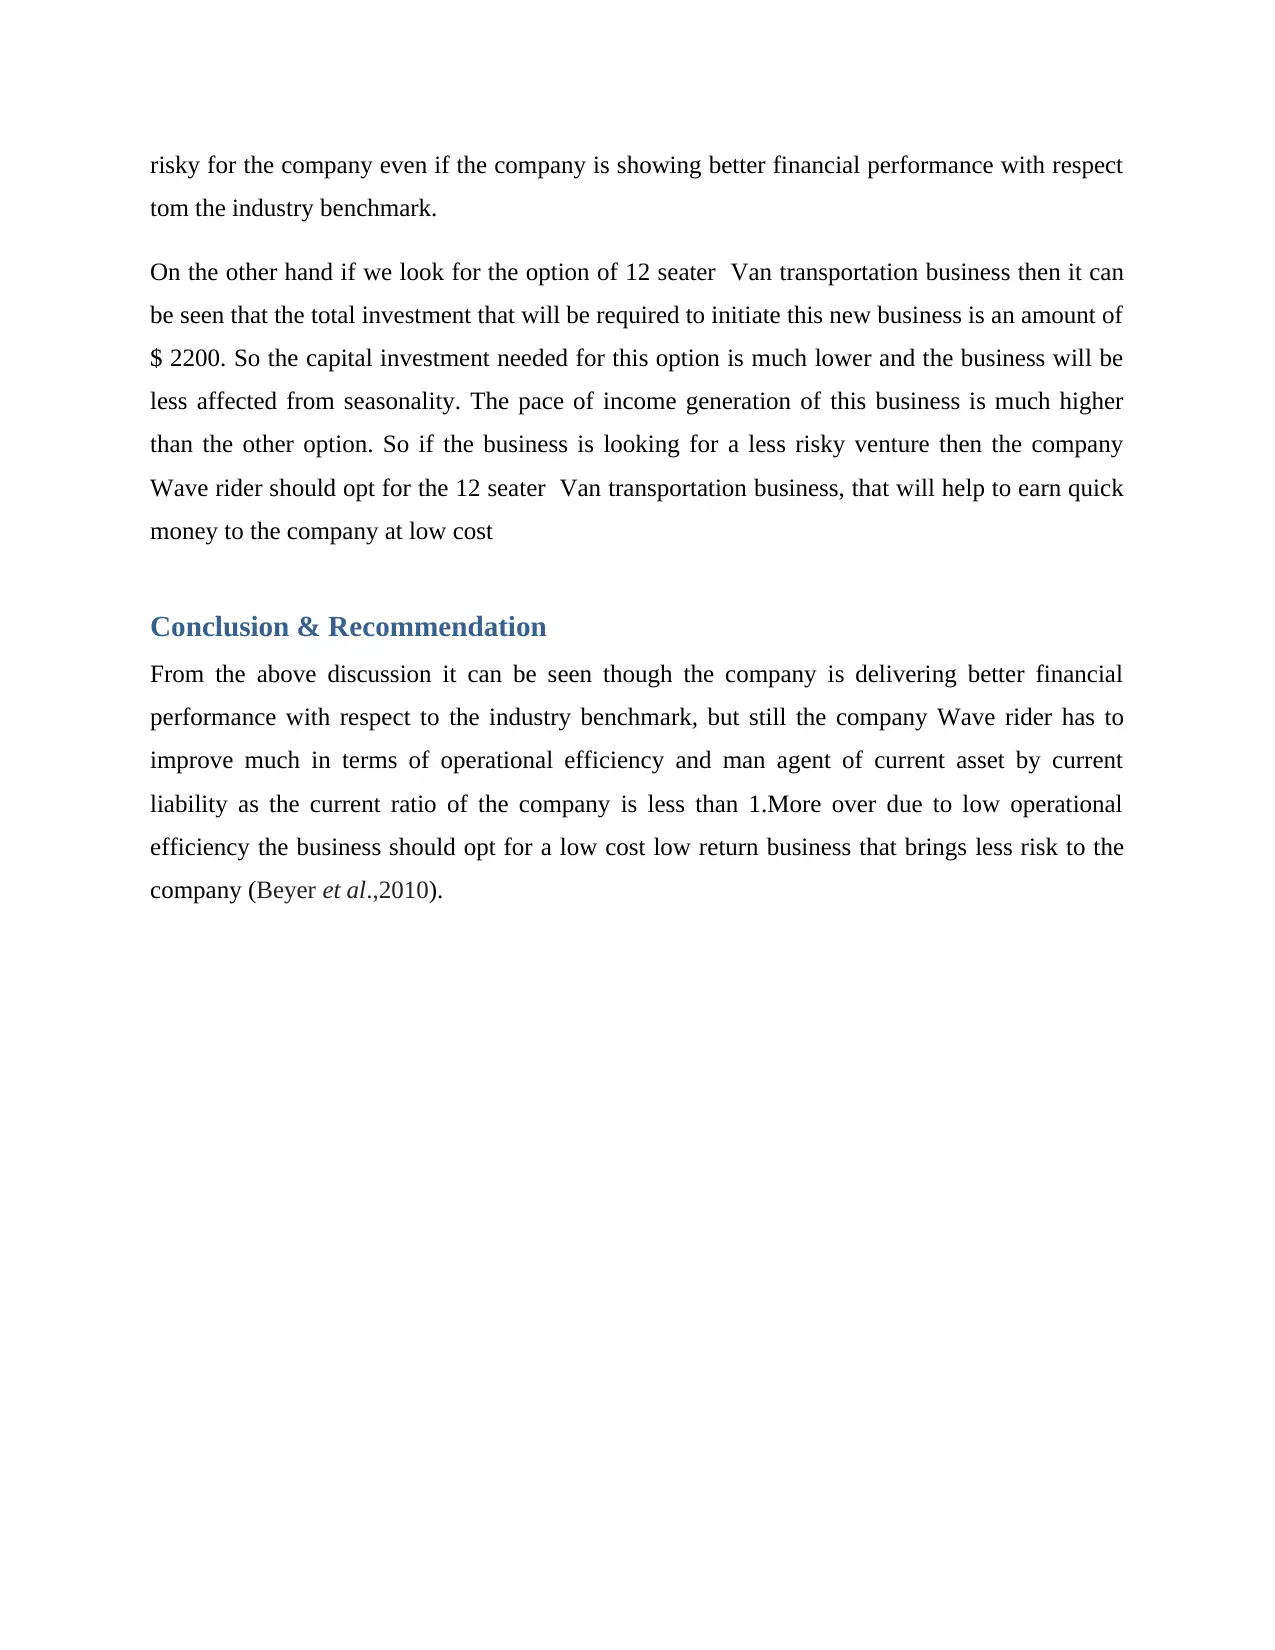
risky for the company even if the company is showing better financial performance with respect
tom the industry benchmark.
On the other hand if we look for the option of 12 seater Van transportation business then it can
be seen that the total investment that will be required to initiate this new business is an amount of
$ 2200. So the capital investment needed for this option is much lower and the business will be
less affected from seasonality. The pace of income generation of this business is much higher
than the other option. So if the business is looking for a less risky venture then the company
Wave rider should opt for the 12 seater Van transportation business, that will help to earn quick
money to the company at low cost
Conclusion & Recommendation
From the above discussion it can be seen though the company is delivering better financial
performance with respect to the industry benchmark, but still the company Wave rider has to
improve much in terms of operational efficiency and man agent of current asset by current
liability as the current ratio of the company is less than 1.More over due to low operational
efficiency the business should opt for a low cost low return business that brings less risk to the
company (Beyer et al.,2010).
Paraphrase This Document
Need a fresh take? Get an instant paraphrase of this document with our AI Paraphraser
Reference:
Beyer, A., Cohen, D. A., Lys, T. Z., & Walther, B. R. (2010). The financial reporting
environment: Review of the recent literature. Journal of accounting and
economics, 50(2), 296-343.
Biddle, G. C., Hilary, G., & Verdi, R. S. (2009). How does financial reporting quality relate to
investment efficiency?. Journal of accounting and economics, 48(2), 112-131.
Higgins, R. C. (2012). Analysis for financial management. McGraw-Hill/Irwin.
Kirklin, J. K., Naftel, D. C., Kormos, R. L., Stevenson, L. W., Pagani, F. D., Miller, M. A., ... &
Young, J. B. (2013). Fifth INTERMACS annual report: risk factor analysis from more
than 6,000 mechanical circulatory support patients. The Journal of heart and lung
transplantation, 32(2), 141-156.
Uotila, J., Maula, M., Keil, T. and Zahra, S.A., 2009. Exploration, exploitation, and financial
performance: analysis of S&P 500 corporations. Strategic Management Journal, 30(2),
pp.221-231.
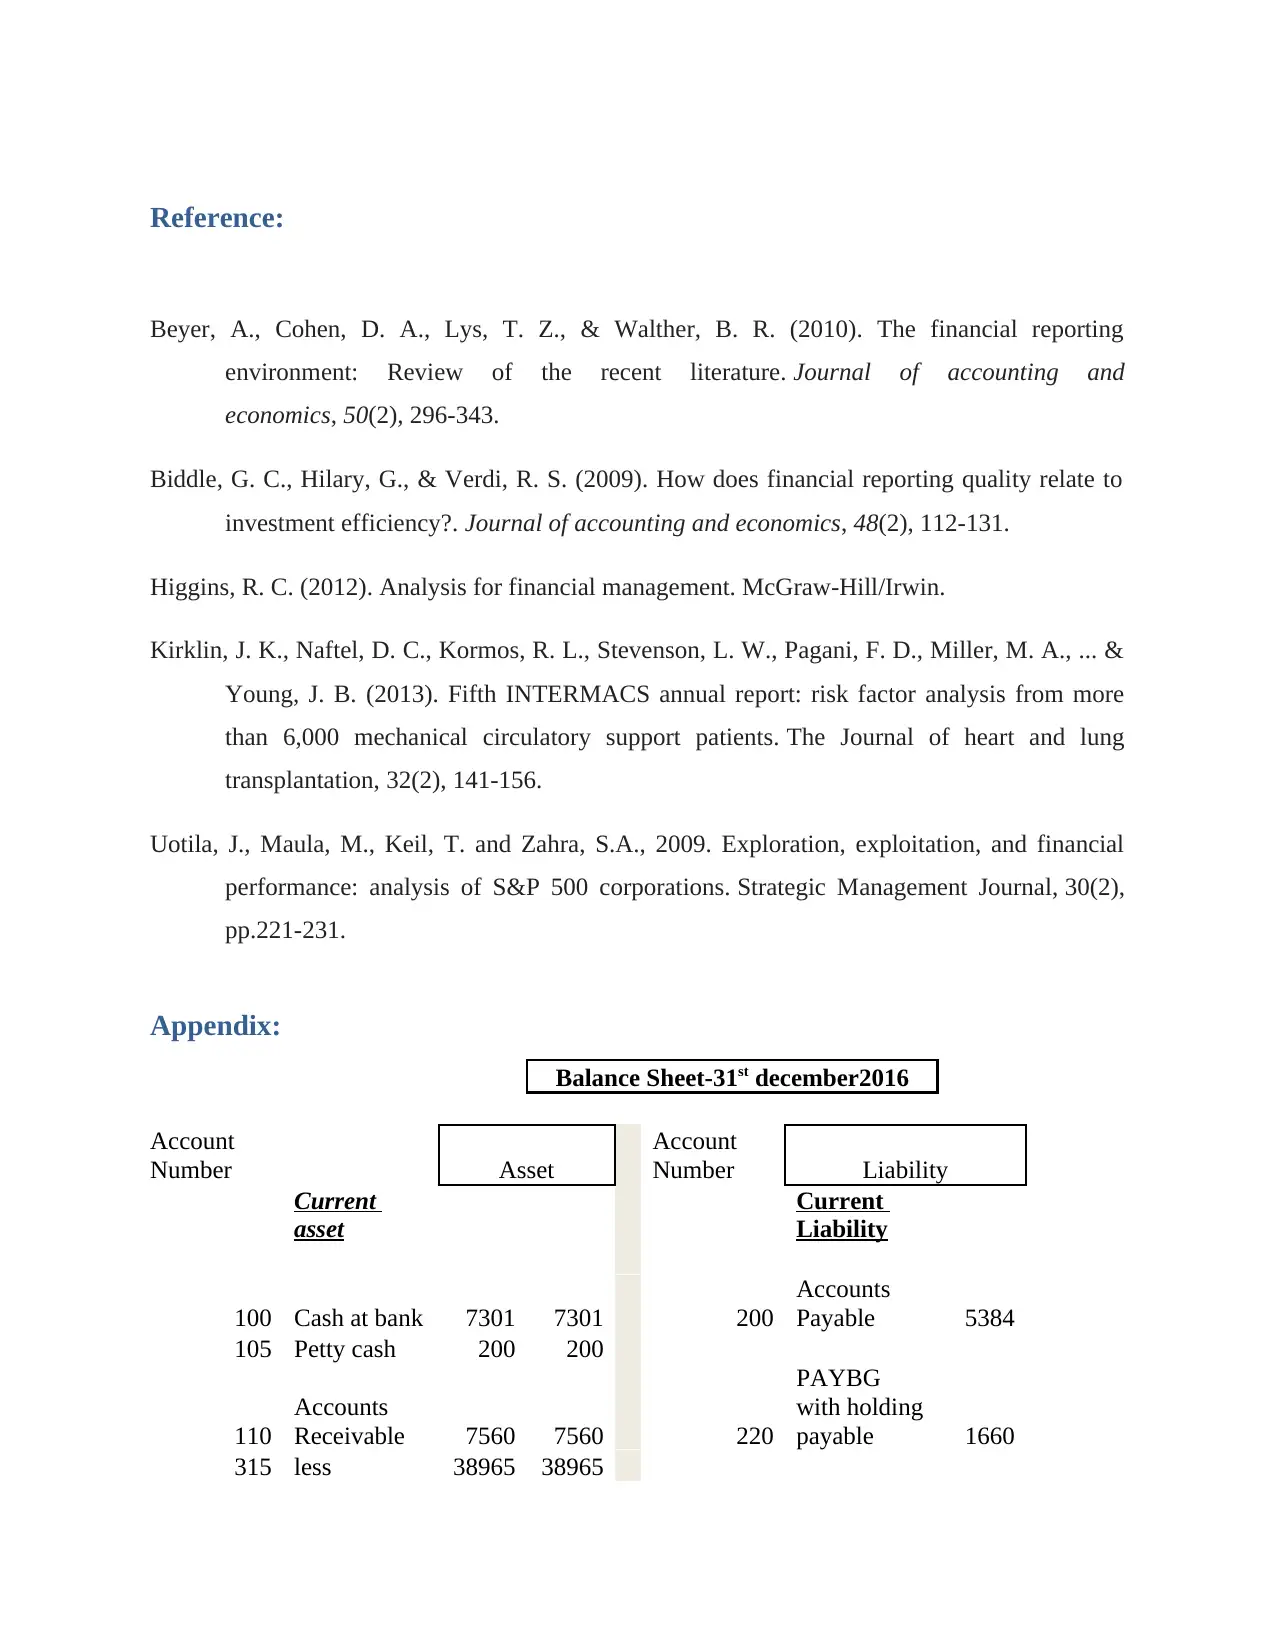
Appendix:
Balance Sheet-31st december2016
Account
Number Asset
Account
Number Liability
Current
asset
Current
Liability
100 Cash at bank 7301 7301 200
Accounts
Payable 5384
105 Petty cash 200 200
110
Accounts
Receivable 7560 7560 220
PAYBG
with holding
payable 1660
315 less 38965 38965
Beyer, A., Cohen, D. A., Lys, T. Z., & Walther, B. R. (2010). The financial reporting
environment: Review of the recent literature. Journal of accounting and
economics, 50(2), 296-343.
Biddle, G. C., Hilary, G., & Verdi, R. S. (2009). How does financial reporting quality relate to
investment efficiency?. Journal of accounting and economics, 48(2), 112-131.
Higgins, R. C. (2012). Analysis for financial management. McGraw-Hill/Irwin.
Kirklin, J. K., Naftel, D. C., Kormos, R. L., Stevenson, L. W., Pagani, F. D., Miller, M. A., ... &
Young, J. B. (2013). Fifth INTERMACS annual report: risk factor analysis from more
than 6,000 mechanical circulatory support patients. The Journal of heart and lung
transplantation, 32(2), 141-156.
Uotila, J., Maula, M., Keil, T. and Zahra, S.A., 2009. Exploration, exploitation, and financial
performance: analysis of S&P 500 corporations. Strategic Management Journal, 30(2),
pp.221-231.
Appendix:
Balance Sheet-31st december2016
Account
Number Asset
Account
Number Liability
Current
asset
Current
Liability
100 Cash at bank 7301 7301 200
Accounts
Payable 5384
105 Petty cash 200 200
110
Accounts
Receivable 7560 7560 220
PAYBG
with holding
payable 1660
315 less 38965 38965
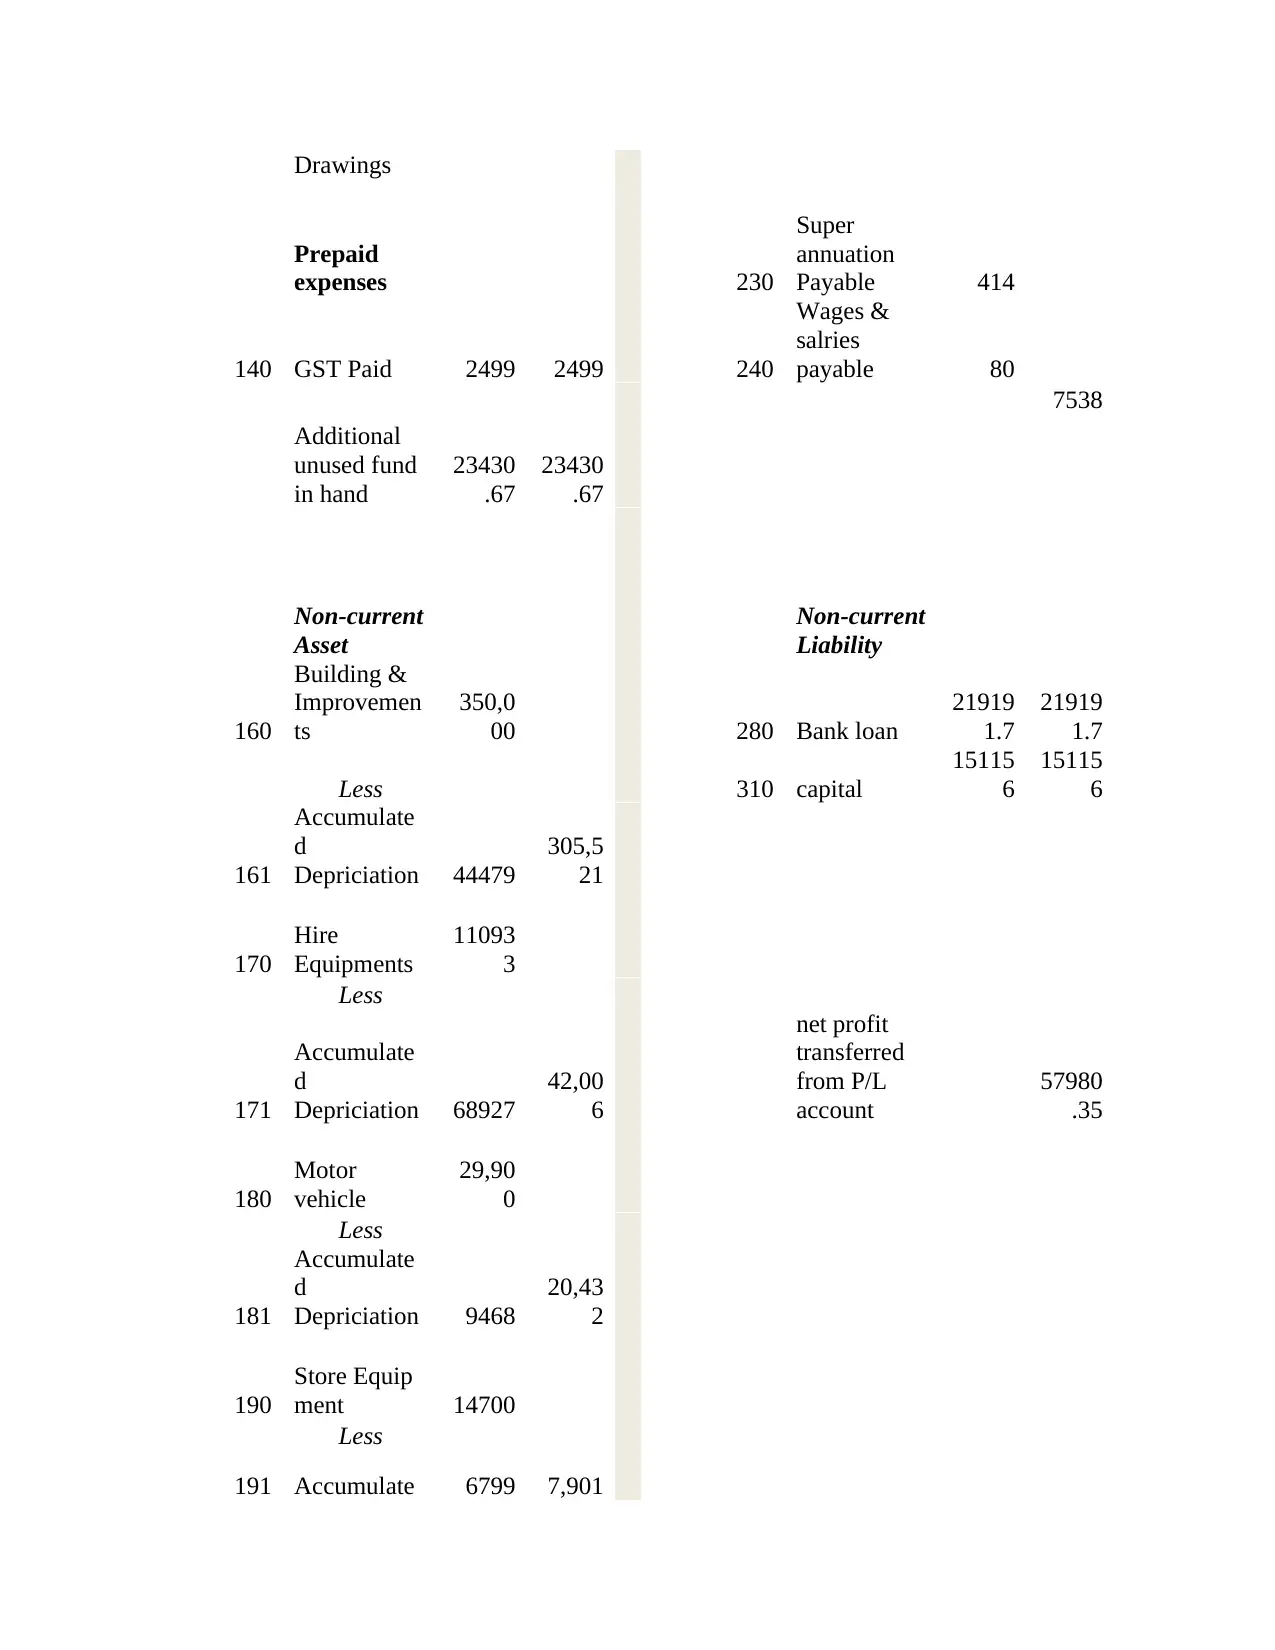
Drawings
Prepaid
expenses 230
Super
annuation
Payable 414
140 GST Paid 2499 2499 240
Wages &
salries
payable 80
7538
Additional
unused fund
in hand
23430
.67
23430
.67
Non-current
Asset
Non-current
Liability
160
Building &
Improvemen
ts
350,0
00 280 Bank loan
21919
1.7
21919
1.7
Less 310 capital
15115
6
15115
6
161
Accumulate
d
Depriciation 44479
305,5
21
170
Hire
Equipments
11093
3
Less
171
Accumulate
d
Depriciation 68927
42,00
6
net profit
transferred
from P/L
account
57980
.35
180
Motor
vehicle
29,90
0
Less
181
Accumulate
d
Depriciation 9468
20,43
2
190
Store Equip
ment 14700
Less
191 Accumulate 6799 7,901
d
Depriciation
Total
435,8
66
43586
6
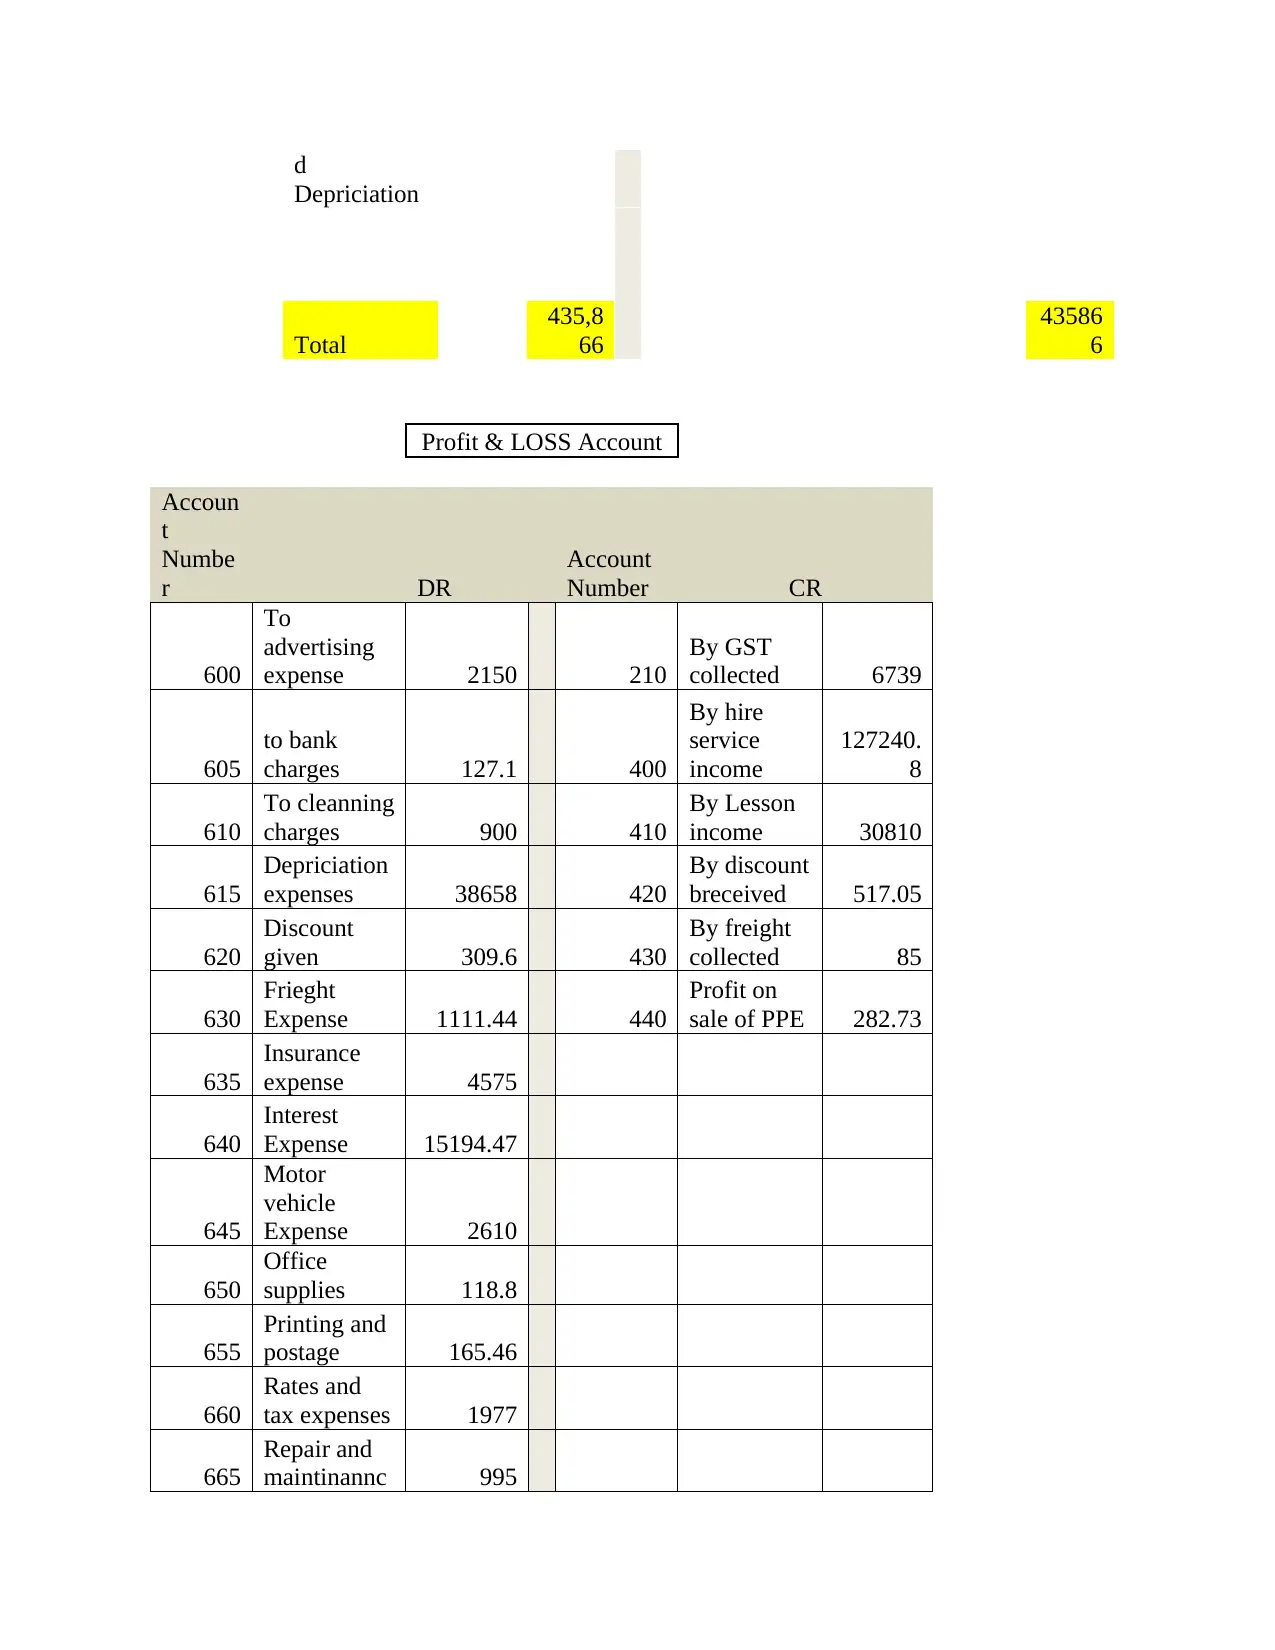
Profit & LOSS Account
Accoun
t
Numbe
r DR
Account
Number CR
600
To
advertising
expense 2150 210
By GST
collected 6739
605
to bank
charges 127.1 400
By hire
service
income
127240.
8
610
To cleanning
charges 900 410
By Lesson
income 30810
615
Depriciation
expenses 38658 420
By discount
breceived 517.05
620
Discount
given 309.6 430
By freight
collected 85
630
Frieght
Expense 1111.44 440
Profit on
sale of PPE 282.73
635
Insurance
expense 4575
640
Interest
Expense 15194.47
645
Motor
vehicle
Expense 2610
650
Office
supplies 118.8
655
Printing and
postage 165.46
660
Rates and
tax expenses 1977
665
Repair and
maintinannc 995
Depriciation
Total
435,8
66
43586
6
Profit & LOSS Account
Accoun
t
Numbe
r DR
Account
Number CR
600
To
advertising
expense 2150 210
By GST
collected 6739
605
to bank
charges 127.1 400
By hire
service
income
127240.
8
610
To cleanning
charges 900 410
By Lesson
income 30810
615
Depriciation
expenses 38658 420
By discount
breceived 517.05
620
Discount
given 309.6 430
By freight
collected 85
630
Frieght
Expense 1111.44 440
Profit on
sale of PPE 282.73
635
Insurance
expense 4575
640
Interest
Expense 15194.47
645
Motor
vehicle
Expense 2610
650
Office
supplies 118.8
655
Printing and
postage 165.46
660
Rates and
tax expenses 1977
665
Repair and
maintinannc 995
Secure Best Marks with AI Grader
Need help grading? Try our AI Grader for instant feedback on your assignments.
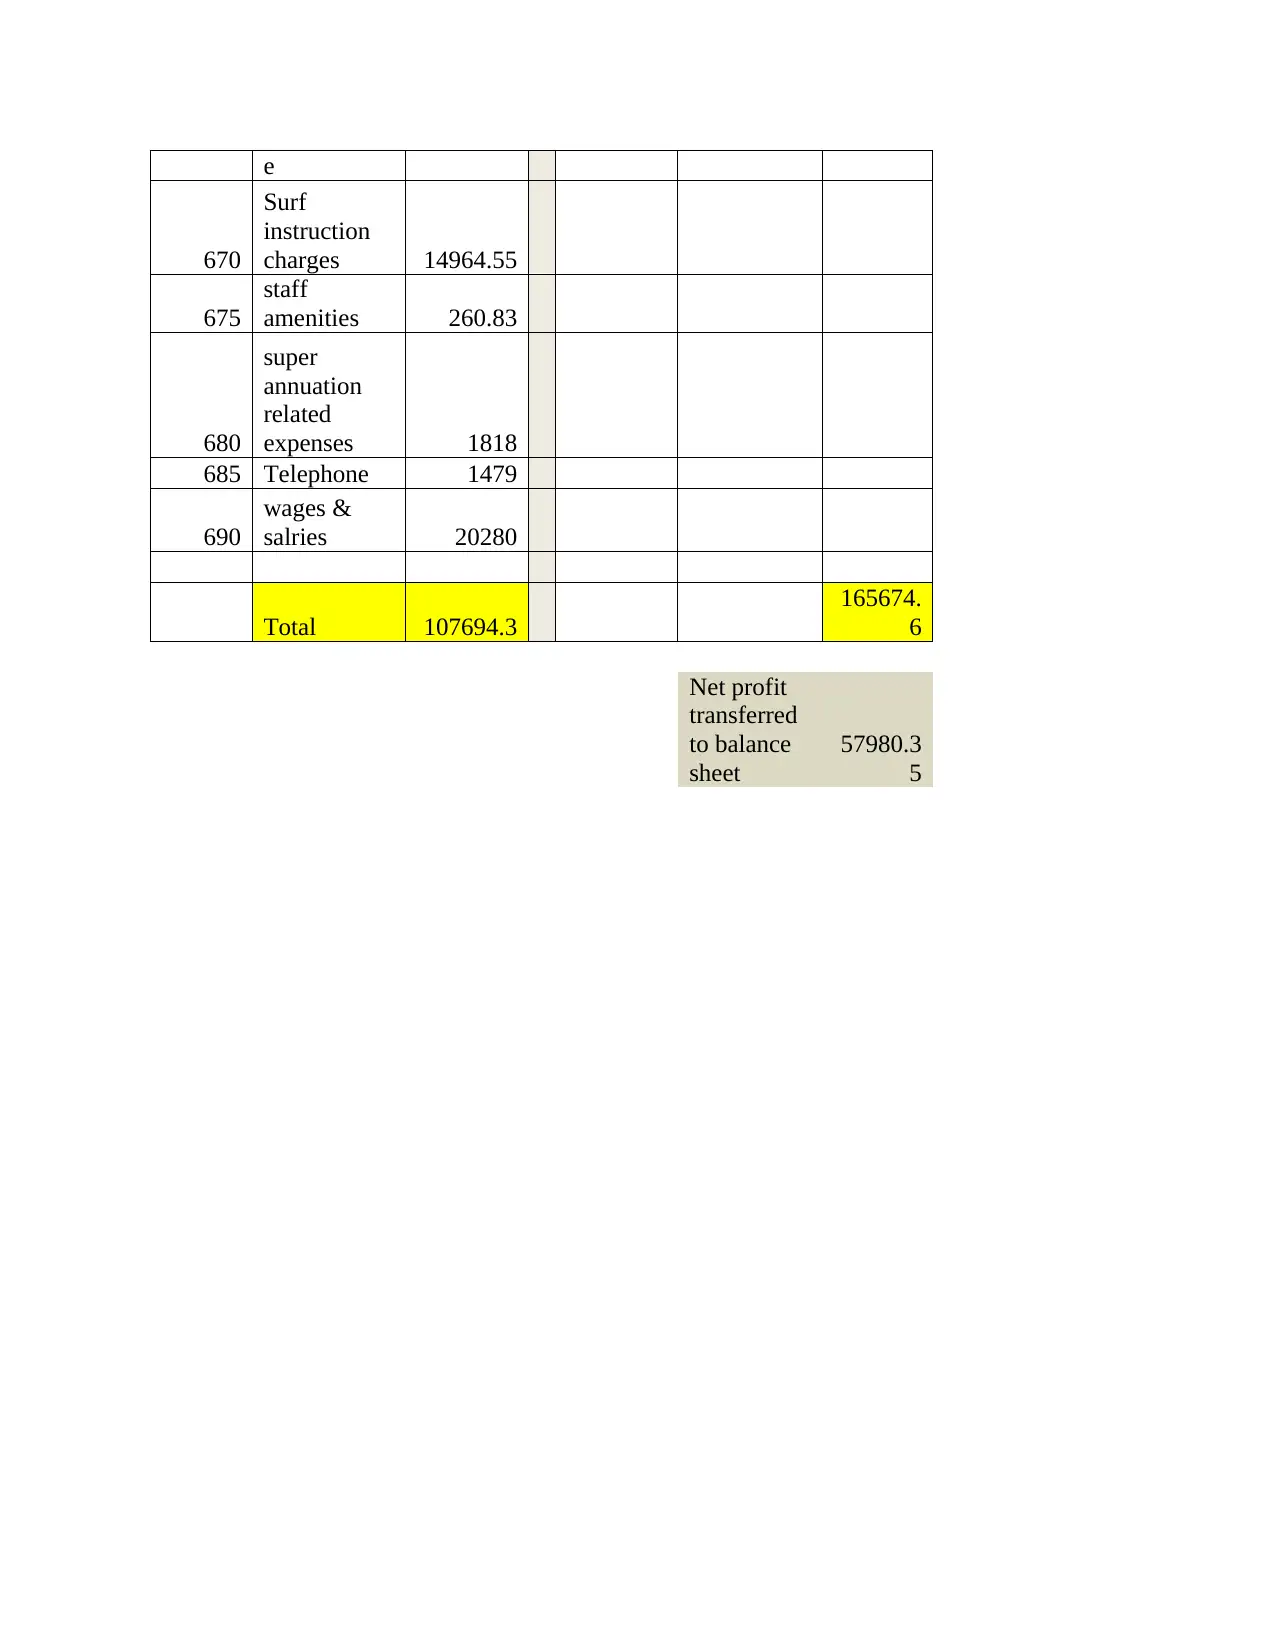
e
670
Surf
instruction
charges 14964.55
675
staff
amenities 260.83
680
super
annuation
related
expenses 1818
685 Telephone 1479
690
wages &
salries 20280
Total 107694.3
165674.
6
Net profit
transferred
to balance
sheet
57980.3
5
670
Surf
instruction
charges 14964.55
675
staff
amenities 260.83
680
super
annuation
related
expenses 1818
685 Telephone 1479
690
wages &
salries 20280
Total 107694.3
165674.
6
Net profit
transferred
to balance
sheet
57980.3
5
1 out of 11
Related Documents


Your All-in-One AI-Powered Toolkit for Academic Success.
+13062052269
info@desklib.com
Available 24*7 on WhatsApp / Email
![[object Object]](/_next/static/media/star-bottom.7253800d.svg)
Unlock your academic potential
© 2024 | Zucol Services PVT LTD | All rights reserved.