PS7002 Retake: Statistical Analysis of Anxiety Treatment & Cognition
VerifiedAdded on 2023/06/10
|17
|4217
|374
Homework Assignment
AI Summary
This document provides a detailed solution to a PS7002 retake test, focusing on the statistical analysis of anxiety treatment effectiveness and cognitive performance. The solution covers planned comparisons and post-hoc tests to evaluate different treatment sessions for anxiety, including descriptive and inferential statistics reported in APA style. It also examines the impact of a new drug on cognitive performance, considering factors like dosage and food intake, utilizing repeated measures ANOVA. The analysis identifies significant main effects and interaction effects, offering insights into the optimal conditions for treatment and drug effectiveness. The document concludes with an investigation into stereotype threat and its impact on mental arithmetic task performance.
PS7002 retake test (2018)
PS7002 Take home retake test
June 2018
Name KU Number
There are 4 questions, each worth 25 marks. Please try to answer all of the questions. Have a
look through the test and make sure you know how many questions there are and what areas
they cover. Please type your answer and save the Word document with your KU ID in the title;
submit this document on Canvas. APA style should be used throughout for reporting descriptive
and inferential statistics. If you have any questions, don’t hesitate to ask.
1
Paraphrase This Document
Need a fresh take? Get an instant paraphrase of this document with our AI Paraphraser
PS7002 retake test (2018)
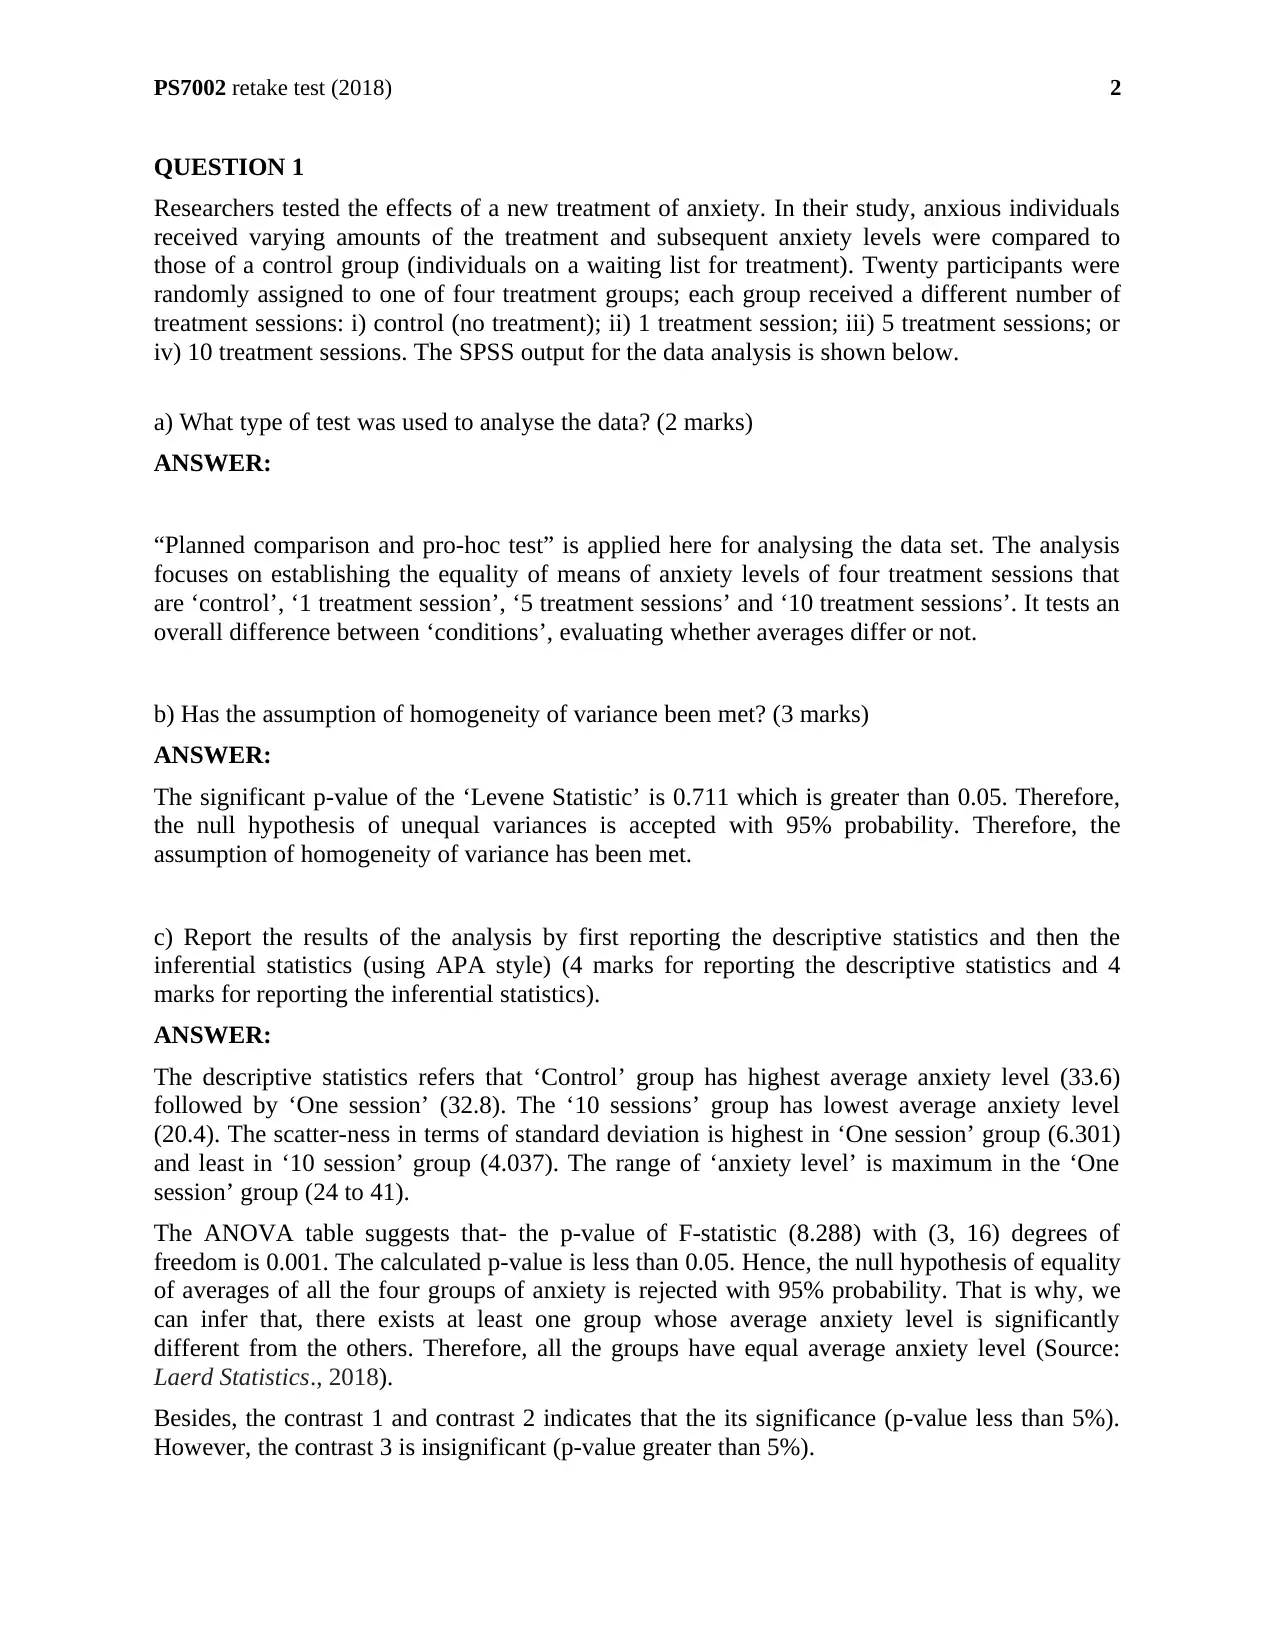
QUESTION 1
Researchers tested the effects of a new treatment of anxiety. In their study, anxious individuals
received varying amounts of the treatment and subsequent anxiety levels were compared to
those of a control group (individuals on a waiting list for treatment). Twenty participants were
randomly assigned to one of four treatment groups; each group received a different number of
treatment sessions: i) control (no treatment); ii) 1 treatment session; iii) 5 treatment sessions; or
iv) 10 treatment sessions. The SPSS output for the data analysis is shown below.
a) What type of test was used to analyse the data? (2 marks)
ANSWER:
“Planned comparison and pro-hoc test” is applied here for analysing the data set. The analysis
focuses on establishing the equality of means of anxiety levels of four treatment sessions that
are ‘control’, ‘1 treatment session’, ‘5 treatment sessions’ and ‘10 treatment sessions’. It tests an
overall difference between ‘conditions’, evaluating whether averages differ or not.
b) Has the assumption of homogeneity of variance been met? (3 marks)
ANSWER:
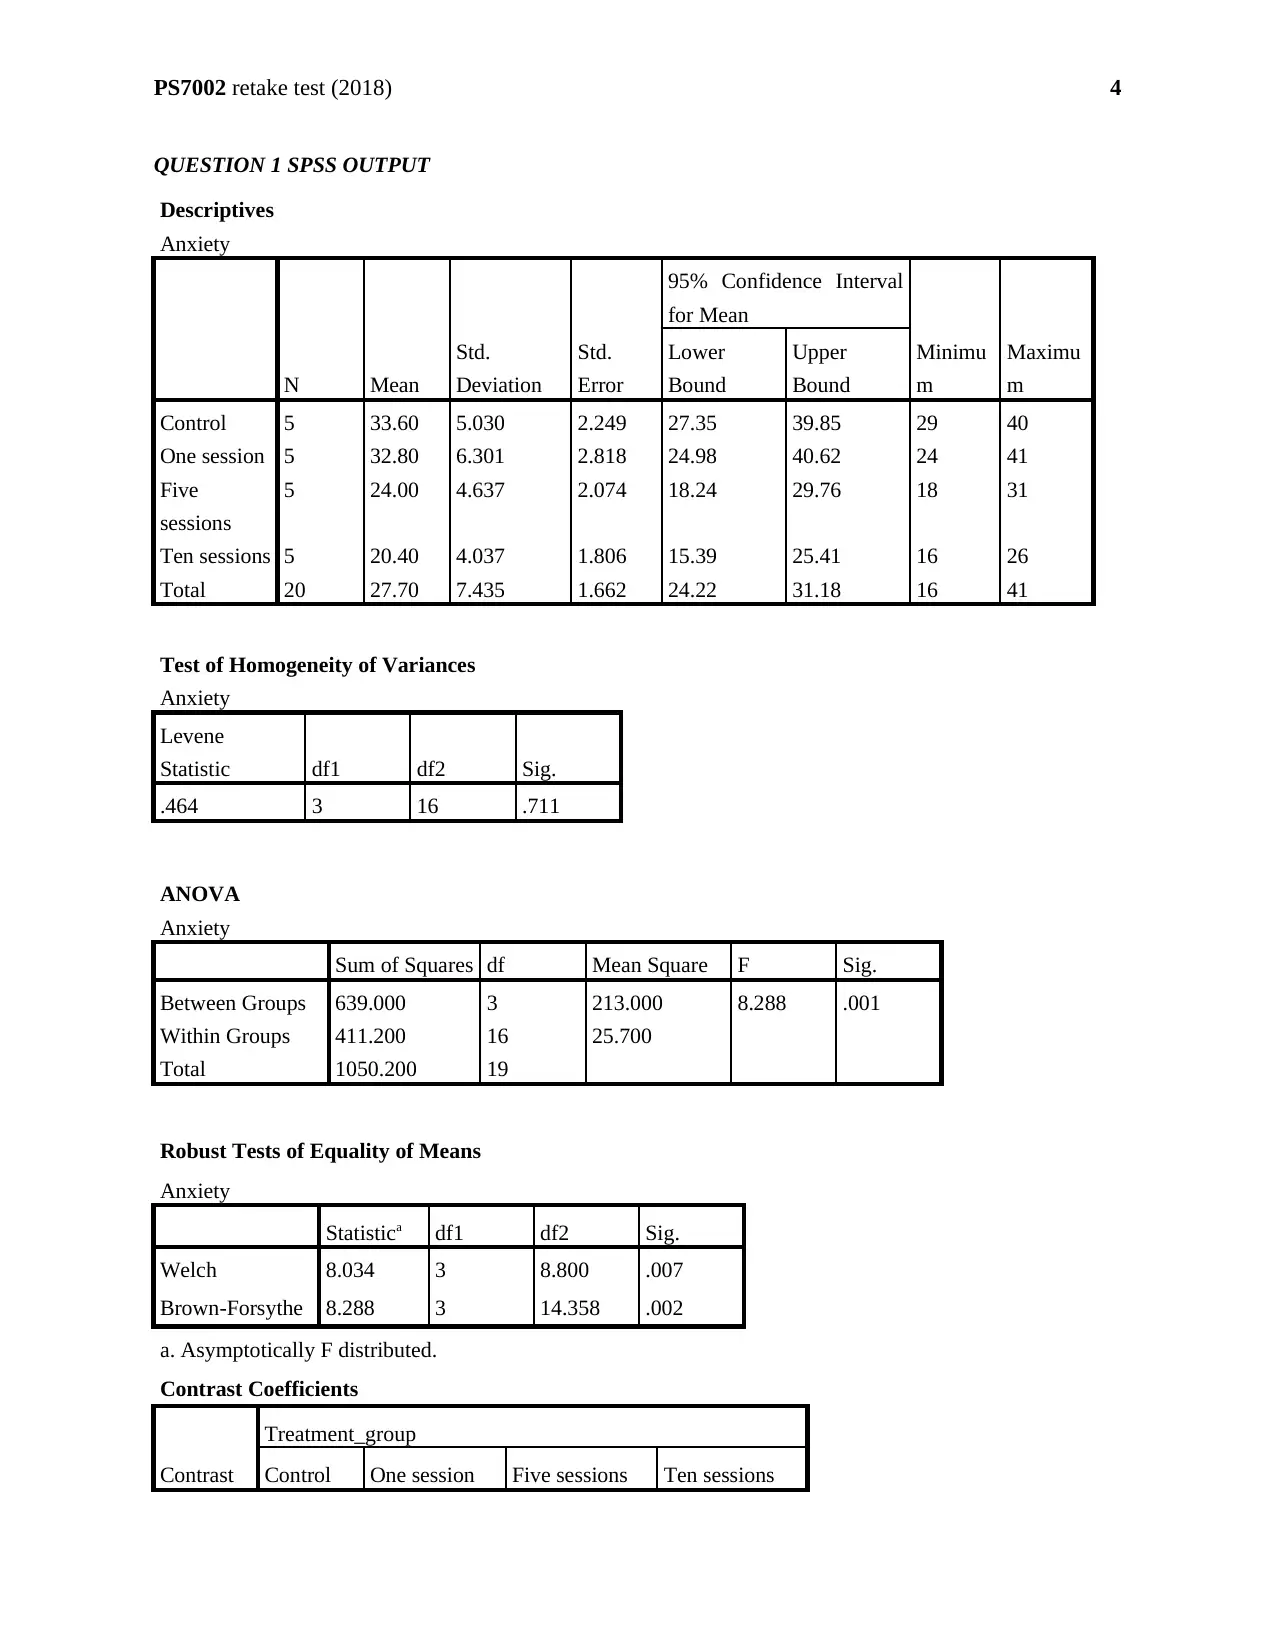
The significant p-value of the ‘Levene Statistic’ is 0.711 which is greater than 0.05. Therefore,
the null hypothesis of unequal variances is accepted with 95% probability. Therefore, the
assumption of homogeneity of variance has been met.
c) Report the results of the analysis by first reporting the descriptive statistics and then the
inferential statistics (using APA style) (4 marks for reporting the descriptive statistics and 4
marks for reporting the inferential statistics).
ANSWER:
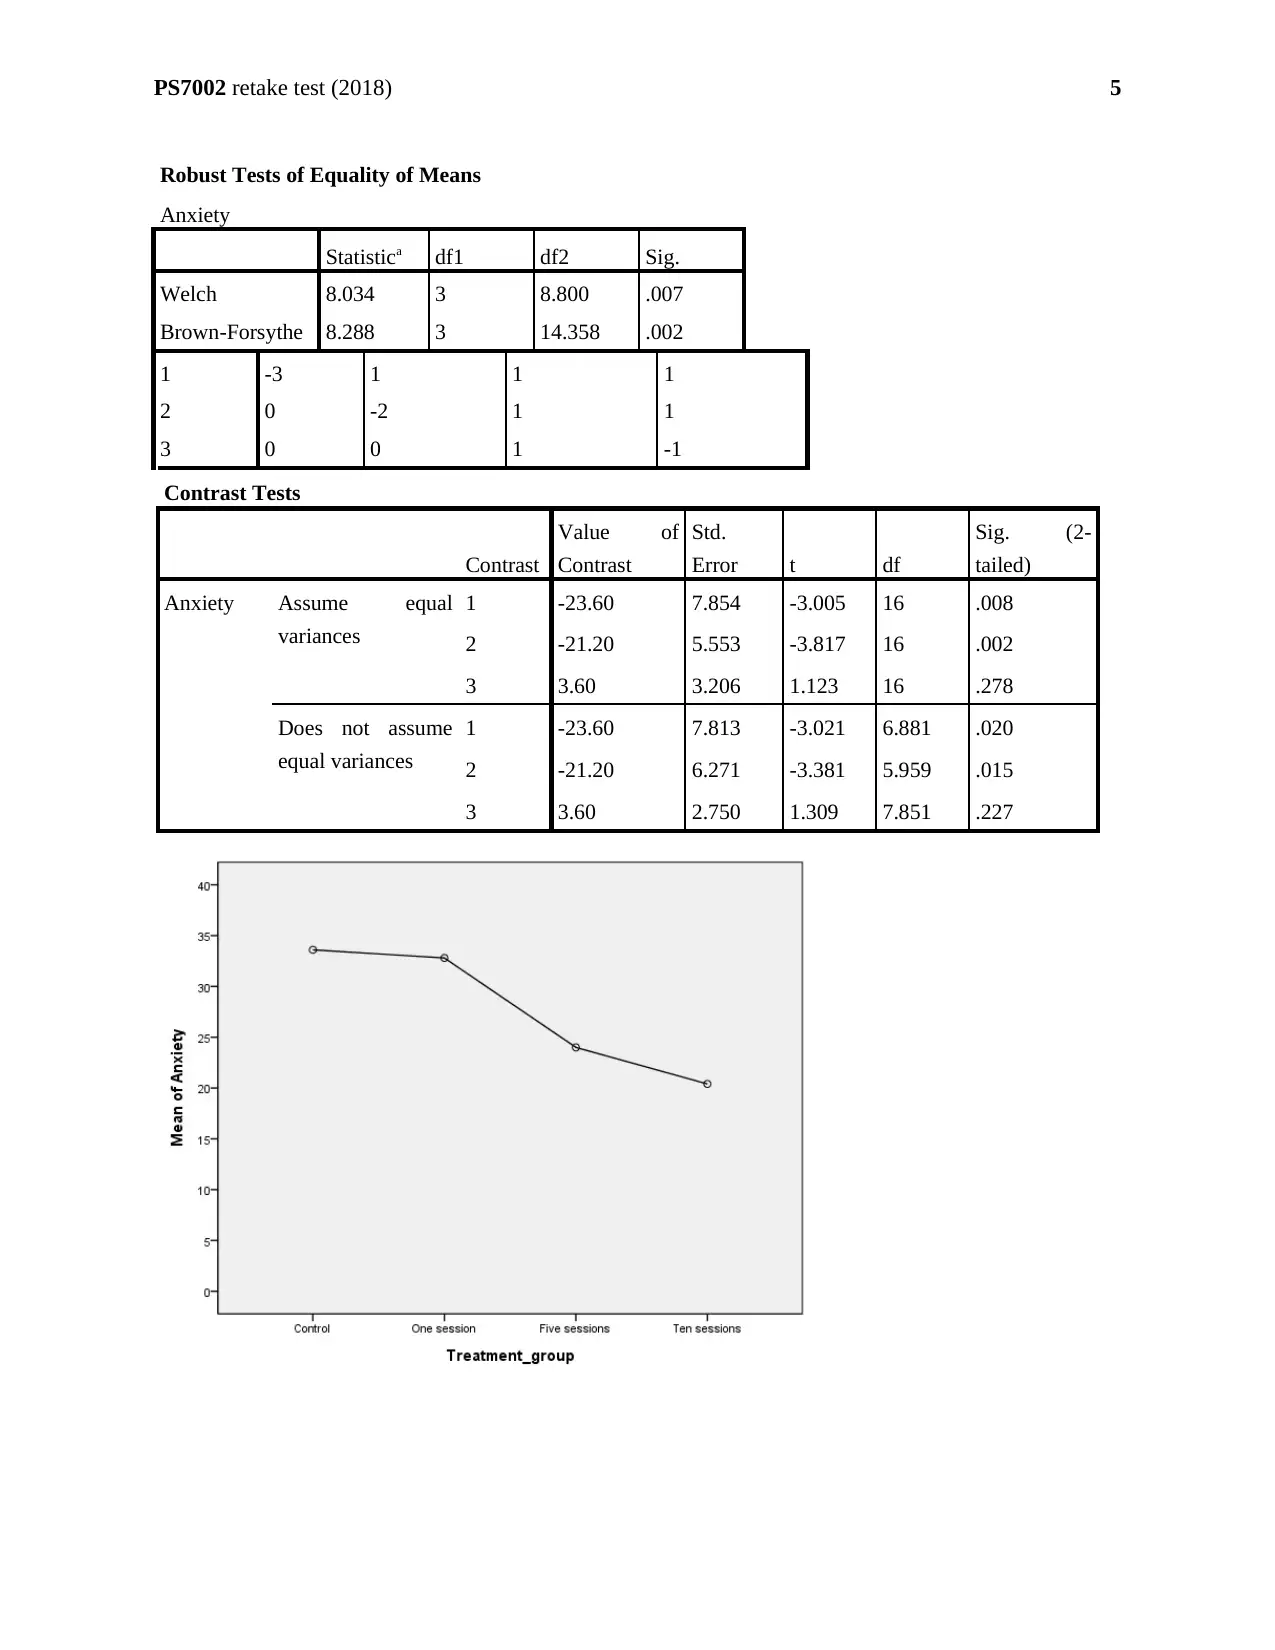
The descriptive statistics refers that ‘Control’ group has highest average anxiety level (33.6)
followed by ‘One session’ (32.8). The ‘10 sessions’ group has lowest average anxiety level
(20.4). The scatter-ness in terms of standard deviation is highest in ‘One session’ group (6.301)
and least in ‘10 session’ group (4.037). The range of ‘anxiety level’ is maximum in the ‘One
session’ group (24 to 41).
The ANOVA table suggests that- the p-value of F-statistic (8.288) with (3, 16) degrees of
freedom is 0.001. The calculated p-value is less than 0.05. Hence, the null hypothesis of equality
of averages of all the four groups of anxiety is rejected with 95% probability. That is why, we
can infer that, there exists at least one group whose average anxiety level is significantly
different from the others. Therefore, all the groups have equal average anxiety level (Source:
Laerd Statistics., 2018).
Besides, the contrast 1 and contrast 2 indicates that the its significance (p-value less than 5%).
However, the contrast 3 is insignificant (p-value greater than 5%).
2
QUESTION 1
Researchers tested the effects of a new treatment of anxiety. In their study, anxious individuals
received varying amounts of the treatment and subsequent anxiety levels were compared to
those of a control group (individuals on a waiting list for treatment). Twenty participants were
randomly assigned to one of four treatment groups; each group received a different number of
treatment sessions: i) control (no treatment); ii) 1 treatment session; iii) 5 treatment sessions; or
iv) 10 treatment sessions. The SPSS output for the data analysis is shown below.
a) What type of test was used to analyse the data? (2 marks)
ANSWER:
“Planned comparison and pro-hoc test” is applied here for analysing the data set. The analysis
focuses on establishing the equality of means of anxiety levels of four treatment sessions that
are ‘control’, ‘1 treatment session’, ‘5 treatment sessions’ and ‘10 treatment sessions’. It tests an
overall difference between ‘conditions’, evaluating whether averages differ or not.
b) Has the assumption of homogeneity of variance been met? (3 marks)
ANSWER:
The significant p-value of the ‘Levene Statistic’ is 0.711 which is greater than 0.05. Therefore,
the null hypothesis of unequal variances is accepted with 95% probability. Therefore, the
assumption of homogeneity of variance has been met.
c) Report the results of the analysis by first reporting the descriptive statistics and then the
inferential statistics (using APA style) (4 marks for reporting the descriptive statistics and 4
marks for reporting the inferential statistics).
ANSWER:
The descriptive statistics refers that ‘Control’ group has highest average anxiety level (33.6)
followed by ‘One session’ (32.8). The ‘10 sessions’ group has lowest average anxiety level
(20.4). The scatter-ness in terms of standard deviation is highest in ‘One session’ group (6.301)
and least in ‘10 session’ group (4.037). The range of ‘anxiety level’ is maximum in the ‘One
session’ group (24 to 41).
The ANOVA table suggests that- the p-value of F-statistic (8.288) with (3, 16) degrees of
freedom is 0.001. The calculated p-value is less than 0.05. Hence, the null hypothesis of equality
of averages of all the four groups of anxiety is rejected with 95% probability. That is why, we
can infer that, there exists at least one group whose average anxiety level is significantly
different from the others. Therefore, all the groups have equal average anxiety level (Source:
Laerd Statistics., 2018).
Besides, the contrast 1 and contrast 2 indicates that the its significance (p-value less than 5%).
However, the contrast 3 is insignificant (p-value greater than 5%).
2
PS7002 retake test (2018)
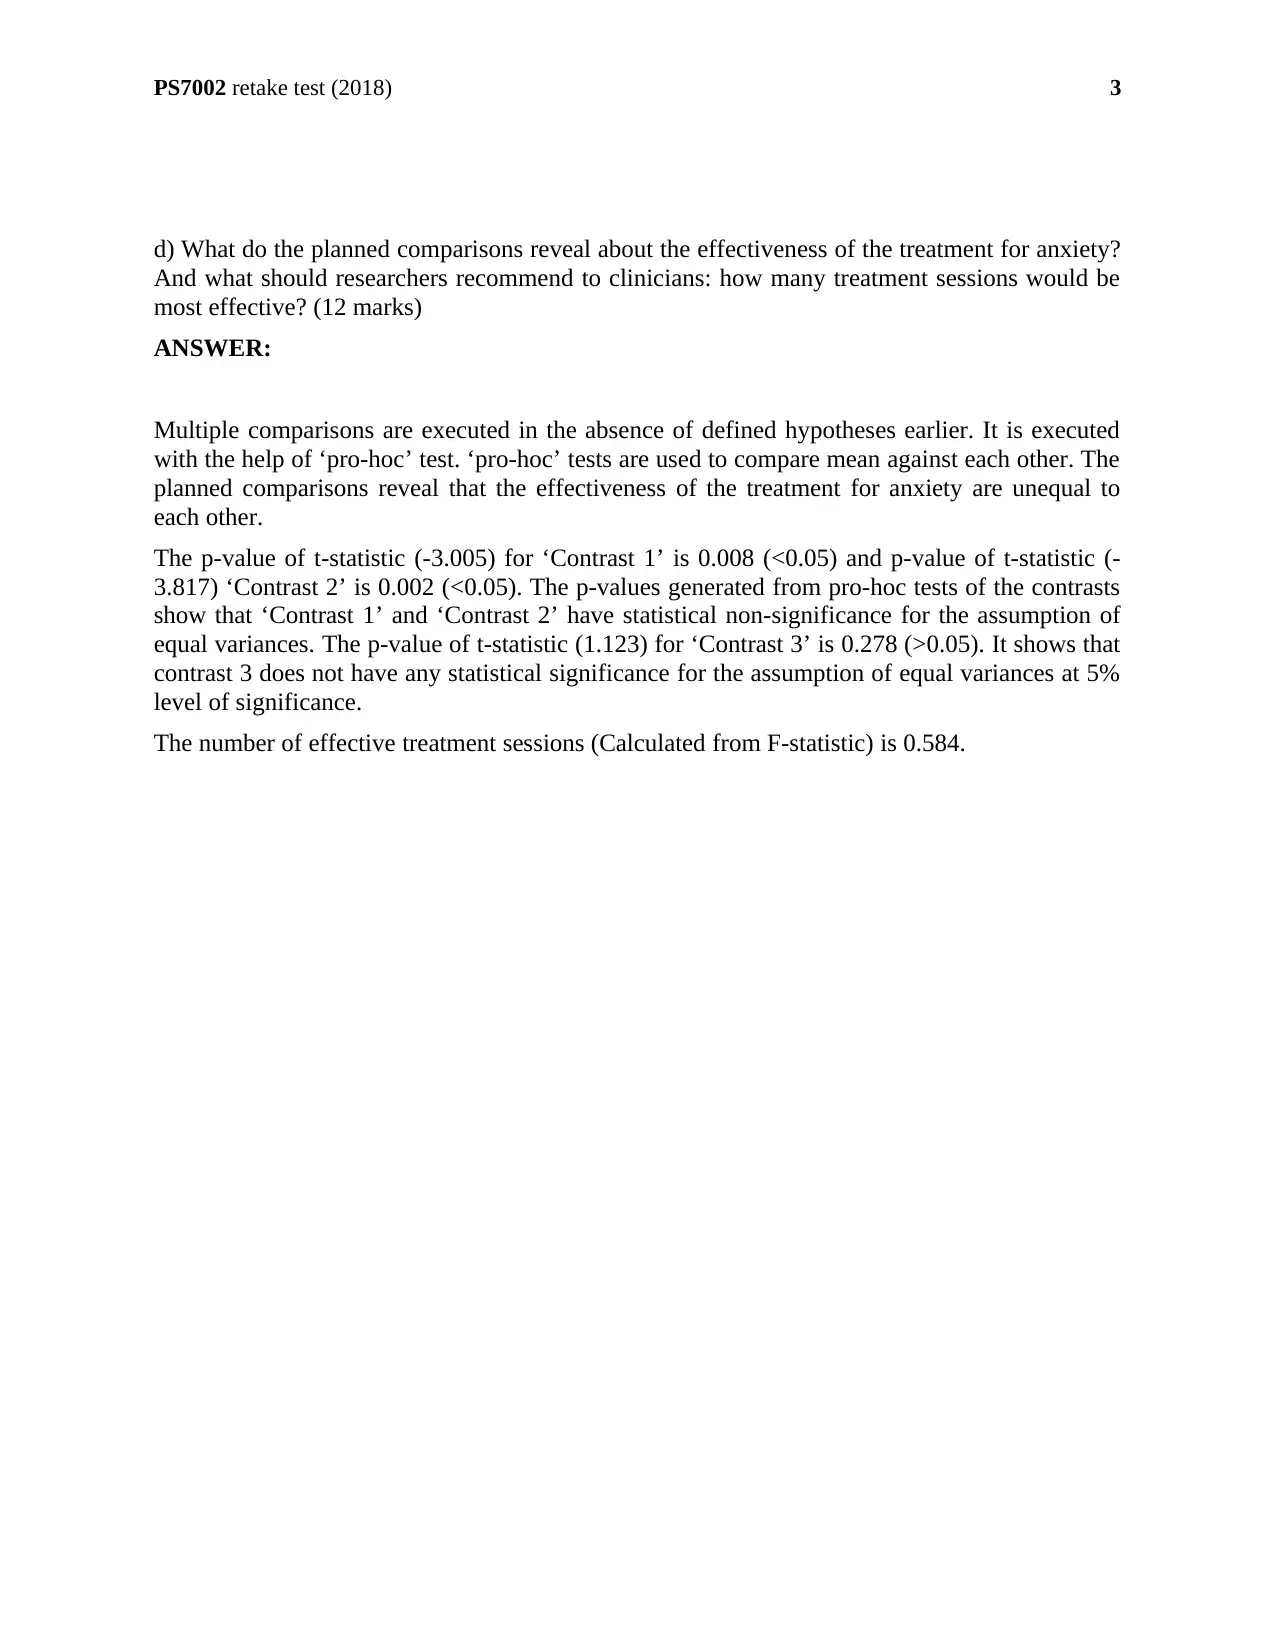
d) What do the planned comparisons reveal about the effectiveness of the treatment for anxiety?
And what should researchers recommend to clinicians: how many treatment sessions would be
most effective? (12 marks)
ANSWER:
Multiple comparisons are executed in the absence of defined hypotheses earlier. It is executed
with the help of ‘pro-hoc’ test. ‘pro-hoc’ tests are used to compare mean against each other. The
planned comparisons reveal that the effectiveness of the treatment for anxiety are unequal to
each other.
The p-value of t-statistic (-3.005) for ‘Contrast 1’ is 0.008 (<0.05) and p-value of t-statistic (-
3.817) ‘Contrast 2’ is 0.002 (<0.05). The p-values generated from pro-hoc tests of the contrasts
show that ‘Contrast 1’ and ‘Contrast 2’ have statistical non-significance for the assumption of
equal variances. The p-value of t-statistic (1.123) for ‘Contrast 3’ is 0.278 (>0.05). It shows that
contrast 3 does not have any statistical significance for the assumption of equal variances at 5%
level of significance.
The number of effective treatment sessions (Calculated from F-statistic) is 0.584.
3
⊘ This is a preview!⊘
Do you want full access?
Subscribe today to unlock all pages.
Trusted by 1+ million students worldwide
PS7002 retake test (2018)
QUESTION 1 SPSS OUTPUT
Descriptives
Anxiety
N Mean
Std.
Deviation
Std.
Error
95% Confidence Interval
for Mean
Minimu
m
Maximu
m
Lower
Bound
Upper
Bound
Control 5 33.60 5.030 2.249 27.35 39.85 29 40
One session 5 32.80 6.301 2.818 24.98 40.62 24 41
Five
sessions
5 24.00 4.637 2.074 18.24 29.76 18 31
Ten sessions 5 20.40 4.037 1.806 15.39 25.41 16 26
Total 20 27.70 7.435 1.662 24.22 31.18 16 41
Test of Homogeneity of Variances
Anxiety
Levene
Statistic df1 df2 Sig.
.464 3 16 .711
ANOVA
Anxiety
Sum of Squares df Mean Square F Sig.
Between Groups 639.000 3 213.000 8.288 .001
Within Groups 411.200 16 25.700
Total 1050.200 19
Robust Tests of Equality of Means
Anxiety
Statistica df1 df2 Sig.
Welch 8.034 3 8.800 .007
Brown-Forsythe 8.288 3 14.358 .002
a. Asymptotically F distributed.
Contrast Coefficients
Contrast
Treatment_group
Control One session Five sessions Ten sessions
4
Paraphrase This Document
Need a fresh take? Get an instant paraphrase of this document with our AI Paraphraser
PS7002 retake test (2018)
Robust Tests of Equality of Means
Anxiety
Statistica df1 df2 Sig.
Welch 8.034 3 8.800 .007
Brown-Forsythe 8.288 3 14.358 .002
1 -3 1 1 1
2 0 -2 1 1
3 0 0 1 -1
Contrast Tests
Contrast
Value of
Contrast
Std.
Error t df
Sig. (2-
tailed)
Anxiety Assume equal
variances
1 -23.60 7.854 -3.005 16 .008
2 -21.20 5.553 -3.817 16 .002
3 3.60 3.206 1.123 16 .278
Does not assume
equal variances
1 -23.60 7.813 -3.021 6.881 .020
2 -21.20 6.271 -3.381 5.959 .015
3 3.60 2.750 1.309 7.851 .227
5
PS7002 retake test (2018)
QUESTION 2
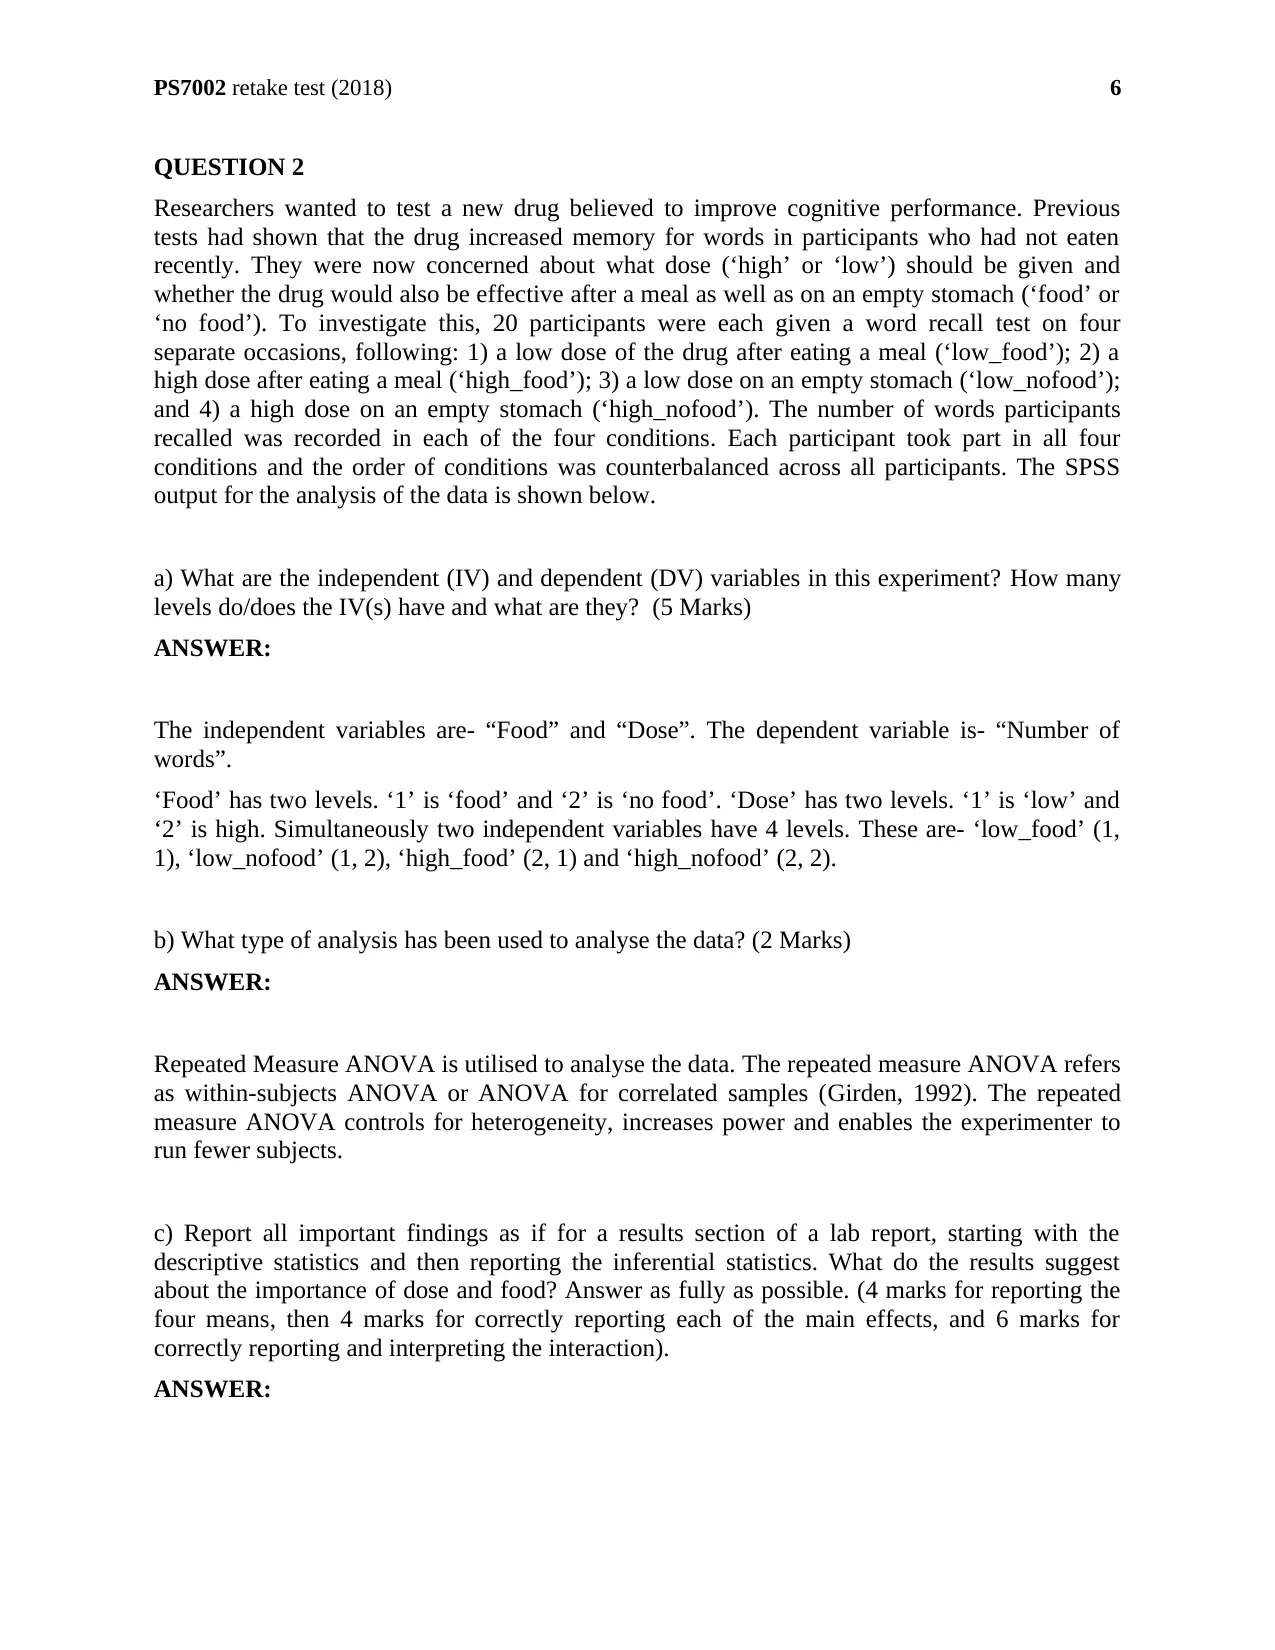
Researchers wanted to test a new drug believed to improve cognitive performance. Previous
tests had shown that the drug increased memory for words in participants who had not eaten
recently. They were now concerned about what dose (‘high’ or ‘low’) should be given and
whether the drug would also be effective after a meal as well as on an empty stomach (‘food’ or
‘no food’). To investigate this, 20 participants were each given a word recall test on four
separate occasions, following: 1) a low dose of the drug after eating a meal (‘low_food’); 2) a
high dose after eating a meal (‘high_food’); 3) a low dose on an empty stomach (‘low_nofood’);
and 4) a high dose on an empty stomach (‘high_nofood’). The number of words participants
recalled was recorded in each of the four conditions. Each participant took part in all four
conditions and the order of conditions was counterbalanced across all participants. The SPSS
output for the analysis of the data is shown below.
a) What are the independent (IV) and dependent (DV) variables in this experiment? How many
levels do/does the IV(s) have and what are they? (5 Marks)
ANSWER:
The independent variables are- “Food” and “Dose”. The dependent variable is- “Number of
words”.
‘Food’ has two levels. ‘1’ is ‘food’ and ‘2’ is ‘no food’. ‘Dose’ has two levels. ‘1’ is ‘low’ and
‘2’ is high. Simultaneously two independent variables have 4 levels. These are- ‘low_food’ (1,
1), ‘low_nofood’ (1, 2), ‘high_food’ (2, 1) and ‘high_nofood’ (2, 2).
b) What type of analysis has been used to analyse the data? (2 Marks)
ANSWER:
Repeated Measure ANOVA is utilised to analyse the data. The repeated measure ANOVA refers
as within-subjects ANOVA or ANOVA for correlated samples (Girden, 1992). The repeated
measure ANOVA controls for heterogeneity, increases power and enables the experimenter to
run fewer subjects.
c) Report all important findings as if for a results section of a lab report, starting with the
descriptive statistics and then reporting the inferential statistics. What do the results suggest
about the importance of dose and food? Answer as fully as possible. (4 marks for reporting the
four means, then 4 marks for correctly reporting each of the main effects, and 6 marks for
correctly reporting and interpreting the interaction).
ANSWER:
6
QUESTION 2
Researchers wanted to test a new drug believed to improve cognitive performance. Previous
tests had shown that the drug increased memory for words in participants who had not eaten
recently. They were now concerned about what dose (‘high’ or ‘low’) should be given and
whether the drug would also be effective after a meal as well as on an empty stomach (‘food’ or
‘no food’). To investigate this, 20 participants were each given a word recall test on four
separate occasions, following: 1) a low dose of the drug after eating a meal (‘low_food’); 2) a
high dose after eating a meal (‘high_food’); 3) a low dose on an empty stomach (‘low_nofood’);
and 4) a high dose on an empty stomach (‘high_nofood’). The number of words participants
recalled was recorded in each of the four conditions. Each participant took part in all four
conditions and the order of conditions was counterbalanced across all participants. The SPSS
output for the analysis of the data is shown below.
a) What are the independent (IV) and dependent (DV) variables in this experiment? How many
levels do/does the IV(s) have and what are they? (5 Marks)
ANSWER:
The independent variables are- “Food” and “Dose”. The dependent variable is- “Number of
words”.
‘Food’ has two levels. ‘1’ is ‘food’ and ‘2’ is ‘no food’. ‘Dose’ has two levels. ‘1’ is ‘low’ and
‘2’ is high. Simultaneously two independent variables have 4 levels. These are- ‘low_food’ (1,
1), ‘low_nofood’ (1, 2), ‘high_food’ (2, 1) and ‘high_nofood’ (2, 2).
b) What type of analysis has been used to analyse the data? (2 Marks)
ANSWER:
Repeated Measure ANOVA is utilised to analyse the data. The repeated measure ANOVA refers
as within-subjects ANOVA or ANOVA for correlated samples (Girden, 1992). The repeated
measure ANOVA controls for heterogeneity, increases power and enables the experimenter to
run fewer subjects.
c) Report all important findings as if for a results section of a lab report, starting with the
descriptive statistics and then reporting the inferential statistics. What do the results suggest
about the importance of dose and food? Answer as fully as possible. (4 marks for reporting the
four means, then 4 marks for correctly reporting each of the main effects, and 6 marks for
correctly reporting and interpreting the interaction).
ANSWER:
6
⊘ This is a preview!⊘
Do you want full access?
Subscribe today to unlock all pages.
Trusted by 1+ million students worldwide
PS7002 retake test (2018)
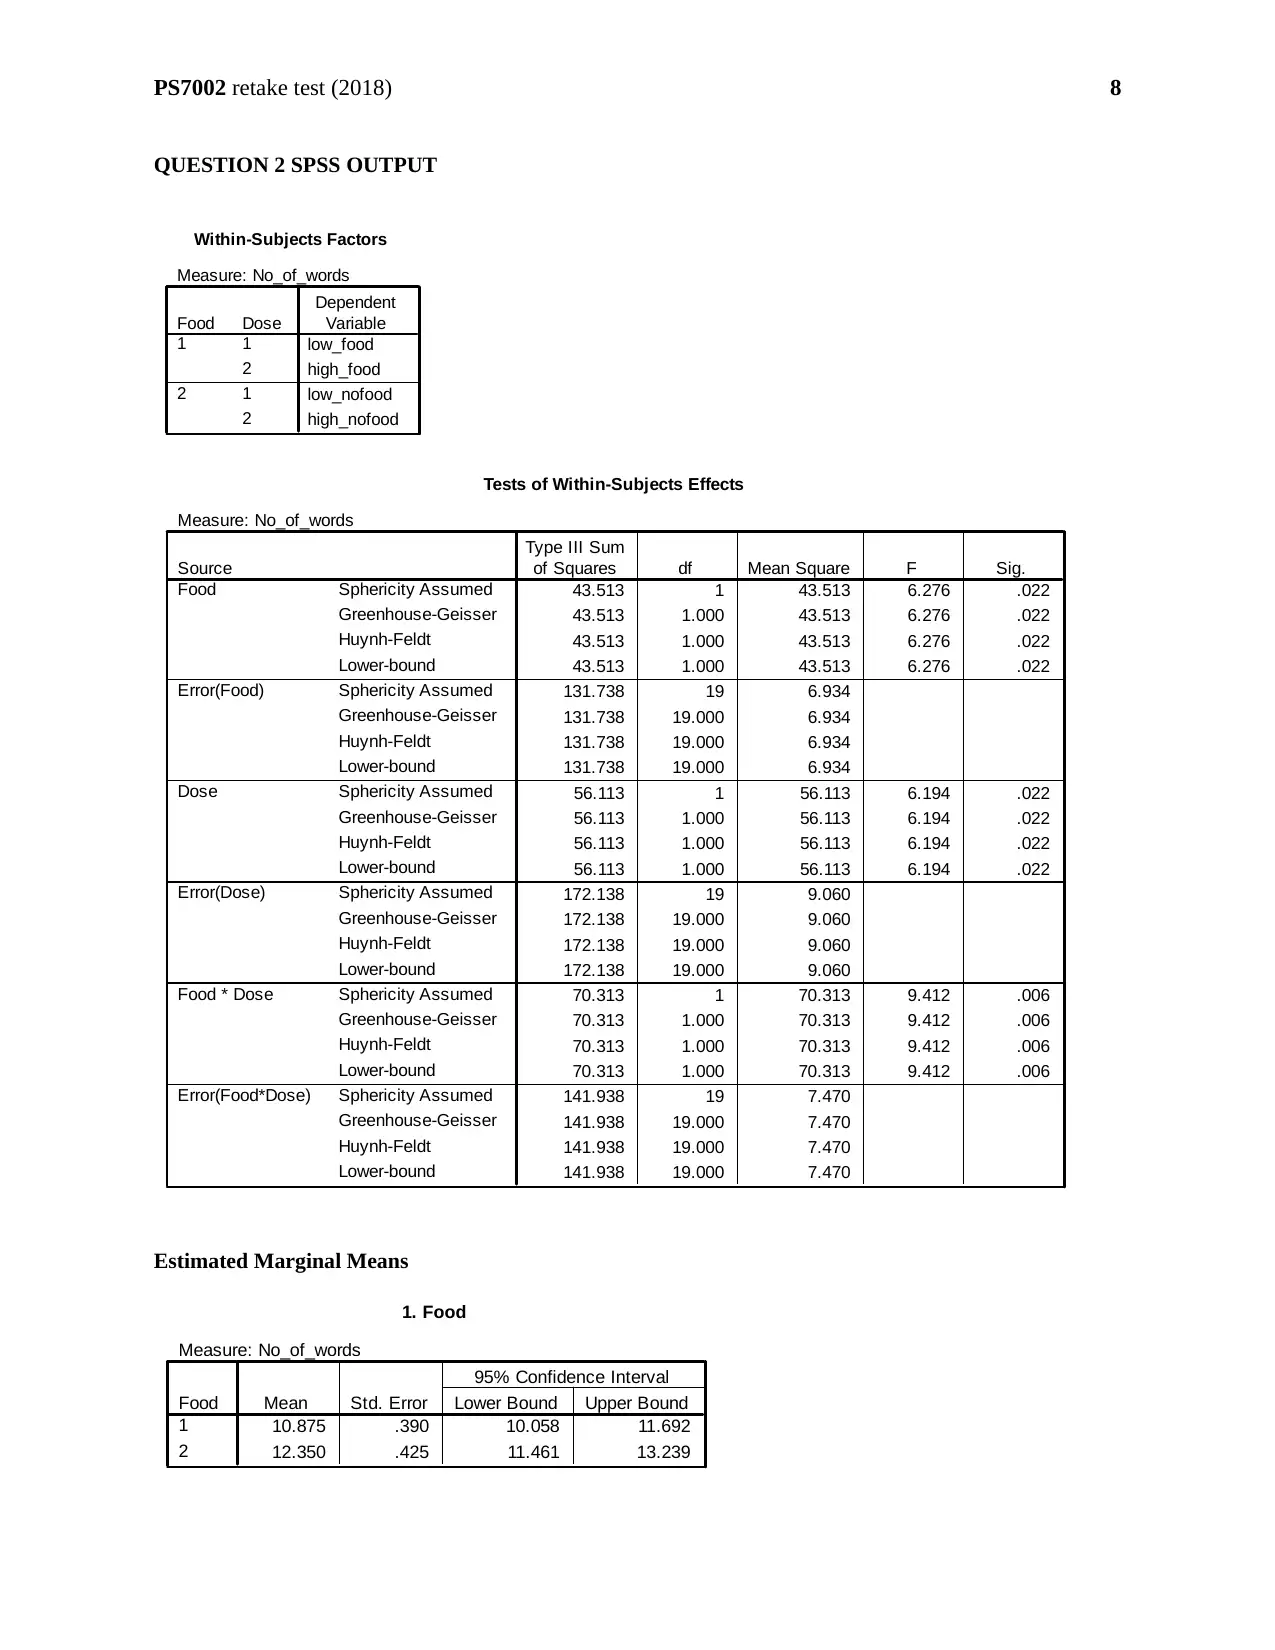
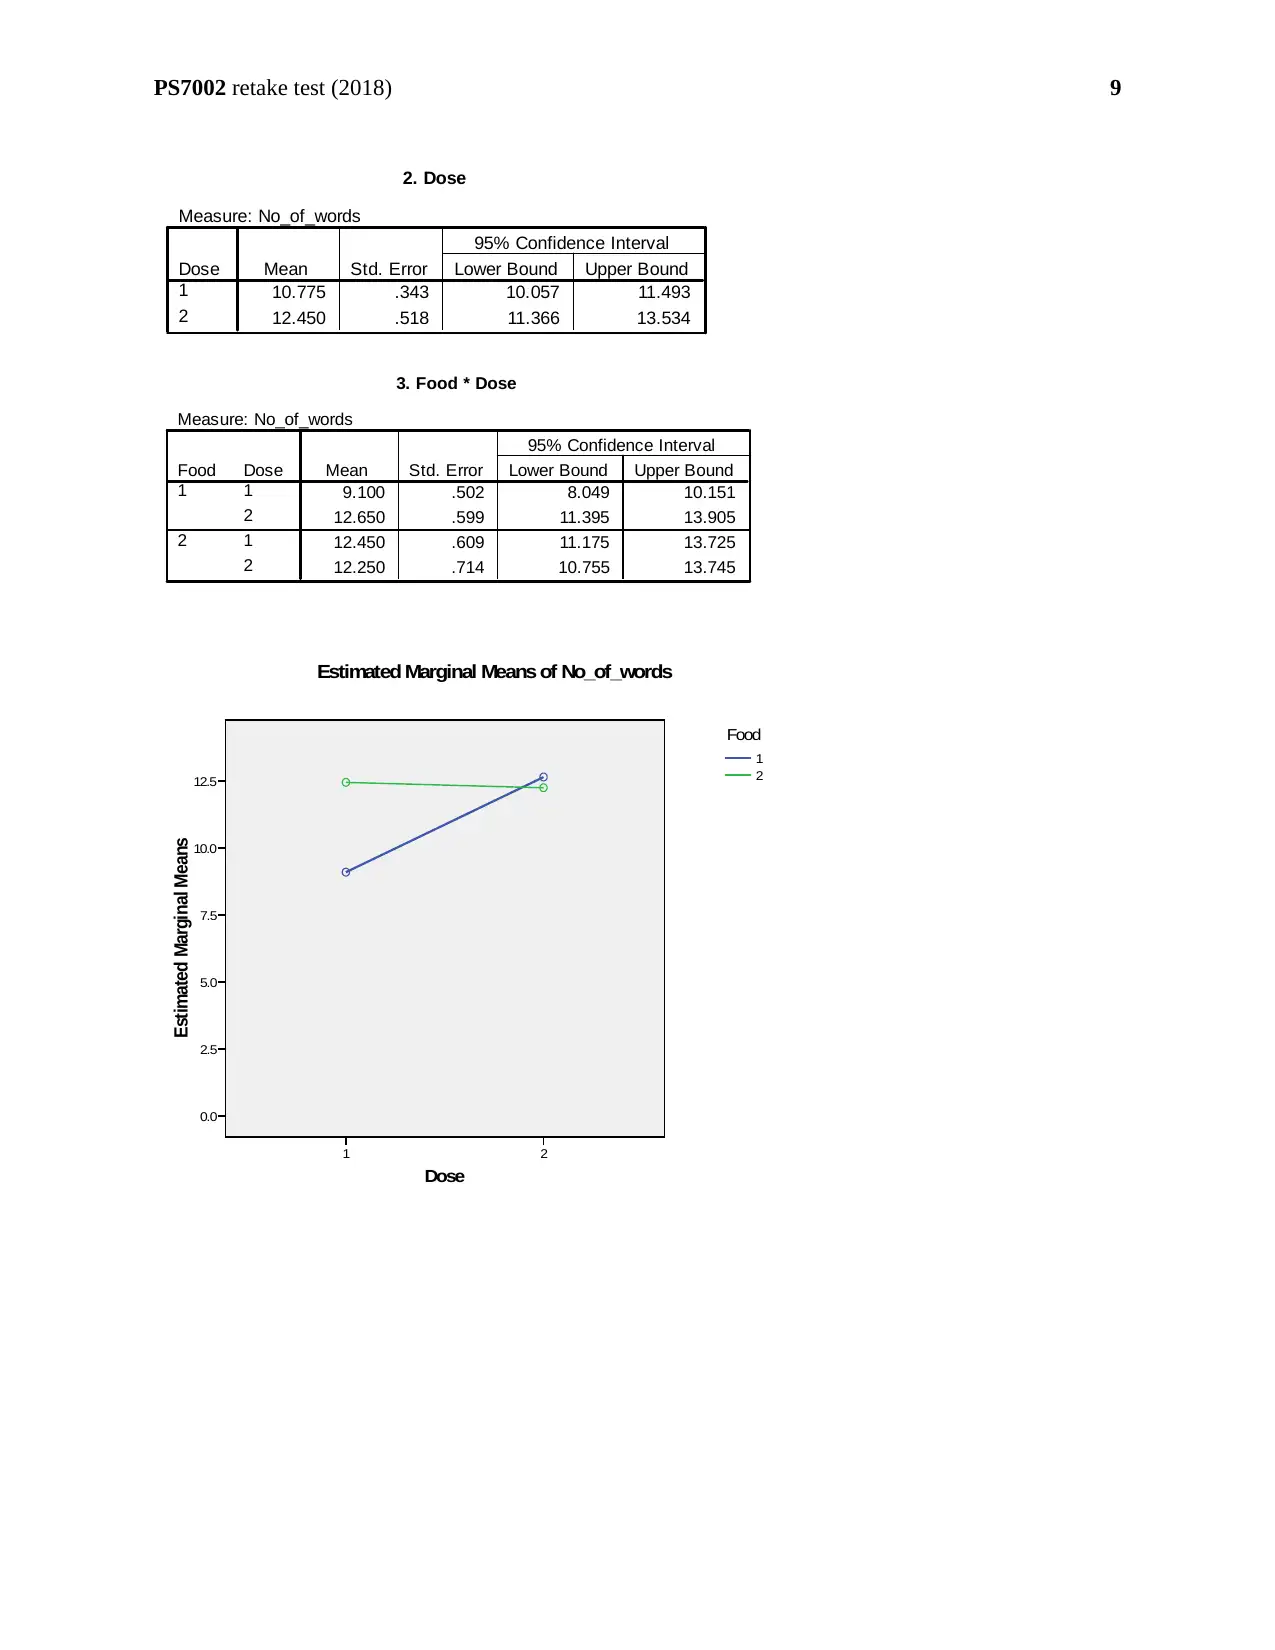
Number of words recalled is on an average greater for ‘non-food’ rather than ‘food’
(12.35>10.875). Number of words recalled is on an average greater for ‘high’ dose rather than
‘low’ dose (12.45>10.775). The number of words recalled is highest for ‘food with high dose’
(12.65) followed by ‘no-food with low dose’ (12.45). The number of words recalled is lowest
for ‘food with low dose’ (9.1).
‘Food’ has F-statistic = 6.276 with 1 degrees of freedom and p-value = 0.022. Therefore, the
main effect of ‘Food’ is significant at 5% level of significance (as 0.022<0.05). ‘Dose’ has F-
statistic = 6.194 with 1 degrees of freedom and p-value = 0.022. Therefore, the main effect of
‘Dose’ is significant at 5% level of significance (as 0.022<0.05). There is an interaction between
‘Food’ and ‘Dose’ with F-statistic = 9.412 with 1 degrees of freedom and p-value = 0.006.
Unadjusted pro-hoc tests reveals the significant difference between various levels of foods and
doses (p-value = 0.006<0.05) (Source: Laerd Statistics., 2018). Therefore, the interaction effect
is also found to be significant.
The plot refers that the effects for ‘Food’ are clearly different for two doses. Hence, the effects
of ‘Food’ for high and low doses are separate. These factors are ‘Simple effects’. The
interaction effect of the two main factors ‘Food’ and ‘Dose’ are significant to each other. In
other words, there is no such thing as the effect of ‘Food’ as a main effect suggests (Bakeman,
2005).
7
Paraphrase This Document
Need a fresh take? Get an instant paraphrase of this document with our AI Paraphraser
PS7002 retake test (2018)
QUESTION 2 SPSS OUTPUT
Within-Subjects Factors
Measure: No_of_words
low_food
high_food
low_nofood
high_nofood
Dose
1
2
1
2
Food
1
2
Dependent
Variable
Tests of Within-Subjects Effects
Measure: No_of_words
43.513 1 43.513 6.276 .022
43.513 1.000 43.513 6.276 .022
43.513 1.000 43.513 6.276 .022
43.513 1.000 43.513 6.276 .022
131.738 19 6.934
131.738 19.000 6.934
131.738 19.000 6.934
131.738 19.000 6.934
56.113 1 56.113 6.194 .022
56.113 1.000 56.113 6.194 .022
56.113 1.000 56.113 6.194 .022
56.113 1.000 56.113 6.194 .022
172.138 19 9.060
172.138 19.000 9.060
172.138 19.000 9.060
172.138 19.000 9.060
70.313 1 70.313 9.412 .006
70.313 1.000 70.313 9.412 .006
70.313 1.000 70.313 9.412 .006
70.313 1.000 70.313 9.412 .006
141.938 19 7.470
141.938 19.000 7.470
141.938 19.000 7.470
141.938 19.000 7.470
Sphericity Assumed
Greenhouse-Geisser
Huynh-Feldt
Lower-bound
Sphericity Assumed
Greenhouse-Geisser
Huynh-Feldt
Lower-bound
Sphericity Assumed
Greenhouse-Geisser
Huynh-Feldt
Lower-bound
Sphericity Assumed
Greenhouse-Geisser
Huynh-Feldt
Lower-bound
Sphericity Assumed
Greenhouse-Geisser
Huynh-Feldt
Lower-bound
Sphericity Assumed
Greenhouse-Geisser
Huynh-Feldt
Lower-bound
Source
Food
Error(Food)
Dose
Error(Dose)
Food * Dose
Error(Food*Dose)
Type III Sum
of Squares df Mean Square F Sig.
Estimated Marginal Means
1. Food
Measure: No_of_words
10.875 .390 10.058 11.692
12.350 .425 11.461 13.239
Food
1
2
Mean Std. Error Lower Bound Upper Bound
95% Confidence Interval
8
PS7002 retake test (2018)
2. Dose
Measure: No_of_words
10.775 .343 10.057 11.493
12.450 .518 11.366 13.534
Dose
1
2
Mean Std. Error Lower Bound Upper Bound
95% Confidence Interval
3. Food * Dose
Measure: No_of_words
9.100 .502 8.049 10.151
12.650 .599 11.395 13.905
12.450 .609 11.175 13.725
12.250 .714 10.755 13.745
Dose
1
2
1
2
Food
1
2
Mean Std. Error Lower Bound Upper Bound
95% Confidence Interval
Dose
21
Estimated Marginal Means
12.5
10.0
7.5
5.0
2.5
0.0
2
1
Food
Estimated Marginal Means of No_of_words
9
⊘ This is a preview!⊘
Do you want full access?
Subscribe today to unlock all pages.
Trusted by 1+ million students worldwide
PS7002 retake test (2018)
QUESTION 3
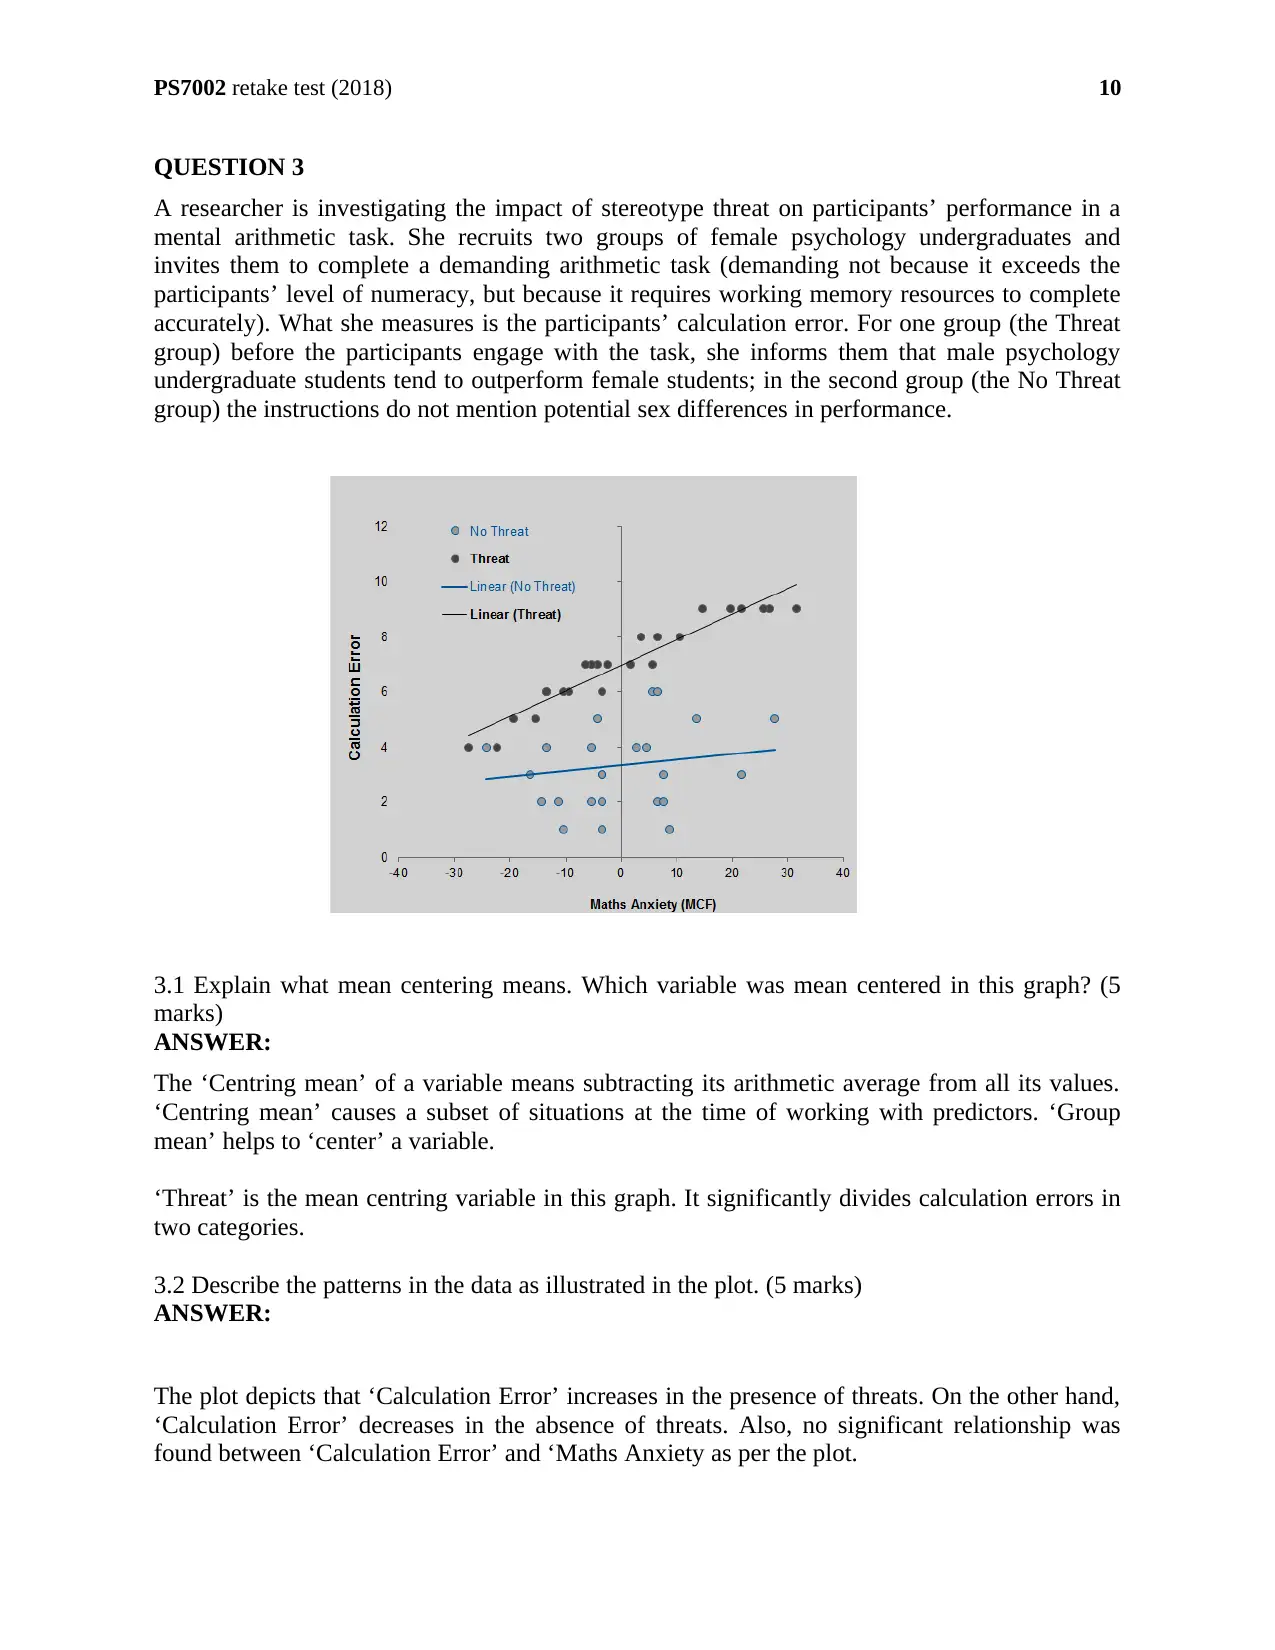
A researcher is investigating the impact of stereotype threat on participants’ performance in a
mental arithmetic task. She recruits two groups of female psychology undergraduates and
invites them to complete a demanding arithmetic task (demanding not because it exceeds the
participants’ level of numeracy, but because it requires working memory resources to complete
accurately). What she measures is the participants’ calculation error. For one group (the Threat
group) before the participants engage with the task, she informs them that male psychology
undergraduate students tend to outperform female students; in the second group (the No Threat
group) the instructions do not mention potential sex differences in performance.
3.1 Explain what mean centering means. Which variable was mean centered in this graph? (5
marks)
ANSWER:
The ‘Centring mean’ of a variable means subtracting its arithmetic average from all its values.
‘Centring mean’ causes a subset of situations at the time of working with predictors. ‘Group
mean’ helps to ‘center’ a variable.
‘Threat’ is the mean centring variable in this graph. It significantly divides calculation errors in
two categories.
3.2 Describe the patterns in the data as illustrated in the plot. (5 marks)
ANSWER:
The plot depicts that ‘Calculation Error’ increases in the presence of threats. On the other hand,
‘Calculation Error’ decreases in the absence of threats. Also, no significant relationship was
found between ‘Calculation Error’ and ‘Maths Anxiety as per the plot.
10
QUESTION 3
A researcher is investigating the impact of stereotype threat on participants’ performance in a
mental arithmetic task. She recruits two groups of female psychology undergraduates and
invites them to complete a demanding arithmetic task (demanding not because it exceeds the
participants’ level of numeracy, but because it requires working memory resources to complete
accurately). What she measures is the participants’ calculation error. For one group (the Threat
group) before the participants engage with the task, she informs them that male psychology
undergraduate students tend to outperform female students; in the second group (the No Threat
group) the instructions do not mention potential sex differences in performance.
3.1 Explain what mean centering means. Which variable was mean centered in this graph? (5
marks)
ANSWER:
The ‘Centring mean’ of a variable means subtracting its arithmetic average from all its values.
‘Centring mean’ causes a subset of situations at the time of working with predictors. ‘Group
mean’ helps to ‘center’ a variable.
‘Threat’ is the mean centring variable in this graph. It significantly divides calculation errors in
two categories.
3.2 Describe the patterns in the data as illustrated in the plot. (5 marks)
ANSWER:
The plot depicts that ‘Calculation Error’ increases in the presence of threats. On the other hand,
‘Calculation Error’ decreases in the absence of threats. Also, no significant relationship was
found between ‘Calculation Error’ and ‘Maths Anxiety as per the plot.
10
Paraphrase This Document
Need a fresh take? Get an instant paraphrase of this document with our AI Paraphraser
PS7002 retake test (2018)
3.3 She regressed calculation errors onto three predictor variables: (i) maths anxiety (mean
centered form), (ii) threat group (dummy coded as -0 for No Threat, and 1 for Threat) and (iii)
the interaction between the first two predictors. The output from this multiple regression
analysis is show below. Report the findings from this multiple regression analysis as if for a lab
report. (15 marks).
11
PS7002 retake test (2018)
ANSWER:
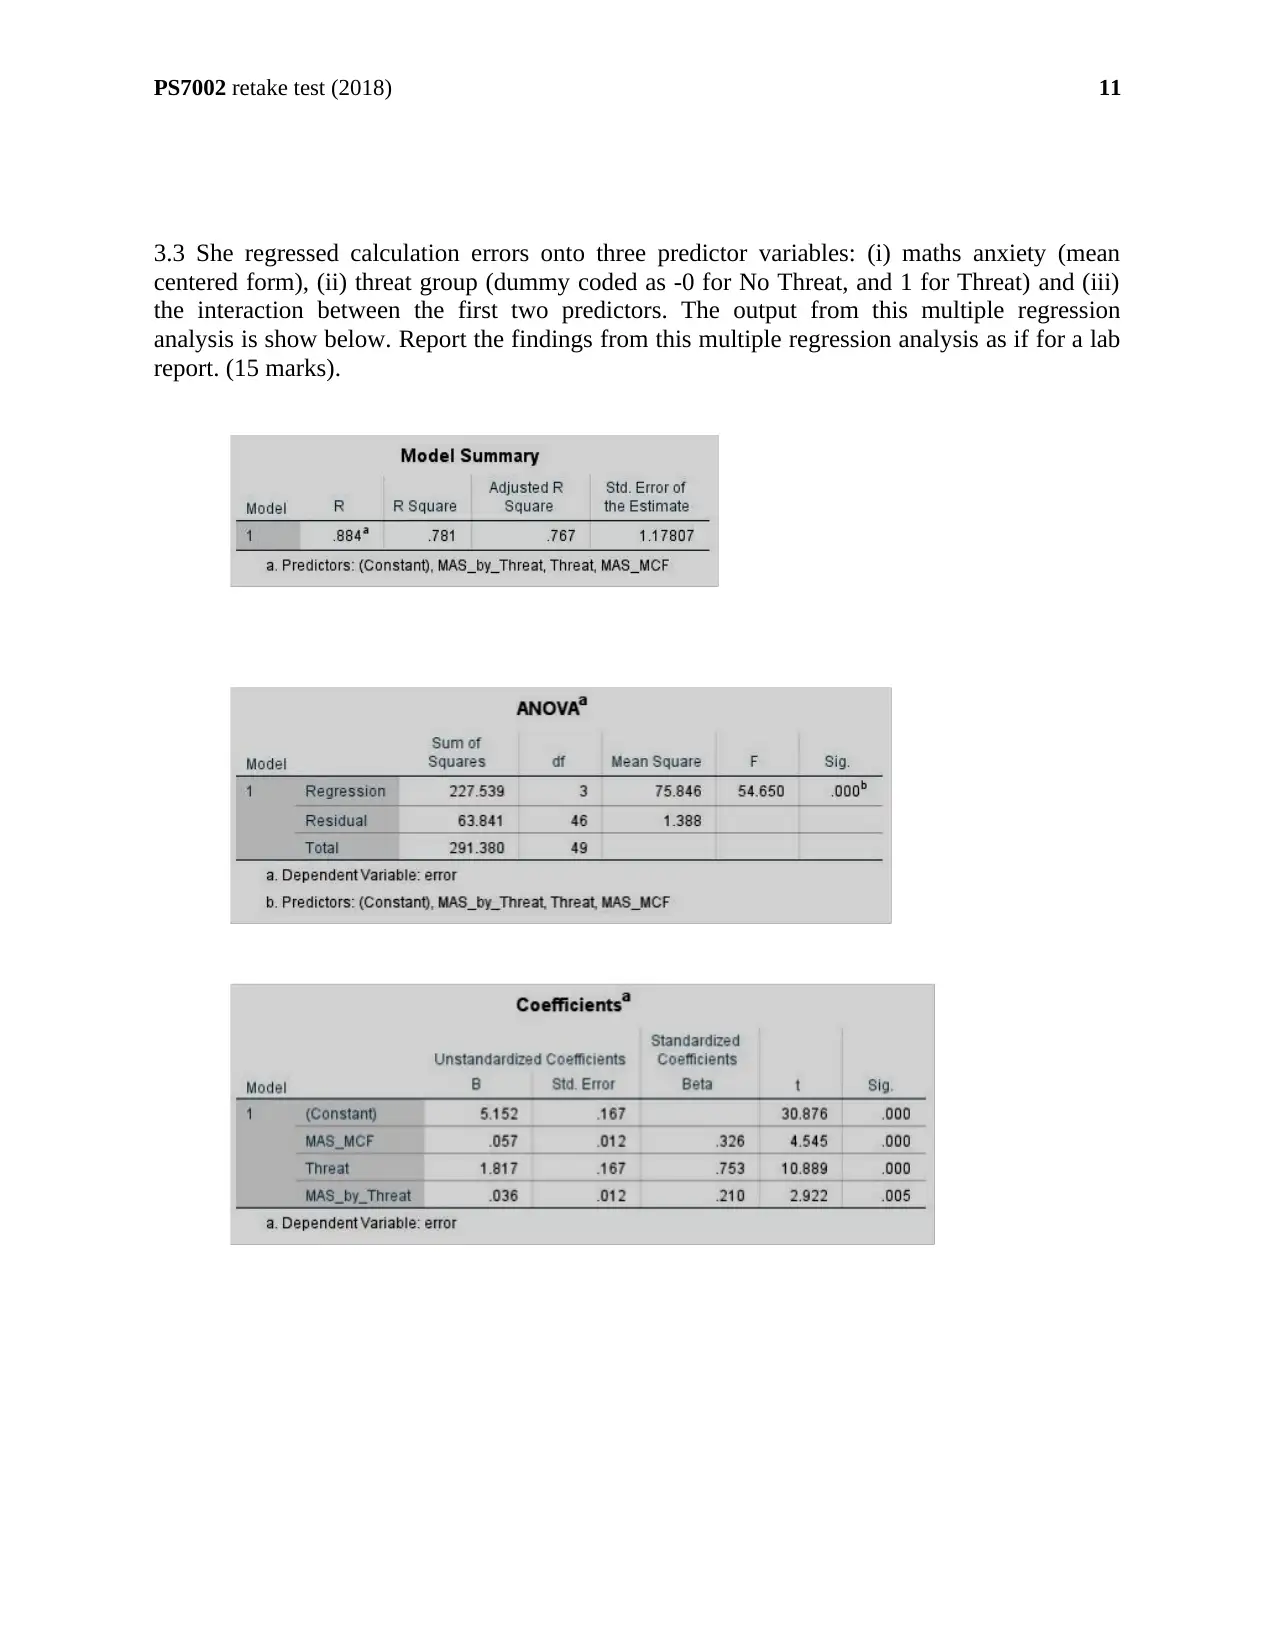
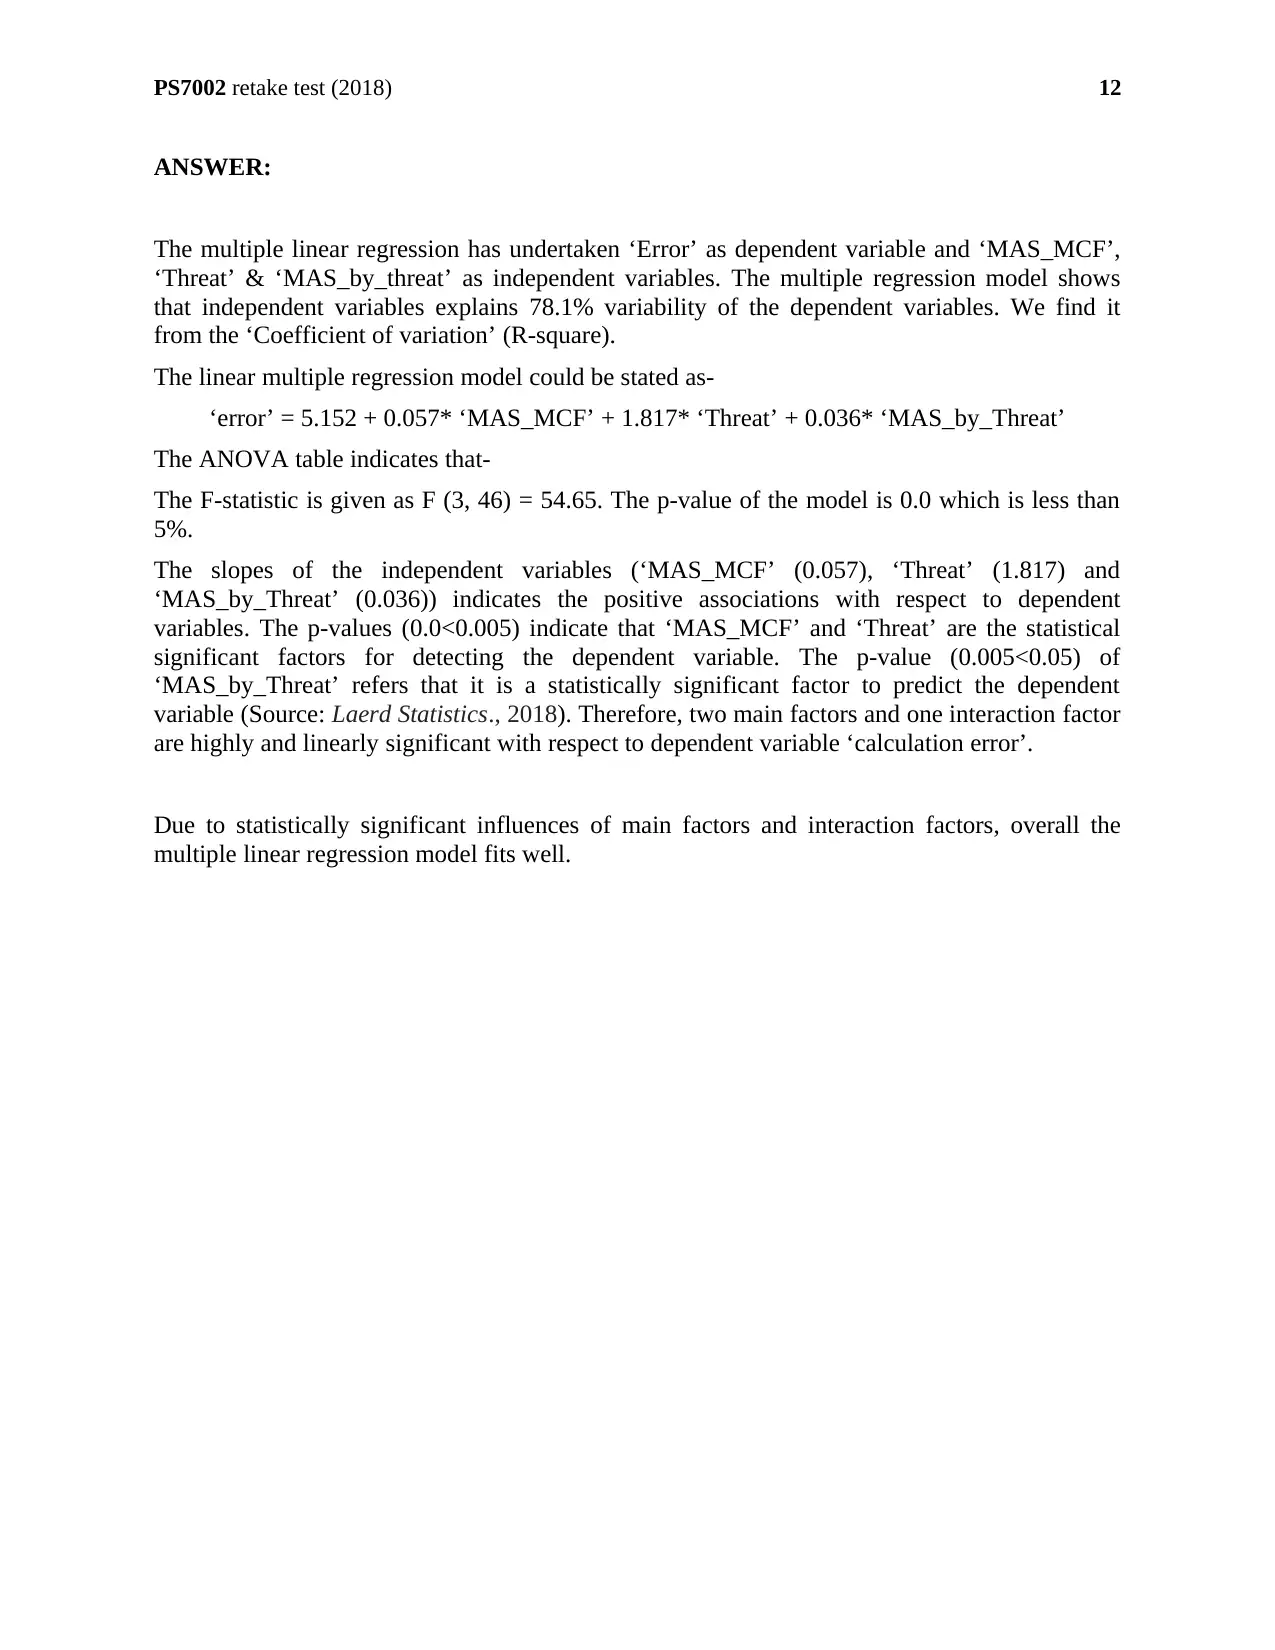
The multiple linear regression has undertaken ‘Error’ as dependent variable and ‘MAS_MCF’,
‘Threat’ & ‘MAS_by_threat’ as independent variables. The multiple regression model shows
that independent variables explains 78.1% variability of the dependent variables. We find it
from the ‘Coefficient of variation’ (R-square).
The linear multiple regression model could be stated as-
‘error’ = 5.152 + 0.057* ‘MAS_MCF’ + 1.817* ‘Threat’ + 0.036* ‘MAS_by_Threat’
The ANOVA table indicates that-
The F-statistic is given as F (3, 46) = 54.65. The p-value of the model is 0.0 which is less than
5%.
The slopes of the independent variables (‘MAS_MCF’ (0.057), ‘Threat’ (1.817) and
‘MAS_by_Threat’ (0.036)) indicates the positive associations with respect to dependent
variables. The p-values (0.0<0.005) indicate that ‘MAS_MCF’ and ‘Threat’ are the statistical
significant factors for detecting the dependent variable. The p-value (0.005<0.05) of
‘MAS_by_Threat’ refers that it is a statistically significant factor to predict the dependent
variable (Source: Laerd Statistics., 2018). Therefore, two main factors and one interaction factor
are highly and linearly significant with respect to dependent variable ‘calculation error’.
Due to statistically significant influences of main factors and interaction factors, overall the
multiple linear regression model fits well.
12
ANSWER:
The multiple linear regression has undertaken ‘Error’ as dependent variable and ‘MAS_MCF’,
‘Threat’ & ‘MAS_by_threat’ as independent variables. The multiple regression model shows
that independent variables explains 78.1% variability of the dependent variables. We find it
from the ‘Coefficient of variation’ (R-square).
The linear multiple regression model could be stated as-
‘error’ = 5.152 + 0.057* ‘MAS_MCF’ + 1.817* ‘Threat’ + 0.036* ‘MAS_by_Threat’
The ANOVA table indicates that-
The F-statistic is given as F (3, 46) = 54.65. The p-value of the model is 0.0 which is less than
5%.
The slopes of the independent variables (‘MAS_MCF’ (0.057), ‘Threat’ (1.817) and
‘MAS_by_Threat’ (0.036)) indicates the positive associations with respect to dependent
variables. The p-values (0.0<0.005) indicate that ‘MAS_MCF’ and ‘Threat’ are the statistical
significant factors for detecting the dependent variable. The p-value (0.005<0.05) of
‘MAS_by_Threat’ refers that it is a statistically significant factor to predict the dependent
variable (Source: Laerd Statistics., 2018). Therefore, two main factors and one interaction factor
are highly and linearly significant with respect to dependent variable ‘calculation error’.
Due to statistically significant influences of main factors and interaction factors, overall the
multiple linear regression model fits well.
12
⊘ This is a preview!⊘
Do you want full access?
Subscribe today to unlock all pages.
Trusted by 1+ million students worldwide
1 out of 17
Related Documents


Your All-in-One AI-Powered Toolkit for Academic Success.
+13062052269
info@desklib.com
Available 24*7 on WhatsApp / Email
![[object Object]](/_next/static/media/star-bottom.7253800d.svg)
Unlock your academic potential
Copyright © 2020–2026 A2Z Services. All Rights Reserved. Developed and managed by ZUCOL.