Financial Analysis and Performance of Barkes Computers (ACC01)
VerifiedAdded on 2023/06/03
|12
|3137
|293
Case Study
AI Summary
This report analyzes the financial performance of Barkes Computers from 2013 to 2017, utilizing ratio analysis (profitability, liquidity, and leverage) and trend analysis (vertical and horizontal). The analysis reveals declining gross and net profit ratios, while return on equity and assets show improvement. Asset turnover and debt-to-equity ratios also indicate trends. The current ratio shows a deteriorating liquidity position. Trend analysis further highlights changes in sales, COGS, expenses, and net profit, as well as shifts in asset and liability compositions. The report concludes with an evaluation of the company's financial position and offers recommendations based on the findings.
Running head: ACC01
ACC01
Name of the student
Name of the university
Student ID
Author note
ACC01
Name of the student
Name of the university
Student ID
Author note
Paraphrase This Document
Need a fresh take? Get an instant paraphrase of this document with our AI Paraphraser
1ACC01
Table of Contents
Introduction................................................................................................................................2
Performance analysis of the company........................................................................................2
Conclusion and recommendation...............................................................................................8
References................................................................................................................................10
2ACC01
Introduction
The main objective of the report is to analyse the financial position and financial
performance of Barkes Computers through various financial measures. These measures will
include the various ratio analyses like profitability ratio, liquid ratio and leverage ratio.
Performance of the company for the last 5 years covering the years from 2013 to 2017 will be
analysed through vertical and horizontal analysis of income statement as well as the balance
sheet of the company (Uechi et al., 2015). Based on the ratios and trend analyses the
performance of the company for the last 5 years will be evaluated. Further, on the basis of the
discussion the report will provide the conclusion and recommendation.
Performance analysis of the company
Ratio analysis
Ratio Formula 2017 2016 2015 2014 2013
Gross profit
ratio Gross profit/Revenue 26.65% 32.07% 33.81% 39.64%
60.45
%
Net profit
ratio Net profit/Revenue 11.51% 13.12% 13.52% 15.32%
21.64
%
Return on
equity
Net profit/Owner's
equity 2.30% 1.52% 1.23% 0.92% 0.76%
Return on
assets Net profit /Total assets 0.93% 0.76% 0.63% 0.56% 0.47%
Asset
turnover
Sales/Average total
assets 0.08 0.06 0.05 0.04 0.02
Current ratio
Current assets/current
liabilities 0.44 0.47 0.49 0.51 0.52
Debt to equity
ratio
Total liabilities/Total
equity 1.47 0.99 0.95 0.65 0.63
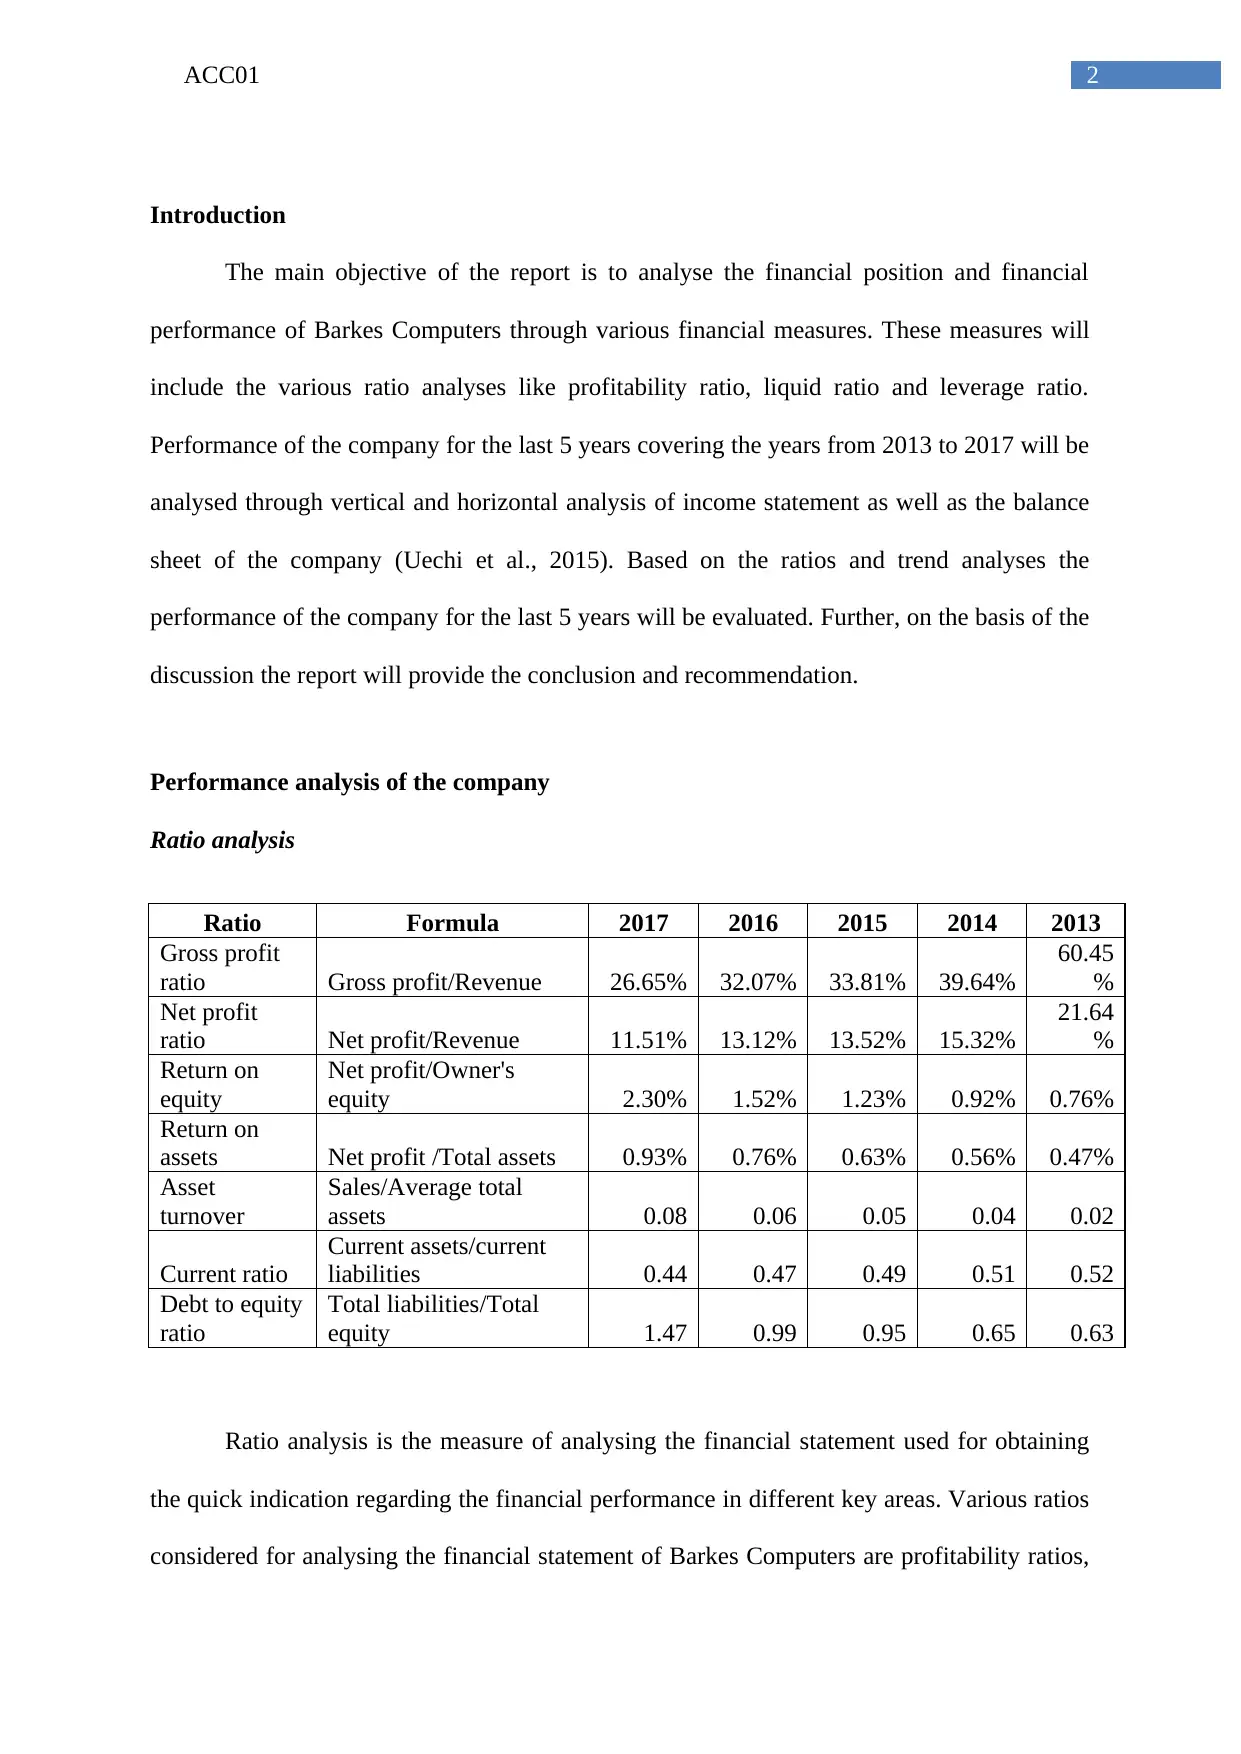
Ratio analysis is the measure of analysing the financial statement used for obtaining
the quick indication regarding the financial performance in different key areas. Various ratios
considered for analysing the financial statement of Barkes Computers are profitability ratios,
Introduction
The main objective of the report is to analyse the financial position and financial
performance of Barkes Computers through various financial measures. These measures will
include the various ratio analyses like profitability ratio, liquid ratio and leverage ratio.
Performance of the company for the last 5 years covering the years from 2013 to 2017 will be
analysed through vertical and horizontal analysis of income statement as well as the balance
sheet of the company (Uechi et al., 2015). Based on the ratios and trend analyses the
performance of the company for the last 5 years will be evaluated. Further, on the basis of the
discussion the report will provide the conclusion and recommendation.
Performance analysis of the company
Ratio analysis
Ratio Formula 2017 2016 2015 2014 2013
Gross profit
ratio Gross profit/Revenue 26.65% 32.07% 33.81% 39.64%
60.45
%
Net profit
ratio Net profit/Revenue 11.51% 13.12% 13.52% 15.32%
21.64
%
Return on
equity
Net profit/Owner's
equity 2.30% 1.52% 1.23% 0.92% 0.76%
Return on
assets Net profit /Total assets 0.93% 0.76% 0.63% 0.56% 0.47%
Asset
turnover
Sales/Average total
assets 0.08 0.06 0.05 0.04 0.02
Current ratio
Current assets/current
liabilities 0.44 0.47 0.49 0.51 0.52
Debt to equity
ratio
Total liabilities/Total
equity 1.47 0.99 0.95 0.65 0.63
Ratio analysis is the measure of analysing the financial statement used for obtaining
the quick indication regarding the financial performance in different key areas. Various ratios
considered for analysing the financial statement of Barkes Computers are profitability ratios,
⊘ This is a preview!⊘
Do you want full access?
Subscribe today to unlock all pages.
Trusted by 1+ million students worldwide
3ACC01
liquid ratio and leverage ratio or solvency ratio (Weygandt, Kimmel & Kieso, 2015). As the
data presented in the financial statement of the company are available readily it assists in
comparing the performance of the company with previous years or with the competitors in
the industry. However, the ratio analysis can be used as the 1st step of analysis as it is based
on the accounting information available through the financial statement of the company and
does not justify the true and fairness of the information provided (Wahlen, Baginski &
Bradshaw, 2014).
Gross profit ratio – it establishes a relationship among the net revenue earned by the
company and the amount left with it after spending the amount towards manufacturing and
selling of the goods or providing the services. This is a profitability ratio and expressed in the
percentage form. The net sales considered here is the total of cash sales as well as credit
sales. It assists in ascertaining the optimum sales price and enhances the efficiencies of the
trading activities. High gross profit ratio indicates that the net sales of the company are high
with consistent cost of the sales. On the other hand, low sales with increasing COGS results
into falling trend of the gross profit (Easton & Sommers, 2018). It can be identified from the
ratio calculation table that the gross profit of the company is in falling trend and it is reduced
from 60.45% to 26.65% over the years from 2013 to 2017.
Net profit ratio – It is the sales percentage left with the company after paying off all the
operating expenses and financial and tax expenses. Net profit does not indicate the cash flows
as the net profits incorporate various non-cash expenses like depreciation and amortization.
However, the major issue associated with net profit margin is it is considered for short term
performance measure as does not reveal any measure for maintaining the profitability over
the long run. It establishes a relationship among the net revenue earned by the company and
the amount left with it after paying taxes, operational and financial expenses. It can be
identified from the ratio calculation table that the net profit of the company is in falling trend
Paraphrase This Document
Need a fresh take? Get an instant paraphrase of this document with our AI Paraphraser
4ACC01
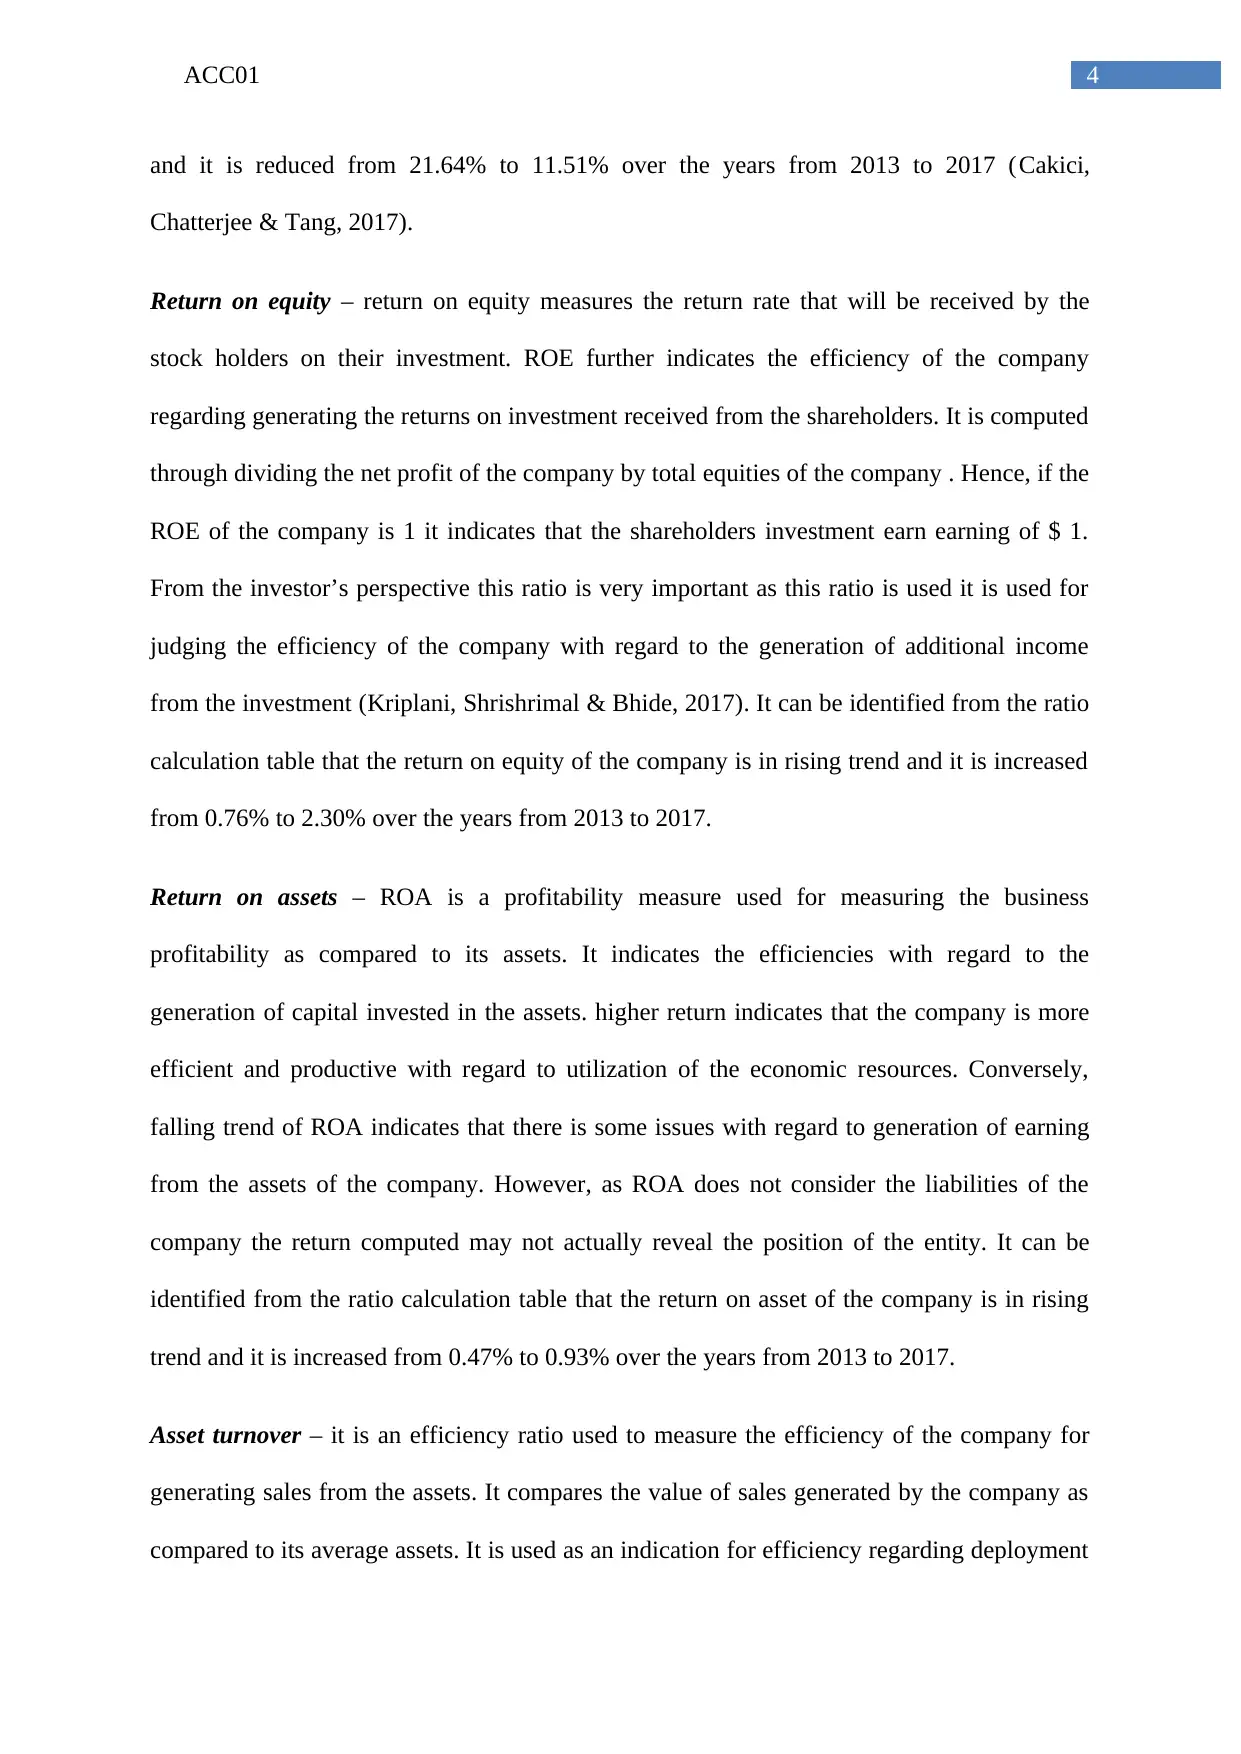
and it is reduced from 21.64% to 11.51% over the years from 2013 to 2017 (Cakici,
Chatterjee & Tang, 2017).
Return on equity – return on equity measures the return rate that will be received by the
stock holders on their investment. ROE further indicates the efficiency of the company
regarding generating the returns on investment received from the shareholders. It is computed
through dividing the net profit of the company by total equities of the company . Hence, if the
ROE of the company is 1 it indicates that the shareholders investment earn earning of $ 1.
From the investor’s perspective this ratio is very important as this ratio is used it is used for
judging the efficiency of the company with regard to the generation of additional income
from the investment (Kriplani, Shrishrimal & Bhide, 2017). It can be identified from the ratio
calculation table that the return on equity of the company is in rising trend and it is increased
from 0.76% to 2.30% over the years from 2013 to 2017.
Return on assets – ROA is a profitability measure used for measuring the business
profitability as compared to its assets. It indicates the efficiencies with regard to the
generation of capital invested in the assets. higher return indicates that the company is more
efficient and productive with regard to utilization of the economic resources. Conversely,
falling trend of ROA indicates that there is some issues with regard to generation of earning
from the assets of the company. However, as ROA does not consider the liabilities of the
company the return computed may not actually reveal the position of the entity. It can be
identified from the ratio calculation table that the return on asset of the company is in rising
trend and it is increased from 0.47% to 0.93% over the years from 2013 to 2017.
Asset turnover – it is an efficiency ratio used to measure the efficiency of the company for
generating sales from the assets. It compares the value of sales generated by the company as
compared to its average assets. It is used as an indication for efficiency regarding deployment
5ACC01
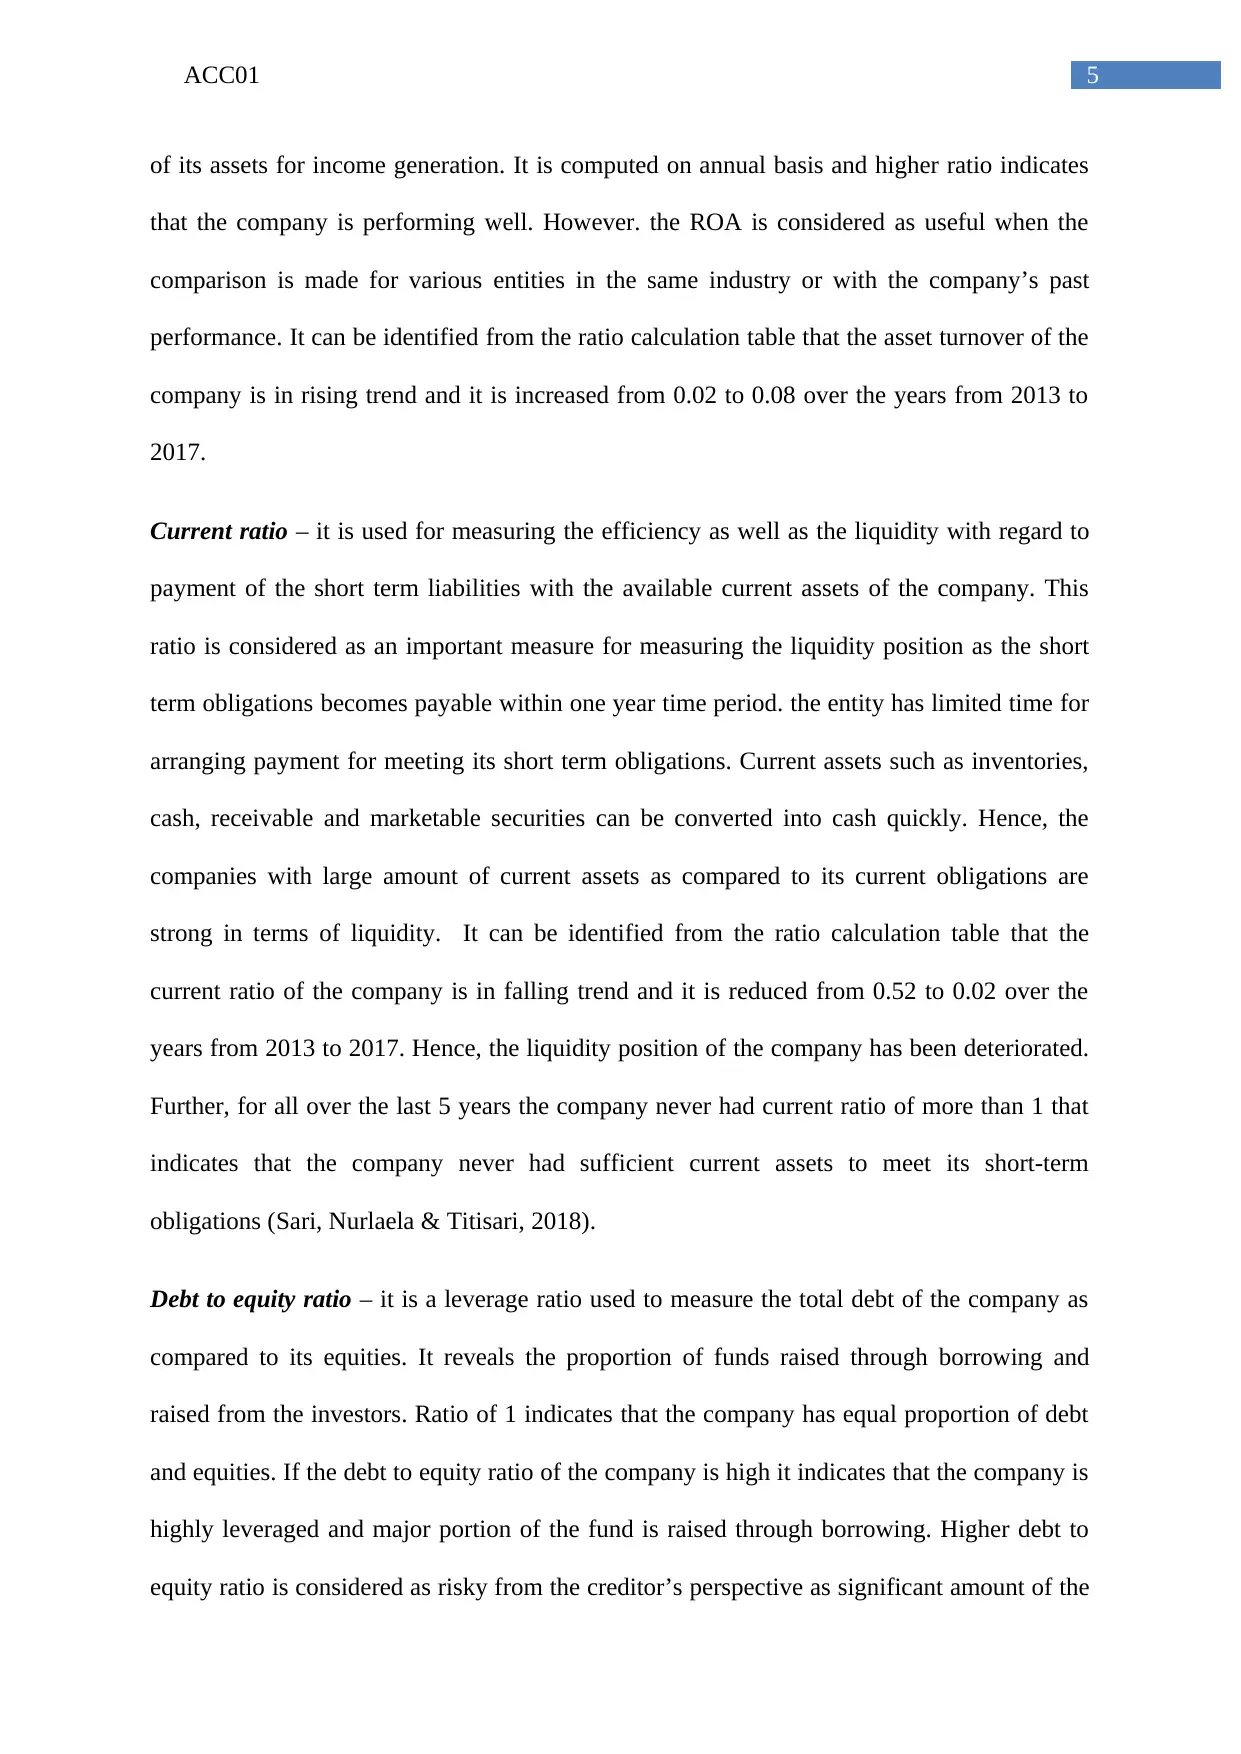
of its assets for income generation. It is computed on annual basis and higher ratio indicates
that the company is performing well. However. the ROA is considered as useful when the
comparison is made for various entities in the same industry or with the company’s past
performance. It can be identified from the ratio calculation table that the asset turnover of the
company is in rising trend and it is increased from 0.02 to 0.08 over the years from 2013 to
2017.
Current ratio – it is used for measuring the efficiency as well as the liquidity with regard to
payment of the short term liabilities with the available current assets of the company. This
ratio is considered as an important measure for measuring the liquidity position as the short
term obligations becomes payable within one year time period. the entity has limited time for
arranging payment for meeting its short term obligations. Current assets such as inventories,
cash, receivable and marketable securities can be converted into cash quickly. Hence, the
companies with large amount of current assets as compared to its current obligations are
strong in terms of liquidity. It can be identified from the ratio calculation table that the
current ratio of the company is in falling trend and it is reduced from 0.52 to 0.02 over the
years from 2013 to 2017. Hence, the liquidity position of the company has been deteriorated.
Further, for all over the last 5 years the company never had current ratio of more than 1 that
indicates that the company never had sufficient current assets to meet its short-term
obligations (Sari, Nurlaela & Titisari, 2018).
Debt to equity ratio – it is a leverage ratio used to measure the total debt of the company as
compared to its equities. It reveals the proportion of funds raised through borrowing and
raised from the investors. Ratio of 1 indicates that the company has equal proportion of debt
and equities. If the debt to equity ratio of the company is high it indicates that the company is
highly leveraged and major portion of the fund is raised through borrowing. Higher debt to
equity ratio is considered as risky from the creditor’s perspective as significant amount of the
⊘ This is a preview!⊘
Do you want full access?
Subscribe today to unlock all pages.
Trusted by 1+ million students worldwide
6ACC01
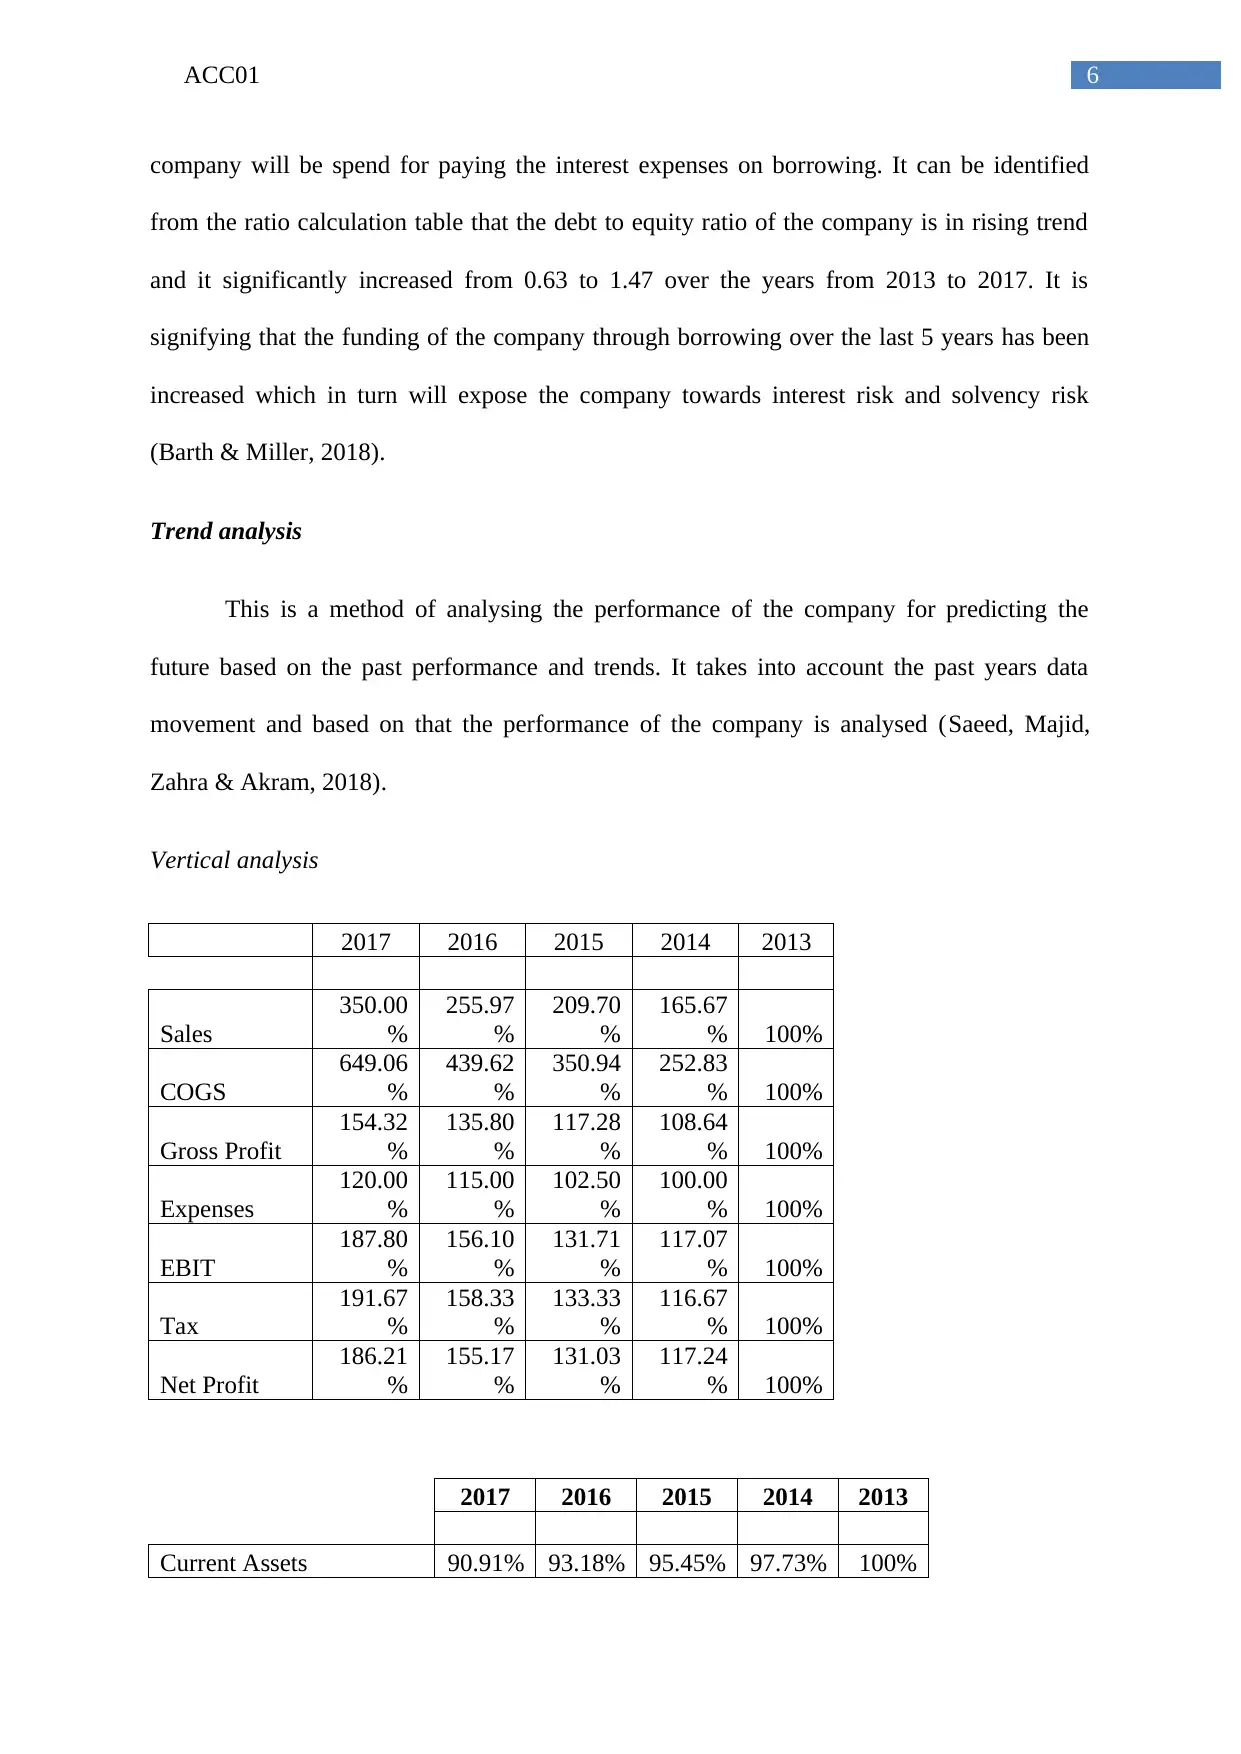
company will be spend for paying the interest expenses on borrowing. It can be identified
from the ratio calculation table that the debt to equity ratio of the company is in rising trend
and it significantly increased from 0.63 to 1.47 over the years from 2013 to 2017. It is
signifying that the funding of the company through borrowing over the last 5 years has been
increased which in turn will expose the company towards interest risk and solvency risk
(Barth & Miller, 2018).
Trend analysis
This is a method of analysing the performance of the company for predicting the
future based on the past performance and trends. It takes into account the past years data
movement and based on that the performance of the company is analysed (Saeed, Majid,
Zahra & Akram, 2018).
Vertical analysis
2017 2016 2015 2014 2013
Sales
350.00
%
255.97
%
209.70
%
165.67
% 100%
COGS
649.06
%
439.62
%
350.94
%
252.83
% 100%
Gross Profit
154.32
%
135.80
%
117.28
%
108.64
% 100%
Expenses
120.00
%
115.00
%
102.50
%
100.00
% 100%
EBIT
187.80
%
156.10
%
131.71
%
117.07
% 100%
Tax
191.67
%
158.33
%
133.33
%
116.67
% 100%
Net Profit
186.21
%
155.17
%
131.03
%
117.24
% 100%
2017 2016 2015 2014 2013
Current Assets 90.91% 93.18% 95.45% 97.73% 100%
Paraphrase This Document
Need a fresh take? Get an instant paraphrase of this document with our AI Paraphraser
7ACC01
Non-current Assets 93.33% 95.00% 96.67% 98.33% 100%
Total Assets 93.25% 94.94% 96.62% 98.31% 100%
Current Liabilities
107.14
%
104.76
%
102.38
%
100.00
% 100%
Non-current Liabilities
150.00
%
125.00
%
125.00
%
100.00
% 100%
Total Liabilities
143.15
%
121.99
%
121.58
%
100.41
% 100%
Owners Equity 61.68% 77.82% 80.84% 96.98% 100%
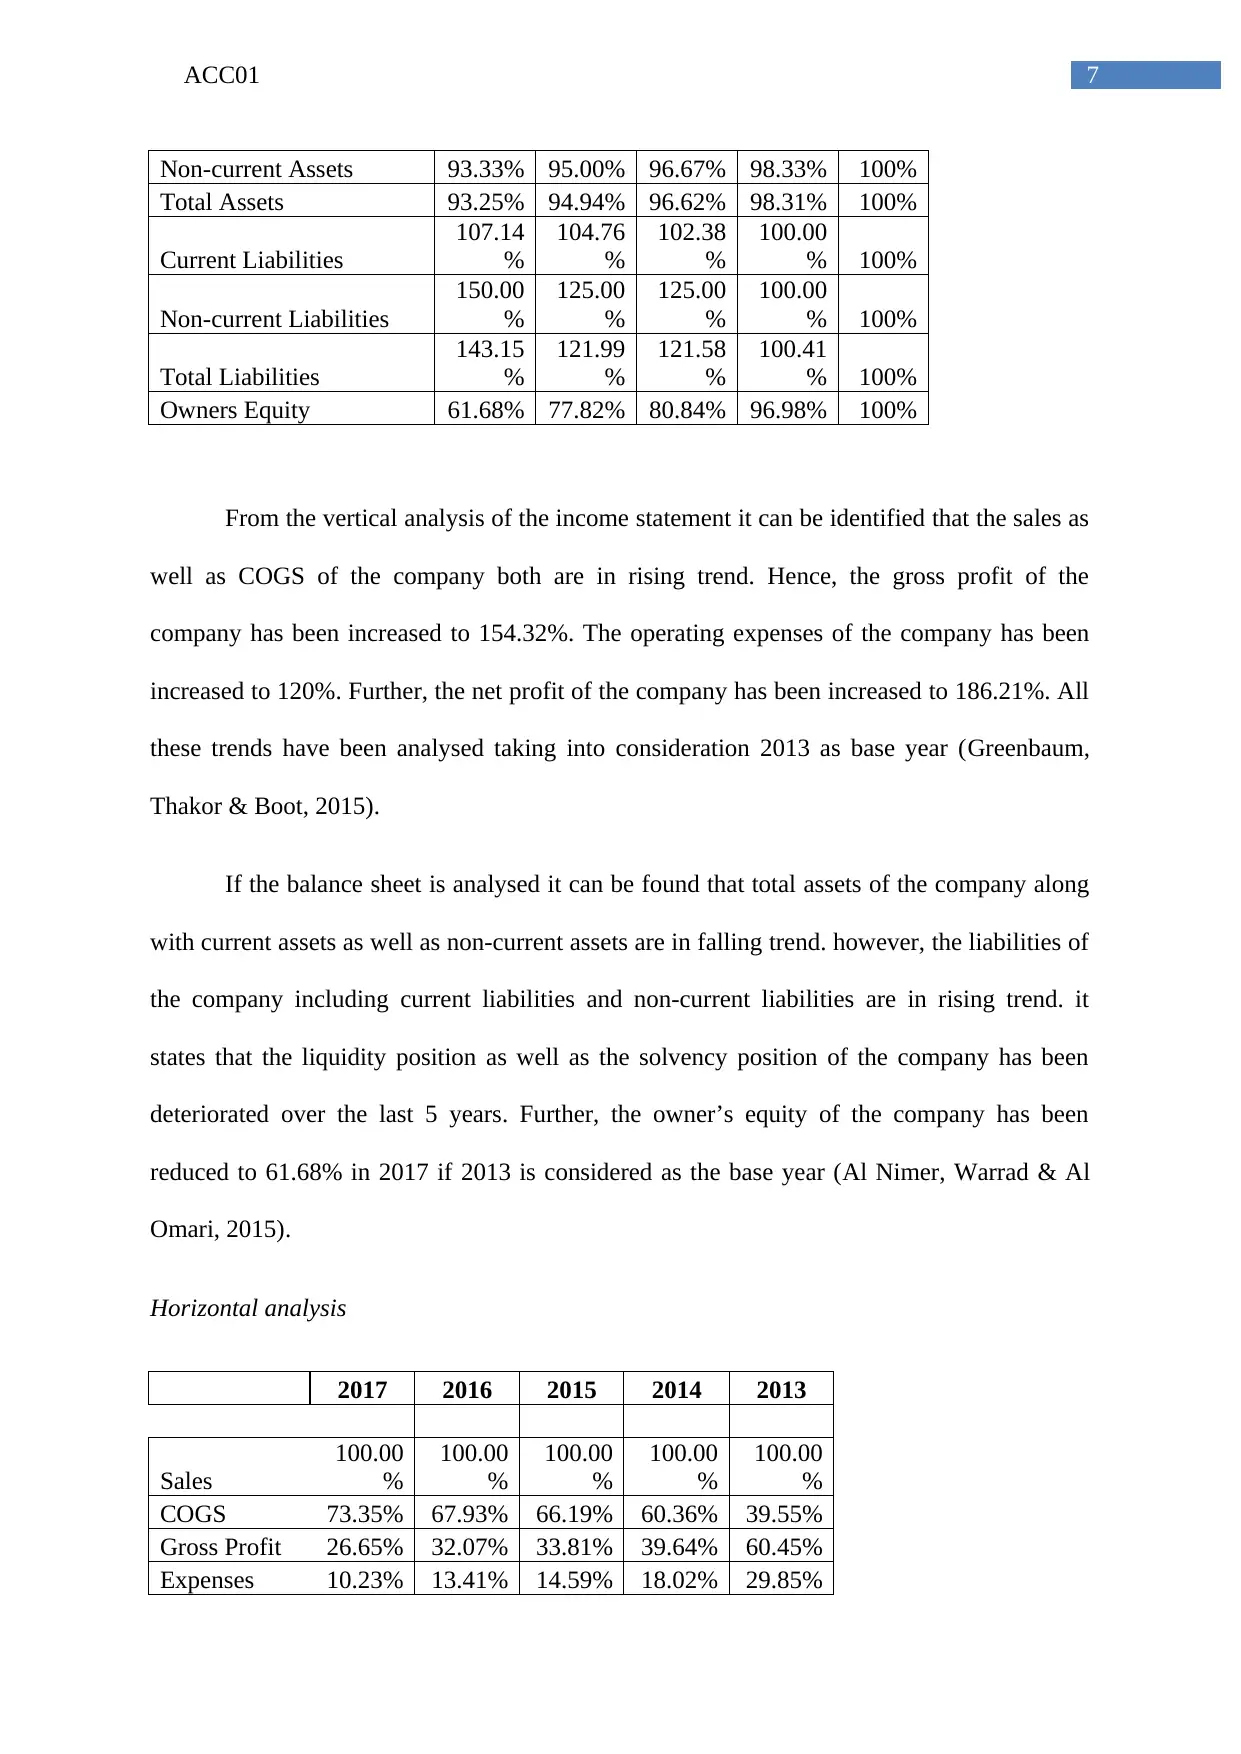
From the vertical analysis of the income statement it can be identified that the sales as
well as COGS of the company both are in rising trend. Hence, the gross profit of the
company has been increased to 154.32%. The operating expenses of the company has been
increased to 120%. Further, the net profit of the company has been increased to 186.21%. All
these trends have been analysed taking into consideration 2013 as base year (Greenbaum,
Thakor & Boot, 2015).
If the balance sheet is analysed it can be found that total assets of the company along
with current assets as well as non-current assets are in falling trend. however, the liabilities of
the company including current liabilities and non-current liabilities are in rising trend. it
states that the liquidity position as well as the solvency position of the company has been
deteriorated over the last 5 years. Further, the owner’s equity of the company has been
reduced to 61.68% in 2017 if 2013 is considered as the base year (Al Nimer, Warrad & Al
Omari, 2015).
Horizontal analysis
2017 2016 2015 2014 2013
Sales
100.00
%
100.00
%
100.00
%
100.00
%
100.00
%
COGS 73.35% 67.93% 66.19% 60.36% 39.55%
Gross Profit 26.65% 32.07% 33.81% 39.64% 60.45%
Expenses 10.23% 13.41% 14.59% 18.02% 29.85%
Non-current Assets 93.33% 95.00% 96.67% 98.33% 100%
Total Assets 93.25% 94.94% 96.62% 98.31% 100%
Current Liabilities
107.14
%
104.76
%
102.38
%
100.00
% 100%
Non-current Liabilities
150.00
%
125.00
%
125.00
%
100.00
% 100%
Total Liabilities
143.15
%
121.99
%
121.58
%
100.41
% 100%
Owners Equity 61.68% 77.82% 80.84% 96.98% 100%
From the vertical analysis of the income statement it can be identified that the sales as
well as COGS of the company both are in rising trend. Hence, the gross profit of the
company has been increased to 154.32%. The operating expenses of the company has been
increased to 120%. Further, the net profit of the company has been increased to 186.21%. All
these trends have been analysed taking into consideration 2013 as base year (Greenbaum,
Thakor & Boot, 2015).
If the balance sheet is analysed it can be found that total assets of the company along
with current assets as well as non-current assets are in falling trend. however, the liabilities of
the company including current liabilities and non-current liabilities are in rising trend. it
states that the liquidity position as well as the solvency position of the company has been
deteriorated over the last 5 years. Further, the owner’s equity of the company has been
reduced to 61.68% in 2017 if 2013 is considered as the base year (Al Nimer, Warrad & Al
Omari, 2015).
Horizontal analysis
2017 2016 2015 2014 2013
Sales
100.00
%
100.00
%
100.00
%
100.00
%
100.00
%
COGS 73.35% 67.93% 66.19% 60.36% 39.55%
Gross Profit 26.65% 32.07% 33.81% 39.64% 60.45%
Expenses 10.23% 13.41% 14.59% 18.02% 29.85%
8ACC01
EBIT 16.42% 18.66% 19.22% 21.62% 30.60%
Tax 4.90% 5.54% 5.69% 6.31% 8.96%
Net Profit 11.51% 13.12% 13.52% 15.32% 21.64%
2017 2016 2015 2014 2013
Current Assets 3.45% 3.47% 3.49% 3.52% 3.54%
Non-current Assets 96.55%
96.53
% 96.51% 96.48% 96.46%
Total Assets
100.00
% 100%
100.00
% 100.00%
100.00
%
Current Liabilities 7.76% 7.45% 7.15% 6.87% 6.75%
Non-current Liabilities 51.72%
42.34
% 41.60% 32.71% 32.15%
Total Liabilities 59.48%
49.79
% 48.75% 39.57% 38.75%
Owners Equity 40.52%
50.21
% 51.25% 60.43% 61.25%
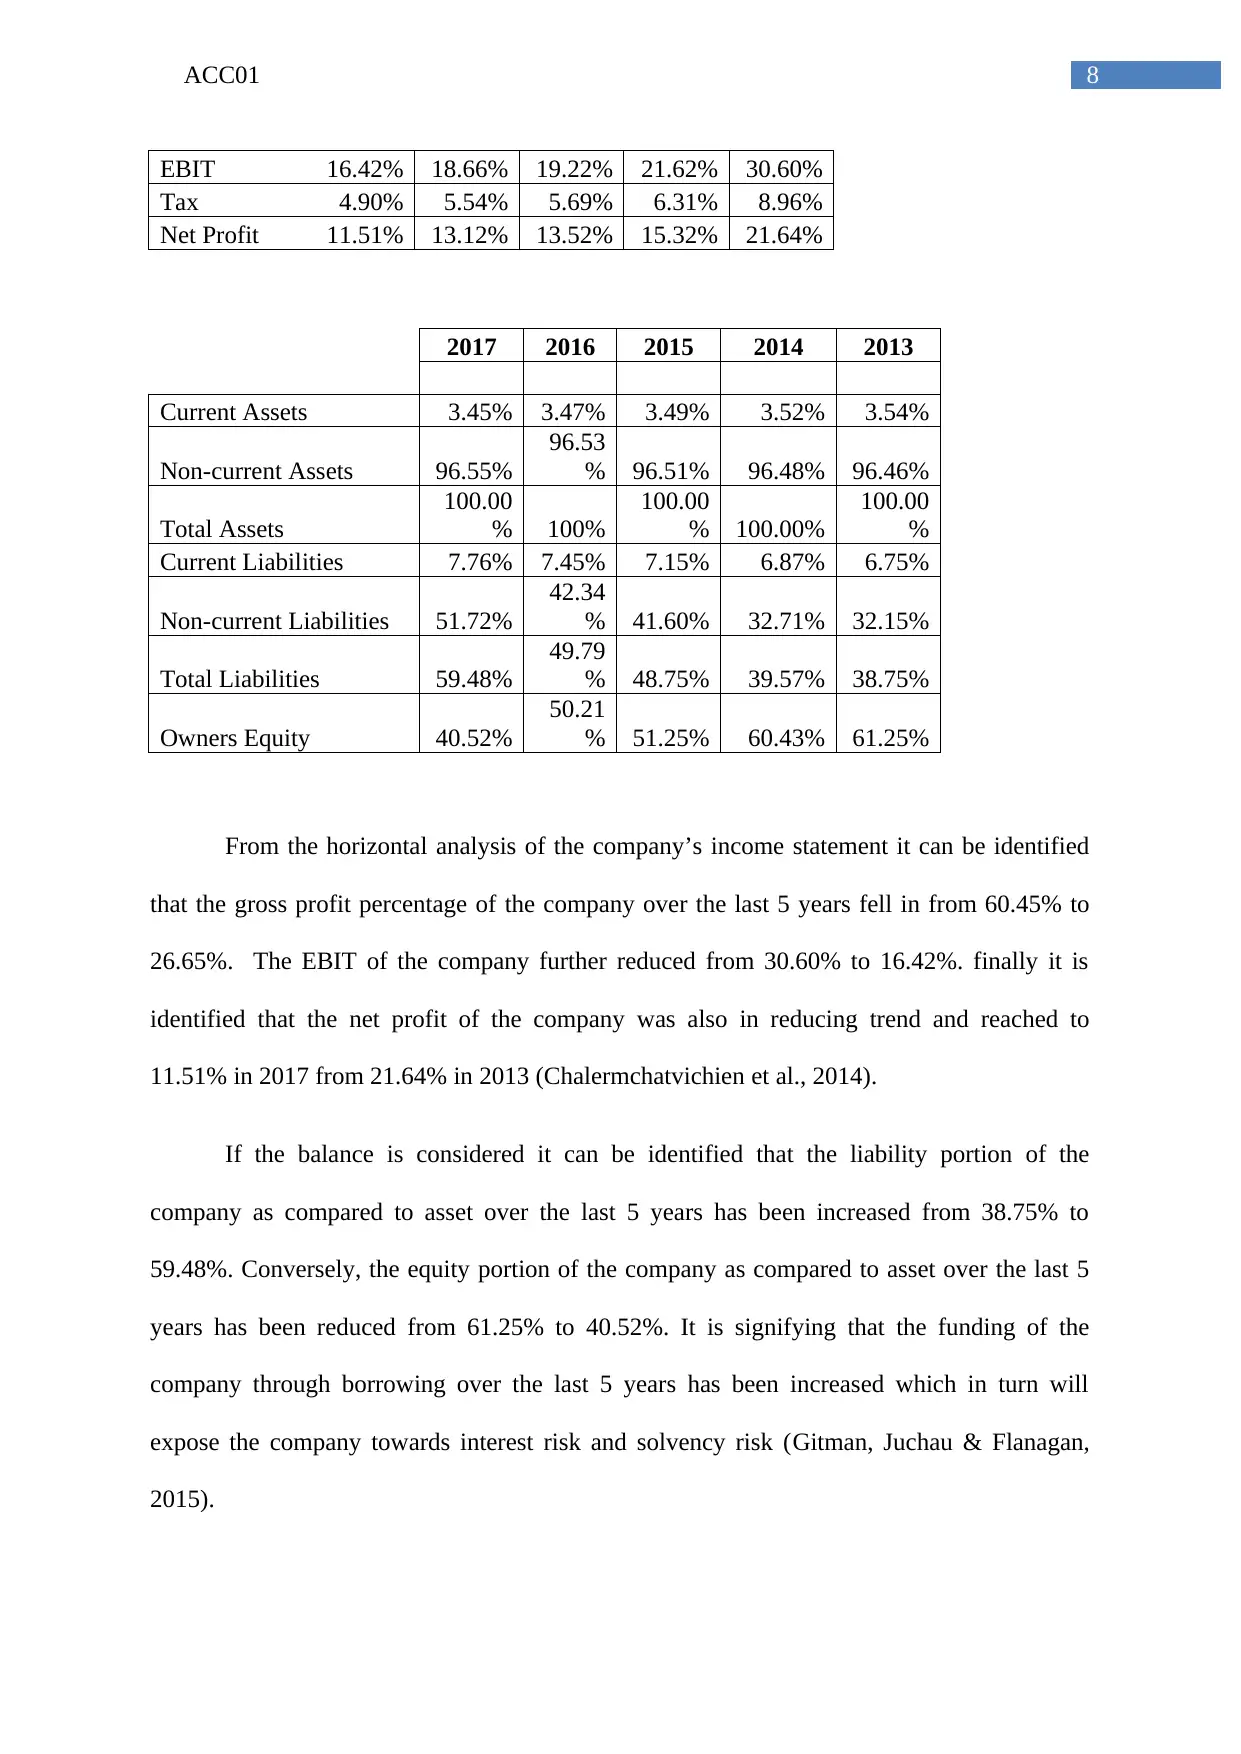
From the horizontal analysis of the company’s income statement it can be identified
that the gross profit percentage of the company over the last 5 years fell in from 60.45% to
26.65%. The EBIT of the company further reduced from 30.60% to 16.42%. finally it is
identified that the net profit of the company was also in reducing trend and reached to
11.51% in 2017 from 21.64% in 2013 (Chalermchatvichien et al., 2014).
If the balance is considered it can be identified that the liability portion of the
company as compared to asset over the last 5 years has been increased from 38.75% to
59.48%. Conversely, the equity portion of the company as compared to asset over the last 5
years has been reduced from 61.25% to 40.52%. It is signifying that the funding of the
company through borrowing over the last 5 years has been increased which in turn will
expose the company towards interest risk and solvency risk (Gitman, Juchau & Flanagan,
2015).
EBIT 16.42% 18.66% 19.22% 21.62% 30.60%
Tax 4.90% 5.54% 5.69% 6.31% 8.96%
Net Profit 11.51% 13.12% 13.52% 15.32% 21.64%
2017 2016 2015 2014 2013
Current Assets 3.45% 3.47% 3.49% 3.52% 3.54%
Non-current Assets 96.55%
96.53
% 96.51% 96.48% 96.46%
Total Assets
100.00
% 100%
100.00
% 100.00%
100.00
%
Current Liabilities 7.76% 7.45% 7.15% 6.87% 6.75%
Non-current Liabilities 51.72%
42.34
% 41.60% 32.71% 32.15%
Total Liabilities 59.48%
49.79
% 48.75% 39.57% 38.75%
Owners Equity 40.52%
50.21
% 51.25% 60.43% 61.25%
From the horizontal analysis of the company’s income statement it can be identified
that the gross profit percentage of the company over the last 5 years fell in from 60.45% to
26.65%. The EBIT of the company further reduced from 30.60% to 16.42%. finally it is
identified that the net profit of the company was also in reducing trend and reached to
11.51% in 2017 from 21.64% in 2013 (Chalermchatvichien et al., 2014).
If the balance is considered it can be identified that the liability portion of the
company as compared to asset over the last 5 years has been increased from 38.75% to
59.48%. Conversely, the equity portion of the company as compared to asset over the last 5
years has been reduced from 61.25% to 40.52%. It is signifying that the funding of the
company through borrowing over the last 5 years has been increased which in turn will
expose the company towards interest risk and solvency risk (Gitman, Juchau & Flanagan,
2015).
⊘ This is a preview!⊘
Do you want full access?
Subscribe today to unlock all pages.
Trusted by 1+ million students worldwide
9ACC01
Conclusion and recommendation
From the above calculation and interpretation it can be concluded that the profitability
position of the company with regard to the gross profit and net profit has been deteriorated
over the last 5 years. however, the company has improved its position with regard to
generation of profit from the assets as well as deploying its assets. Further, if the liquidity
position of the company for the last 5 years in considered it can be stated that the company
never had current ratio of more than 1. It indicates that the company never had sufficient
current assets to meet its short-term obligations. Further, the debt equity ratio trend is
indicating the the leverage position of the company over the last 5 years has been
deteriorated.
Therefore, it is recommended that to improve the profitability position the company
shall take necessary steps for reducing its COGS as well as other expenses, wherever possible
to improve the gross profit as well as net profit position. Further, the liquidity position of the
company can be improved through paying off the current obligations. Moreover, it is
recommended that for further requirement of fund the company shall raise the fund through
equities instead of borrowings.
Paraphrase This Document
Need a fresh take? Get an instant paraphrase of this document with our AI Paraphraser
10ACC01
References
Al Nimer, M., Warrad, L., & Al Omari, R. (2015). The impact of liquidity on Jordanian
banks profitability through return on assets. European Journal of Business and
Management, 7(7), 229-232.
Barth, J. R., & Miller, S. M. (2018). Benefits and costs of a higher bank “leverage
ratio”. Journal of Financial Stability, 38, 37-52.
Cakici, N., Chatterjee, S., & Tang, Y. (2017). Alternative Profitability Measures and Cross
Section of Expected Stock Returns: International Evidence.
Chalermchatvichien, P., Jumreornvong, S., Jiraporn, P., & Singh, M. (2014). The effect of
bank ownership concentration on capital adequacy, liquidity, and capital
stability. Journal of Financial Services Research, 45(2), 219-240.
Easton, M., & Sommers, Z. (2018). Financial Statement Analysis & Valuation, 5e.
Gitman, L. J., Juchau, R., & Flanagan, J. (2015). Principles of managerial finance. Pearson
Higher Education AU.
Greenbaum, S. I., Thakor, A. V., & Boot, A. (Eds.). (2015). Contemporary financial
intermediation. Academic Press.
Kriplani, P., Shrishrimal, P., & Bhide, S. (2017, July). Granulation of financial time series for
trend analysis and recognition. In Fuzzy Systems (FUZZ-IEEE), 2017 IEEE
International Conference on (pp. 1-6). IEEE.
Saeed, S., Majid, S., Zahra, I., & Akram, S. (2018). Impact of Leverage on Profitability (A
case of Pakistani Textile Companies). Pakistan Research Journal of Management
Sciences, 1(1).
11ACC01
Sari, R. K., Nurlaela, S., & Titisari, K. H. (2018, August). The Effect of Liquidity Ratio,
Profitability Ratio, Company Size, and Leverage on Bond Rating in Construction and
Real Estate Company. In PROCEEDING ICTESS (Internasional Conference on
Technology, Education and Social Sciences).
Uechi, L., Akutsu, T., Stanley, H. E., Marcus, A. J., & Kenett, D. Y. (2015). Sector
dominance ratio analysis of financial markets. Physica A: Statistical Mechanics and
its Applications, 421, 488-509.
Wahlen, J., Baginski, S., & Bradshaw, M. (2014). Financial reporting, financial statement
analysis and valuation. Nelson Education.
Weygandt, J. J., Kimmel, P. D., & Kieso, D. E. (2015). Financial & managerial accounting.
John Wiley & Sons.
⊘ This is a preview!⊘
Do you want full access?
Subscribe today to unlock all pages.
Trusted by 1+ million students worldwide
1 out of 12
Related Documents


Your All-in-One AI-Powered Toolkit for Academic Success.
+13062052269
info@desklib.com
Available 24*7 on WhatsApp / Email
![[object Object]](/_next/static/media/star-bottom.7253800d.svg)
Unlock your academic potential
Copyright © 2020–2026 A2Z Services. All Rights Reserved. Developed and managed by ZUCOL.