Quantitative Analysis of Customer Data for Movie Downloads
VerifiedAdded on 2023/06/03
|14
|3218
|354
AI Summary
This report presents a quantitative analysis of a sample of 50 customers randomly selected from 4815 customers for movie downloads. The report utilizes various quantitative methods to present the results of the analysis conducted with the help of Microsoft Excel. The descriptive statistics of the variables are presented in tables as well as charts such as pie charts, bar charts, and histograms. The tests of hypothesis are done using t-tests and the results presented in the appendices.
Contribute Materials
Your contribution can guide someone’s learning journey. Share your
documents today.
1
FIN10002: Financial Statistics
Assessment 2: Report
By Student’s Name
Tutors Name
Date
FIN10002: Financial Statistics
Assessment 2: Report
By Student’s Name
Tutors Name
Date
Secure Best Marks with AI Grader
Need help grading? Try our AI Grader for instant feedback on your assignments.
2
Executive Summary
The purpose of this report is to highlight a quantitative analysis of a sample of 50
customers randomly selected from 4815 customers given.
This report utilizes various quantitative methods to present the results of the analysis conducted
with the help of Microsoft Excel. The descriptive statistics of the variables are presented in tables
as well as charts such as pie charts, bar charts, and histograms. The tests of hypothesis are done
using t-tests and the results presented in the appendices.
Some of the main findings are that the average dollar amount for all types of movies of the
population was between $141.47 and $187.77 at 95% confidence level. The population mean of
purchases for first choice SciFi movies only was found to be between 28.20 and 39.94 at 95%
level of confidence. it was found the average dollar amount spent for first choice comedy movies
is not more than the average dollar amount spent for first choice drama movie. Moreover, there
was difference in the average purchases for males and females. The regression analysis indicated
that there was no linear relationship between the age of customers and the dollar amount spent on
all type of movies.
3
Table of Contents
Executive Summary ........................................................................................................................ 2
Introduction ..................................................................................................................................... 4
Analysis........................................................................................................................................... 4
Descriptive Statistics ................................................................................................................... 4
Confidence intervals ................................................................................................................... 8
Hypothesis Testing...................................................................................................................... 8
Hypothesis 1............................................................................................................................ 8
Hypothesis 2............................................................................................................................ 8
Correlation and Regression ......................................................................................................... 8
Scatterplot ............................................................................................................................... 9
Linear regression ..................................................................................................................... 9
Coefficients of Correlation and Determination....................................................................... 9
Hypothesis 3.......................................................................................................................... 10
Conclusion .................................................................................................................................... 10
Appendices .................................................................................................................................... 11
Appendix A: Random Sample .................................................................................................. 11
Appendix B: Descriptive Statistics ........................................................................................... 12
B1: Statistical Summary for the Age of Customers .............................................................. 12
B2: Statistical Summary for the Purchases ........................................................................... 12
B3: Statistical Summary for the Dollar Amount Spent ........................................................ 13
Appendix C: Hypothesis tests ................................................................................................... 13
C1: Female and male purchases differ .................................................................................. 13
C2: First choice Comedy and First choice Drama differ in dollar amount spent ................. 14
Appendix D: Regression Model................................................................................................ 14
4
Introduction
A random sample of 50 customers was selected from a population 4,815 customers in a
data set that contains customer details and the types of movies downloaded from an internet site
for a given year. The data set has eight variables:
1. Customer No: is the customers number for this set
2. State: the state of residence of customer
3. City: city of residence
4. Gender: M = Male, F = female
5. First choice: Type of movie category (Action, Comedy, Drama and SciFi)
6. Second Choice: Second choice of movie category
7. Age: age of customer
8. Purchases: Number of purchases
9. DollarAmt: Total amount of purchases in dollars
This report uses descriptive statistics to describe a statistical summary of all the variables.
Further analysis was done to establish the average dollar amount spent on all types of movies and
the average number of purchases for the first choice SciFi movies only. Tests of hypothesis was
also carried out to determine whether the average number of purchases differed for males and
females. The other hypothesis tested was whether the average dollar amount spent for first
choice comedy movies was more than the average spent for first choice drama movies. Finally, a
full regression analysis was performed to investigate the linear relationship between the age of
customers and the total dollar amount spent.
Analysis
A random sample of 50 customers was extracted from a population of 4,815. Below is a
discussion of the sample statistics.
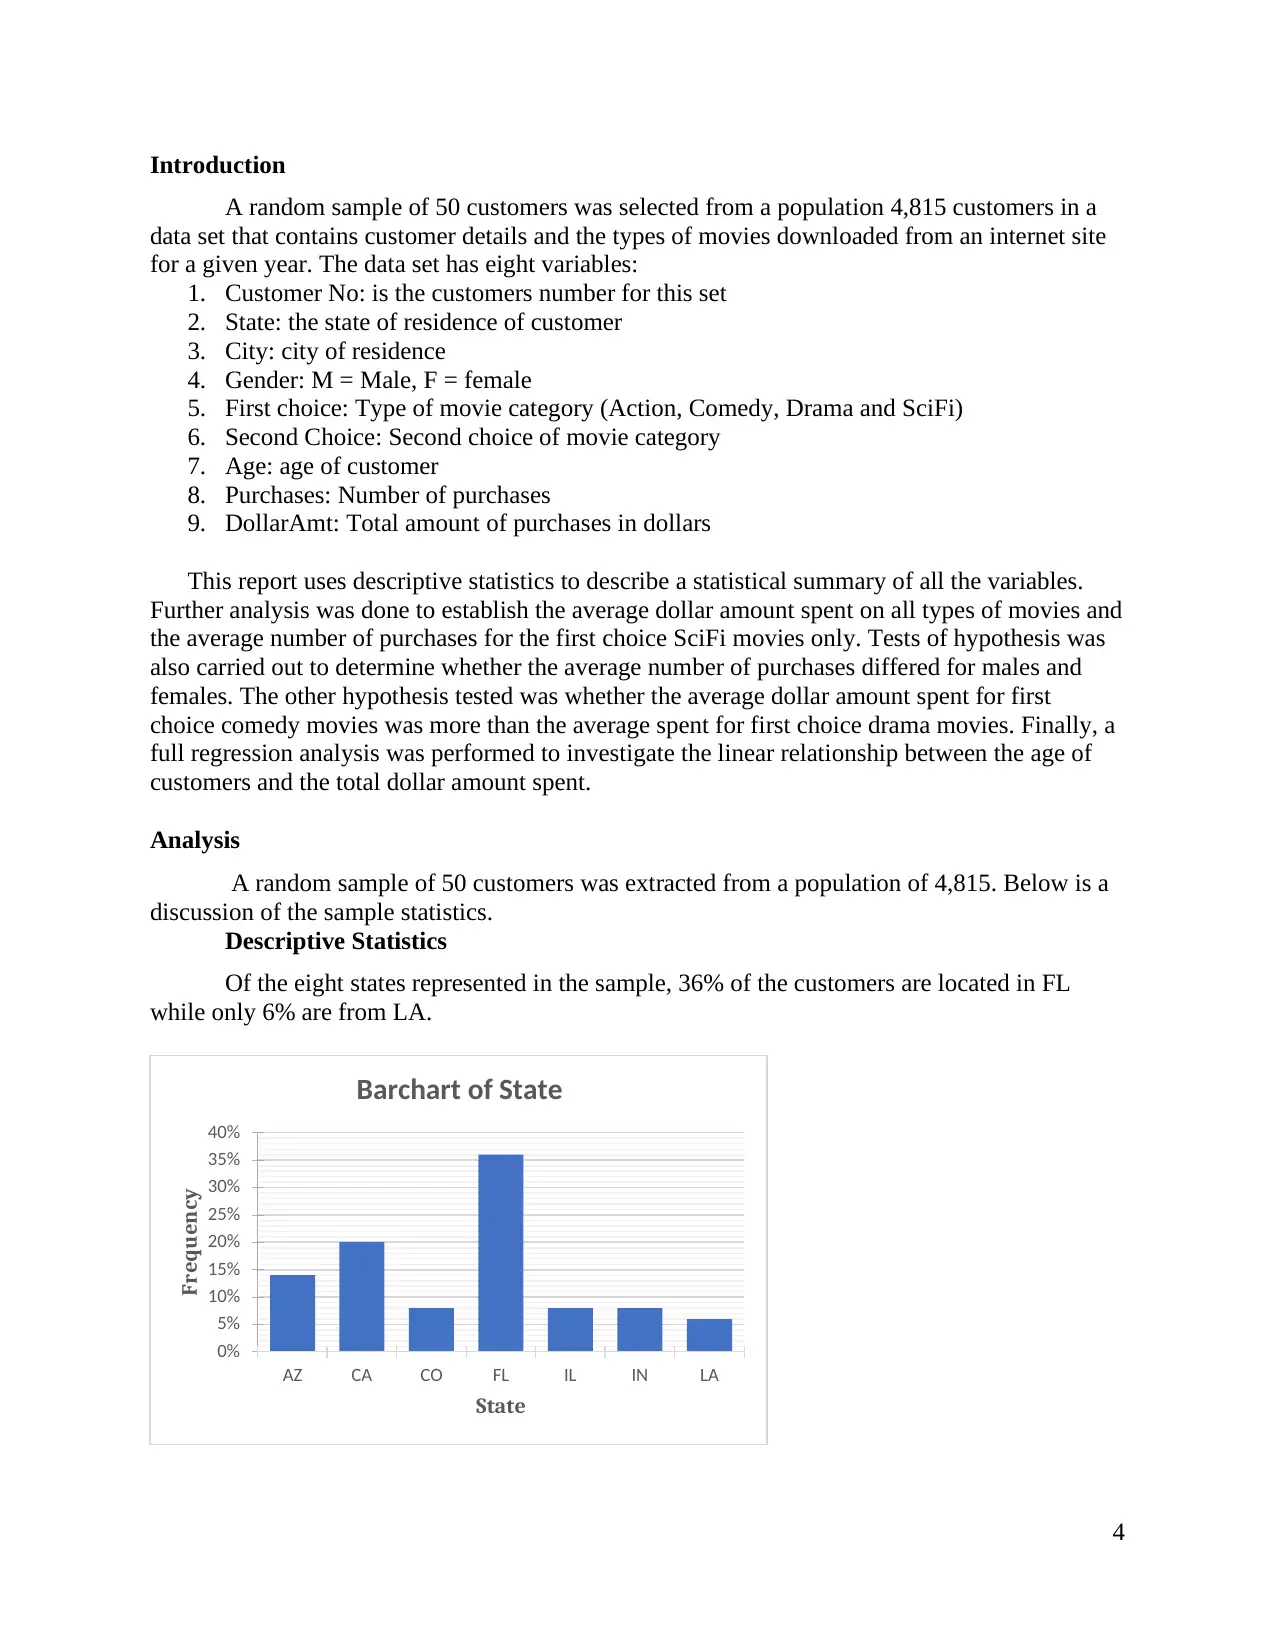
Descriptive Statistics
Of the eight states represented in the sample, 36% of the customers are located in FL
while only 6% are from LA.
0%
5%
10%
15%
20%
25%
30%
35%
40%
AZ CA CO FL IL IN LA
Frequency
State
Barchart of State
Introduction
A random sample of 50 customers was selected from a population 4,815 customers in a
data set that contains customer details and the types of movies downloaded from an internet site
for a given year. The data set has eight variables:
1. Customer No: is the customers number for this set
2. State: the state of residence of customer
3. City: city of residence
4. Gender: M = Male, F = female
5. First choice: Type of movie category (Action, Comedy, Drama and SciFi)
6. Second Choice: Second choice of movie category
7. Age: age of customer
8. Purchases: Number of purchases
9. DollarAmt: Total amount of purchases in dollars
This report uses descriptive statistics to describe a statistical summary of all the variables.
Further analysis was done to establish the average dollar amount spent on all types of movies and
the average number of purchases for the first choice SciFi movies only. Tests of hypothesis was
also carried out to determine whether the average number of purchases differed for males and
females. The other hypothesis tested was whether the average dollar amount spent for first
choice comedy movies was more than the average spent for first choice drama movies. Finally, a
full regression analysis was performed to investigate the linear relationship between the age of
customers and the total dollar amount spent.
Analysis
A random sample of 50 customers was extracted from a population of 4,815. Below is a
discussion of the sample statistics.
Descriptive Statistics
Of the eight states represented in the sample, 36% of the customers are located in FL
while only 6% are from LA.
0%
5%
10%
15%
20%
25%
30%
35%
40%
AZ CA CO FL IL IN LA
Frequency
State
Barchart of State
Secure Best Marks with AI Grader
Need help grading? Try our AI Grader for instant feedback on your assignments.
5
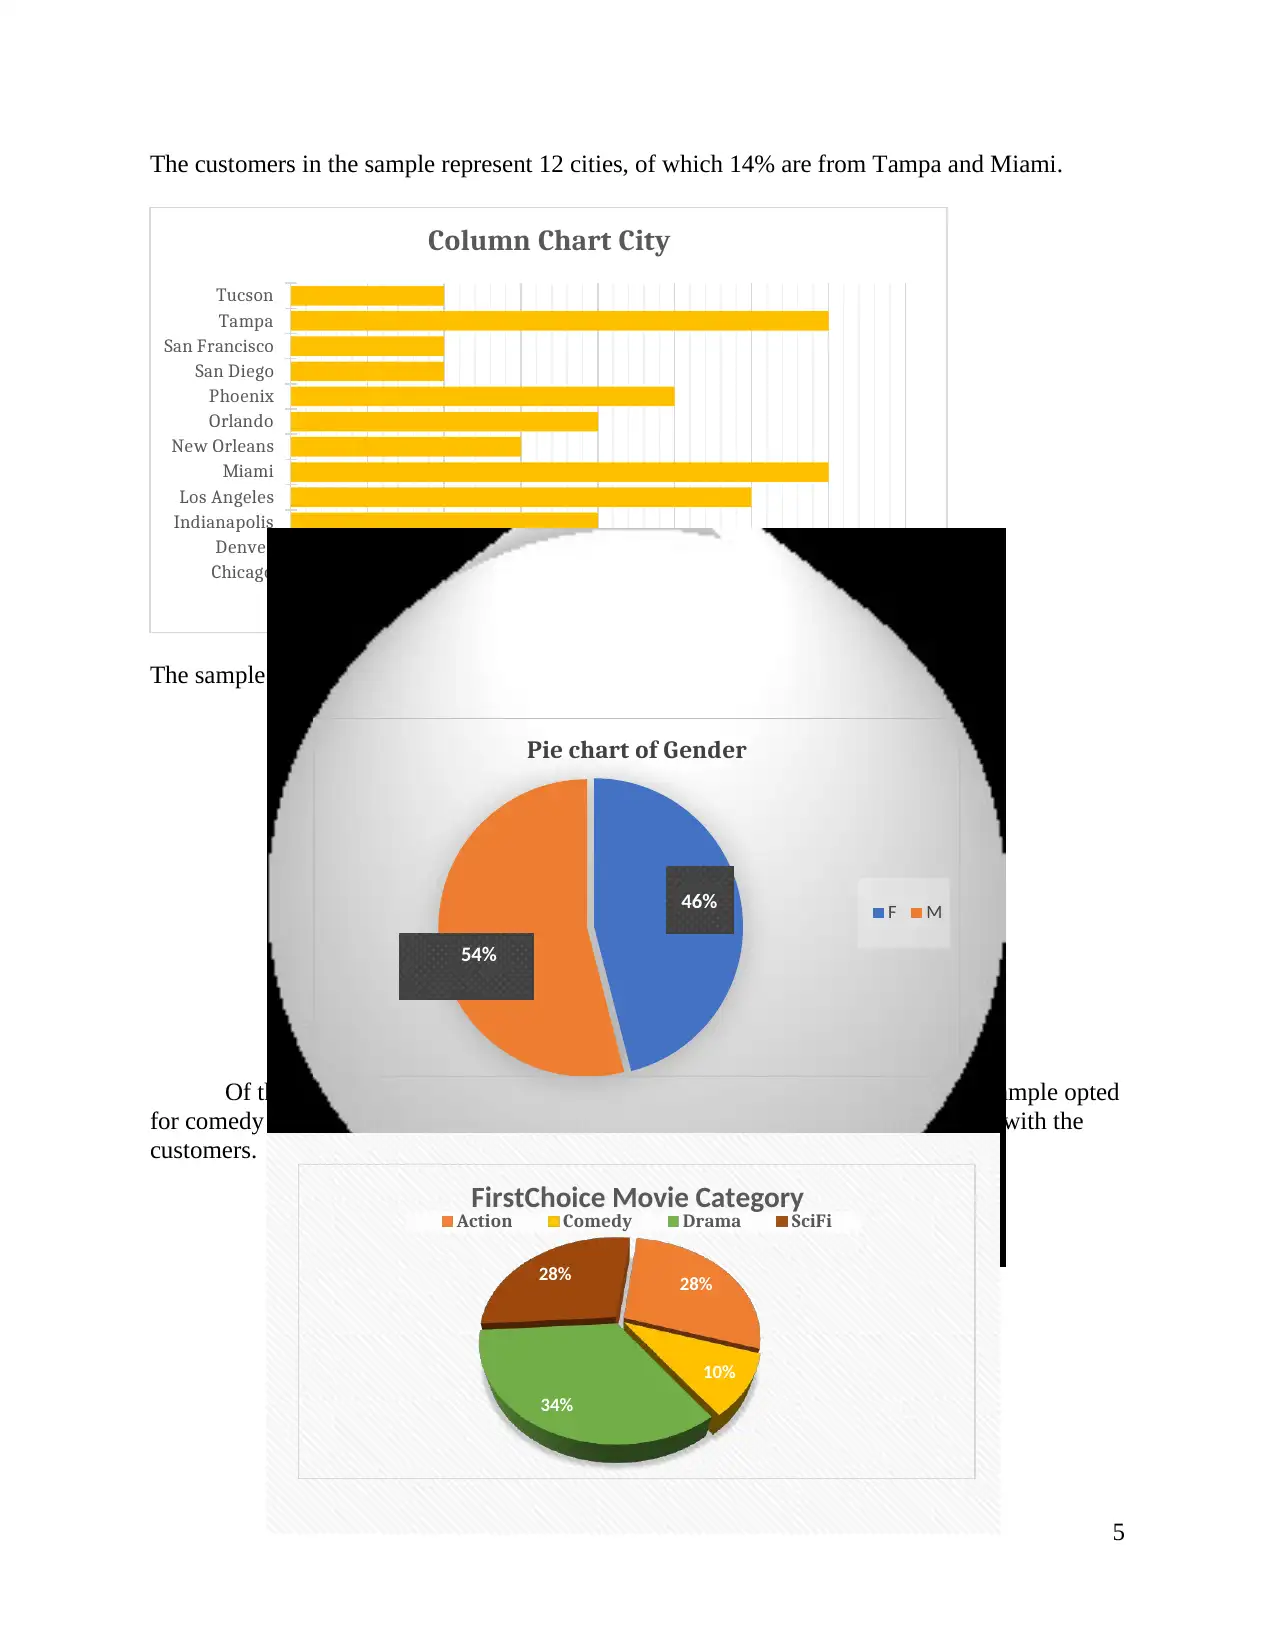
The customers in the sample represent 12 cities, of which 14% are from Tampa and Miami.
The sample of 50 customers was made up of 54% men and 46% women.
Of the four movie categories available, only 10% of the 50 customers in the sample opted
for comedy movies as their first choice. Action and SciFi movies we equally popular with the
customers.
0% 2% 4% 6% 8% 10% 12% 14% 16%
Chicago
Denver
Indianapolis
Los Angeles
Miami
New Orleans
Orlando
Phoenix
San Diego
San Francisco
Tampa
Tucson
Column Chart City
46%
54%
Pie chart of Gender
F M
28%
10%
34%
28%
FirstChoice Movie Category
Action Comedy Drama SciFi
6
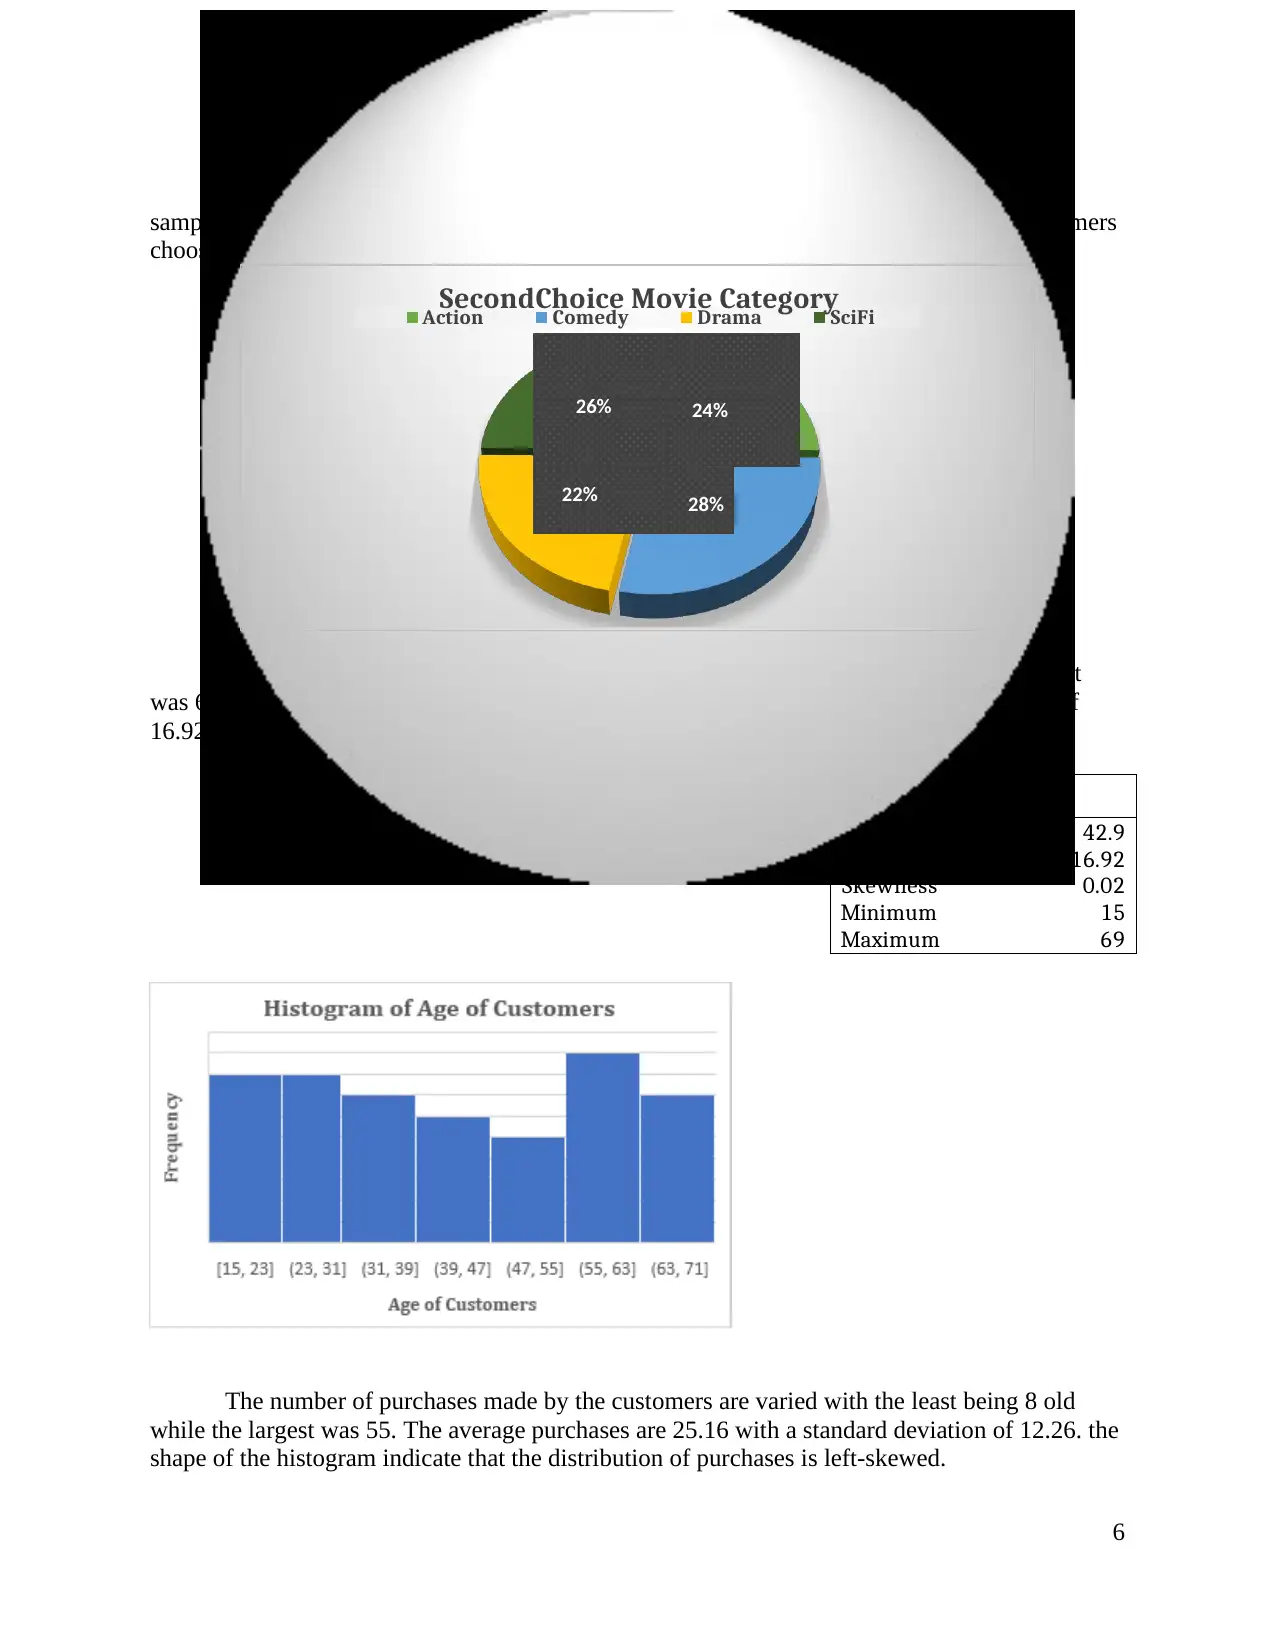
For their second choice, the four movie categories were relatively popular with the
sample’s customers, with Comedy having a larger proportion at 28%. only 22% of the customers
choose Drama for their second choice.
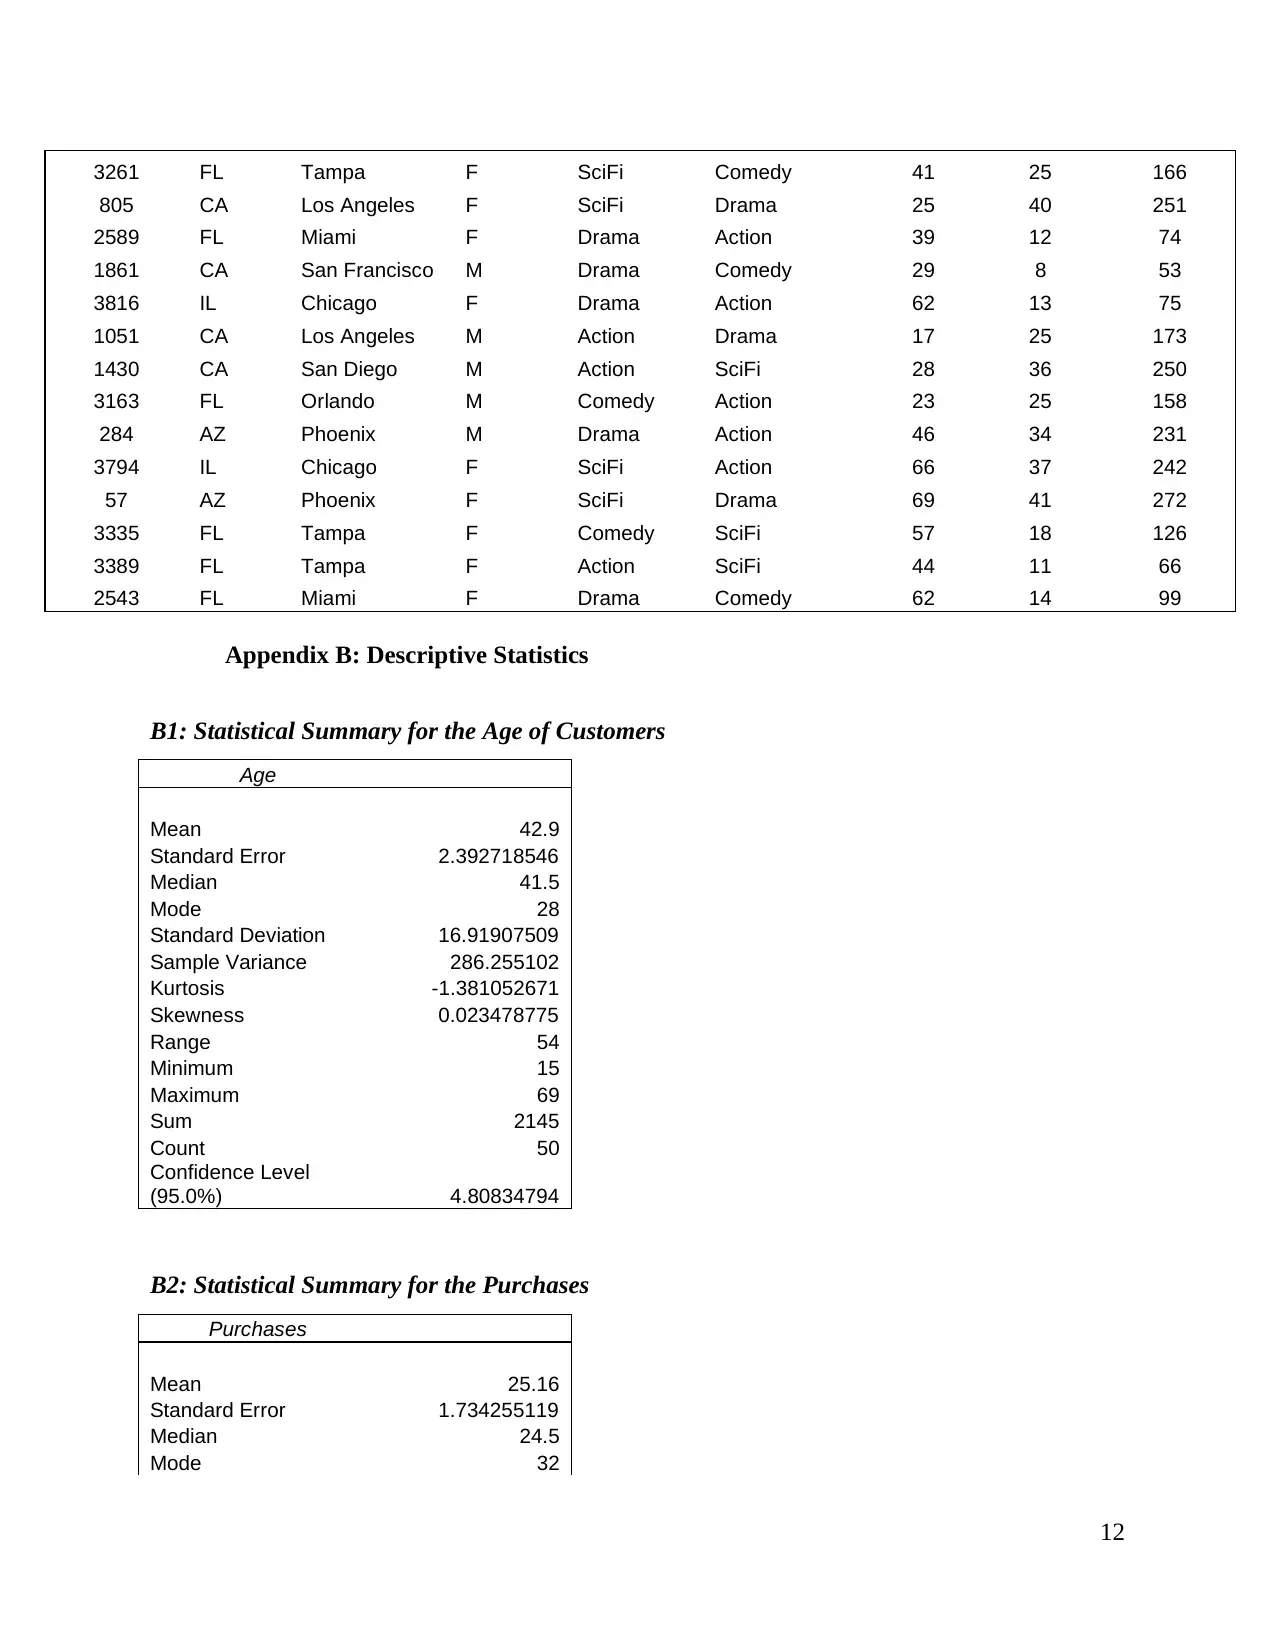
The age of the customers varied with the youngest being 15 years old while the oldest
was 69 years old. The average age of the customers is 42.9 years with a standard deviation of
16.92.
Age
Mean 42.9
Standard Deviation 16.92
Skewness 0.02
Minimum
Maximum
15
69
The number of purchases made by the customers are varied with the least being 8 old
while the largest was 55. The average purchases are 25.16 with a standard deviation of 12.26. the
shape of the histogram indicate that the distribution of purchases is left-skewed.
24%
28%
22%
26%
SecondChoice Movie Category
Action Comedy Drama SciFi
For their second choice, the four movie categories were relatively popular with the
sample’s customers, with Comedy having a larger proportion at 28%. only 22% of the customers
choose Drama for their second choice.
The age of the customers varied with the youngest being 15 years old while the oldest
was 69 years old. The average age of the customers is 42.9 years with a standard deviation of
16.92.
Age
Mean 42.9
Standard Deviation 16.92
Skewness 0.02
Minimum
Maximum
15
69
The number of purchases made by the customers are varied with the least being 8 old
while the largest was 55. The average purchases are 25.16 with a standard deviation of 12.26. the
shape of the histogram indicate that the distribution of purchases is left-skewed.
24%
28%
22%
26%
SecondChoice Movie Category
Action Comedy Drama SciFi
7
Purchases
Mean 25.16
Standard Deviation 12.26
Skewness 0.36
Range 47
Minimum 8
Maximum 55
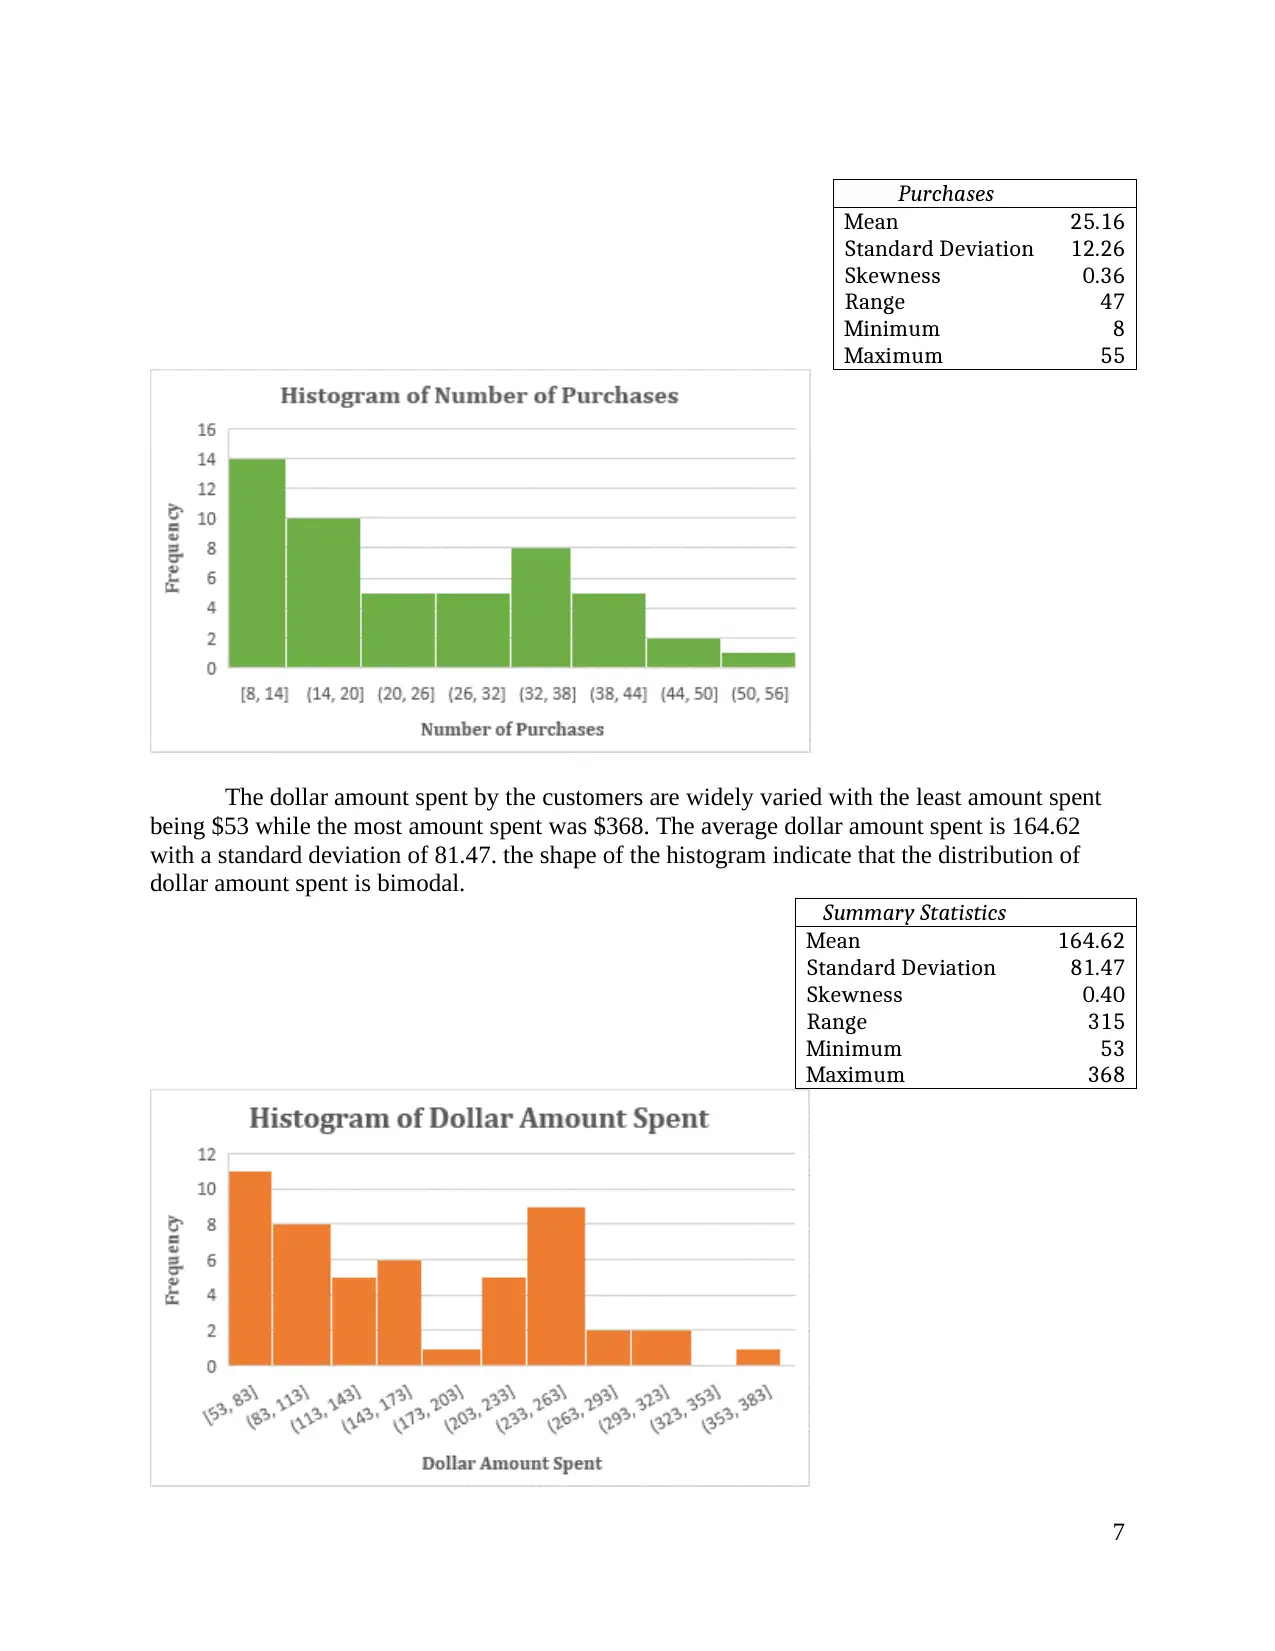
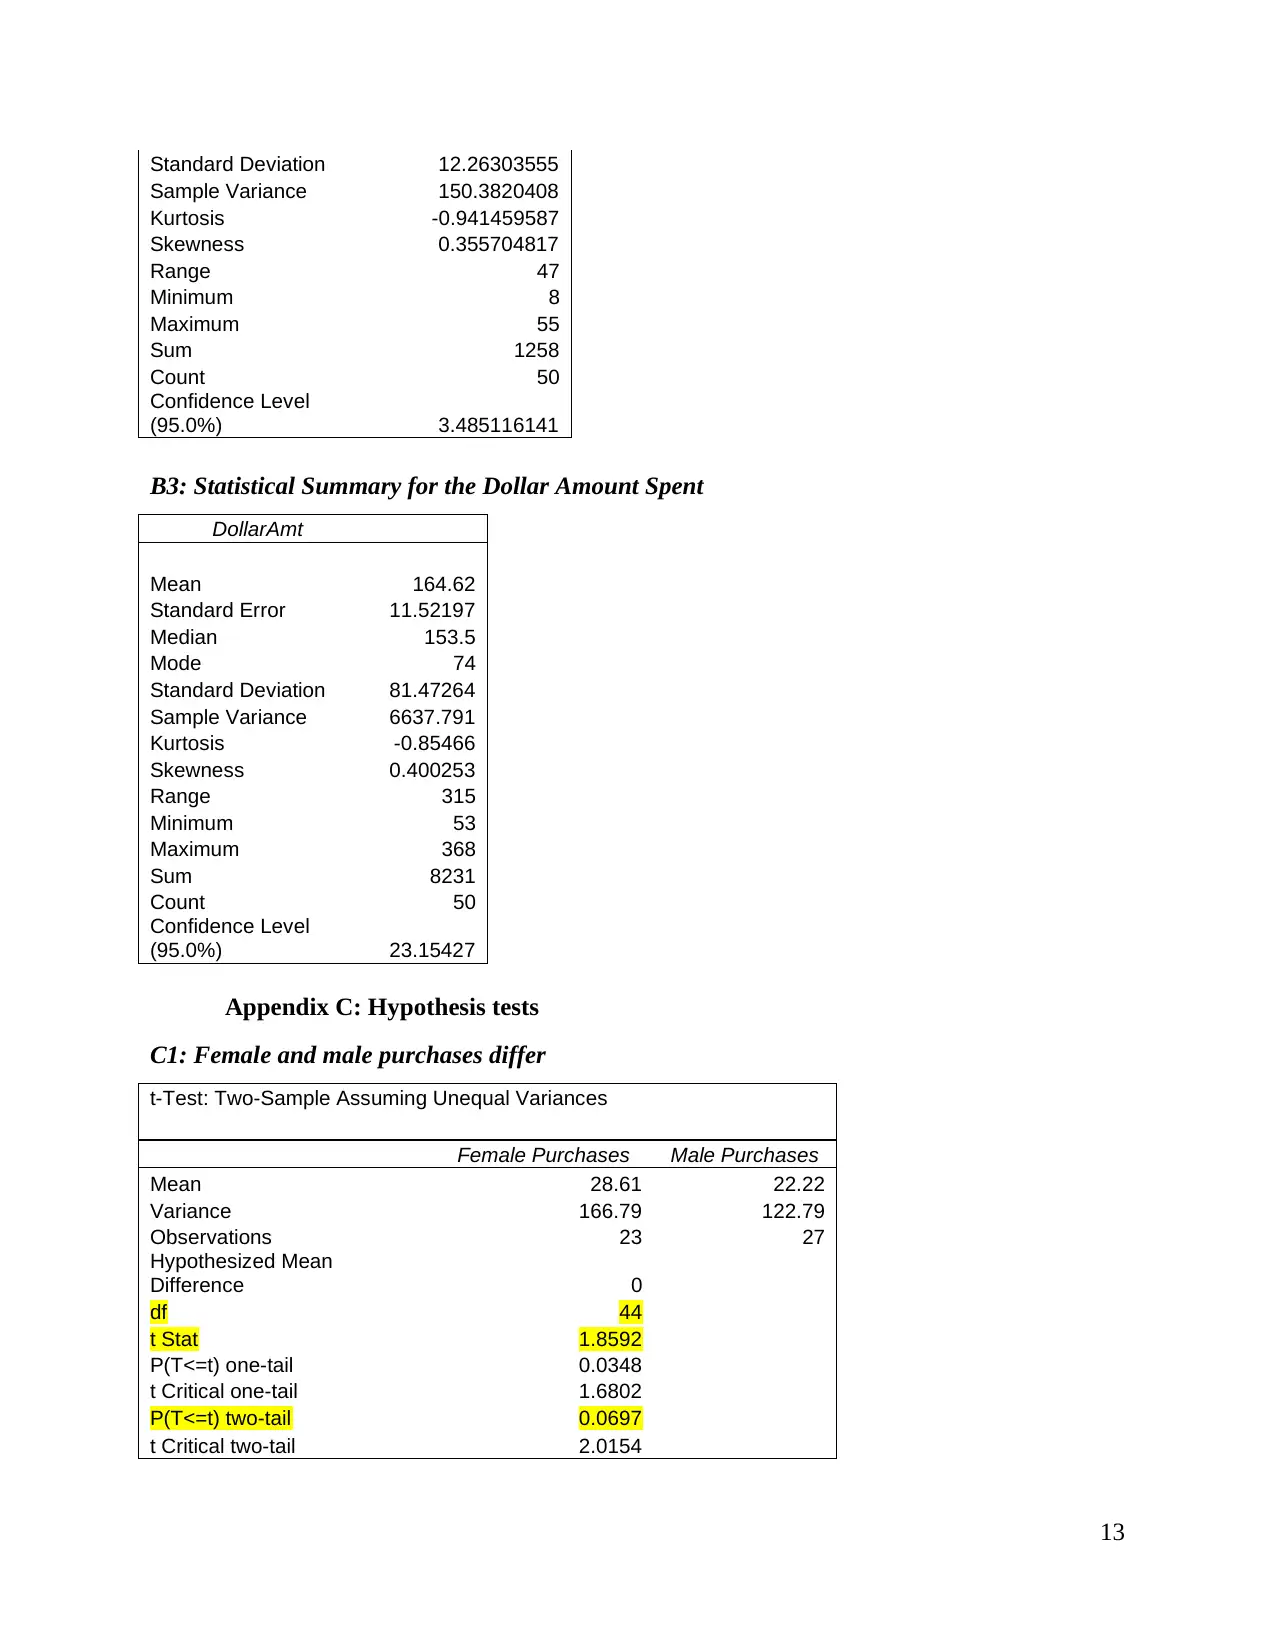
The dollar amount spent by the customers are widely varied with the least amount spent
being $53 while the most amount spent was $368. The average dollar amount spent is 164.62
with a standard deviation of 81.47. the shape of the histogram indicate that the distribution of
dollar amount spent is bimodal.
Summary Statistics
Mean 164.62
Standard Deviation 81.47
Skewness 0.40
Range 315
Minimum 53
Maximum 368
Purchases
Mean 25.16
Standard Deviation 12.26
Skewness 0.36
Range 47
Minimum 8
Maximum 55
The dollar amount spent by the customers are widely varied with the least amount spent
being $53 while the most amount spent was $368. The average dollar amount spent is 164.62
with a standard deviation of 81.47. the shape of the histogram indicate that the distribution of
dollar amount spent is bimodal.
Summary Statistics
Mean 164.62
Standard Deviation 81.47
Skewness 0.40
Range 315
Minimum 53
Maximum 368
Paraphrase This Document
Need a fresh take? Get an instant paraphrase of this document with our AI Paraphraser
8
Confidence intervals
The data analysis of this report is based on a sample of 50 customers. Therefore, it is
important that the statistics reported are comparable to the entire population to certain level of
confidence. The average dollar amount spent on all types of movies and the average number of
purchases (first choice SciFi movies only) were investigated and reported below.
We are 95% confident that the average number of purchases for first choice SciFi movies
only for the population lies between 28.20 and 39.94. The true population mean for purchases of
first choice SciFi movies was found to be 32.58, which lies within the 95% confidence interval
from the sample.
We are 95% confident that the average dollar amount spent for all types of movies is
likely between 141.47 and 187.77. This is the confidence interval using the sample mean dollar
amount spent for all types of movies. When we calculated the true population mean of dollar
spent for all types of movies, it was found to be 166.71 which lies between the 95% confidence
interval from the sample
Hypothesis Testing
There are several assumptions based on the dataset which will be verifies using
hypothesis test at a certain level of confidence. The first hypothesis made based on the data is
that the average amount spent (in $) for first choice Comedy is more than the average for first
choice Drama movies. The second assumption is that the average purchases, differs for males
and females. These hypotheses are tested at 5% significance level and reported below.
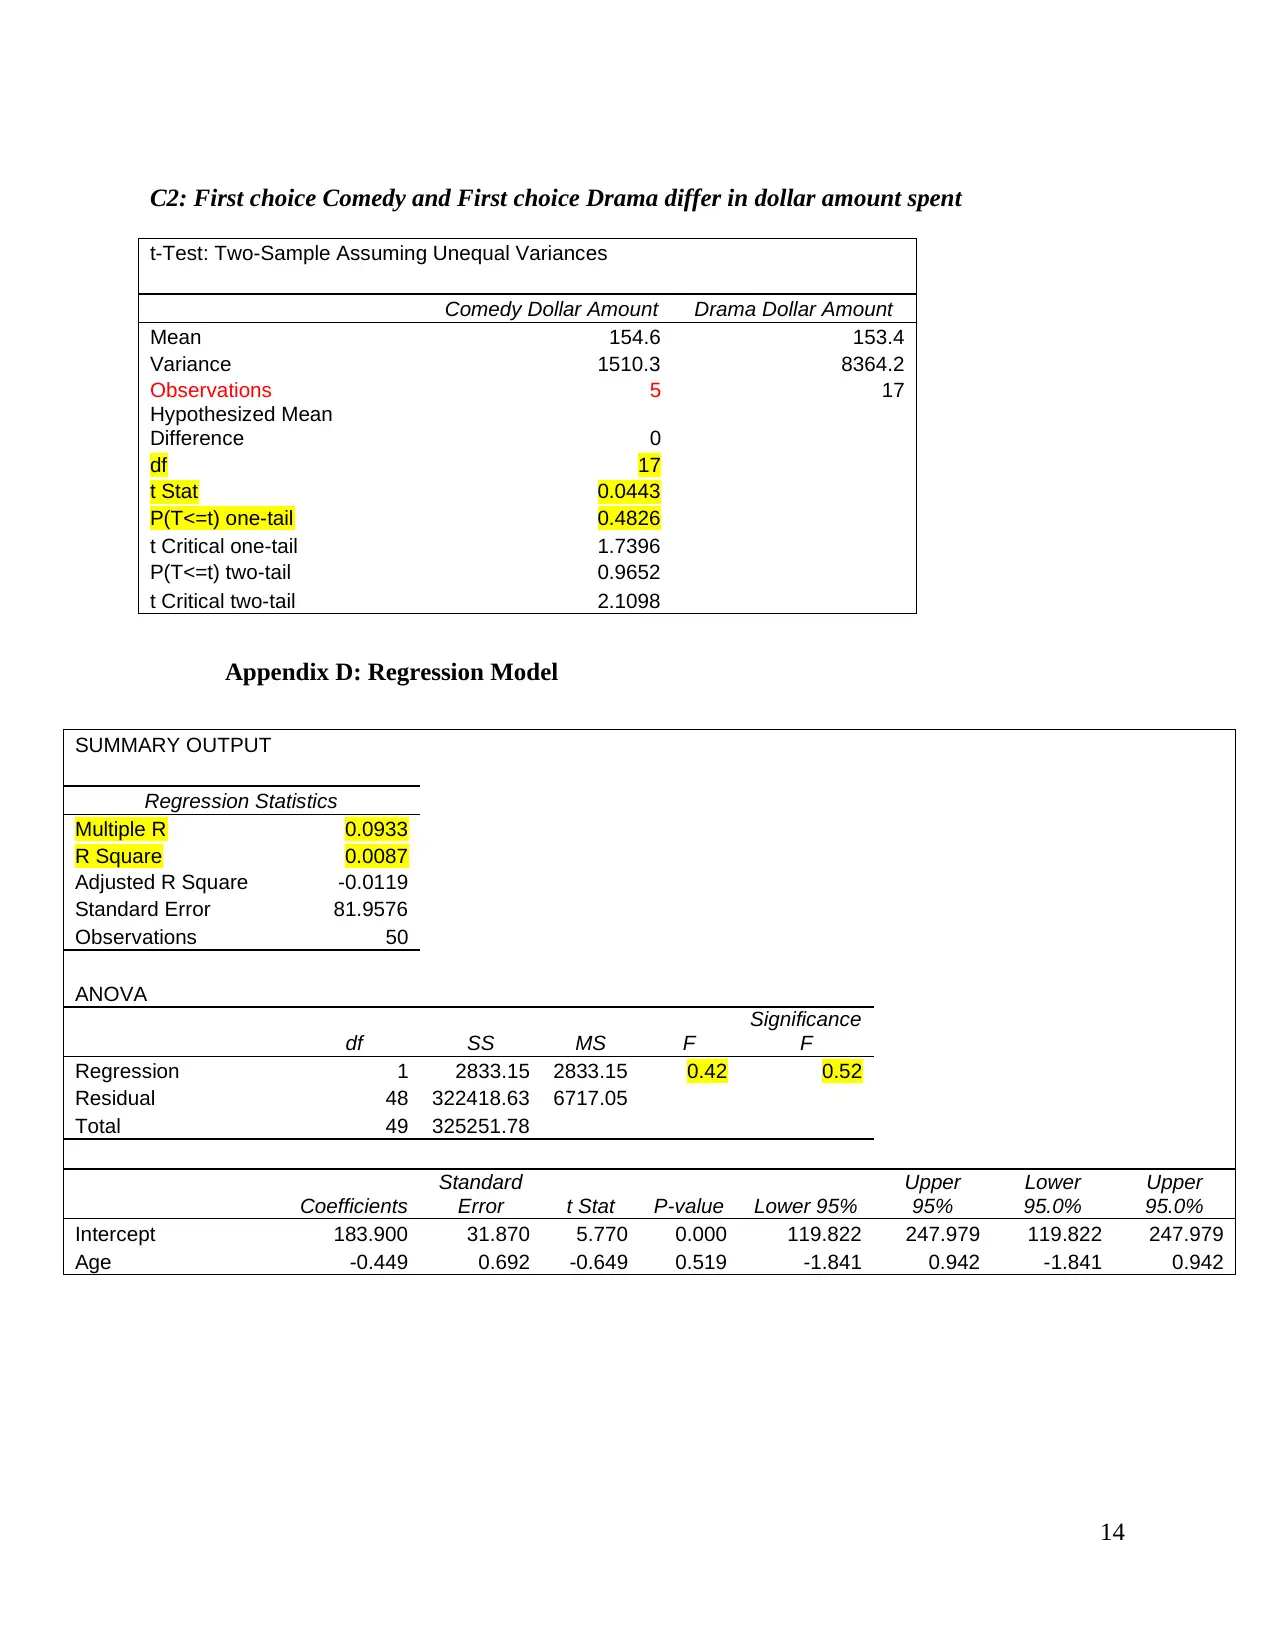
Hypothesis 1
The average dollar amount spent for first choice Comedy does not significantly differ
from the average dollar amount spent for first choice Drama movies. The t-score was used
because the population variance is unknown. The test statistics as computed by Excel was found
to be 0.0443, and the p-value = 0.4826 which is greater than the significance level of 0.05
Therefore, 0.05 level of significance, we conclude that there is no sufficient evidence to state that
he average dollar amount spent for first choice Comedy is more than the average dollar amount
spent for first choice Drama movies.
Hypothesis 2
The average purchases do not differ for males and females. The t-score was used because
the population variance is unknown. From the Excel output, the test statistic score was found to
be 1.8592, and the p-value = 0.0697. using the significance level of 5%, the p-value is larger than
0.05. therefore, we conclude that there is no sufficient evidence at 95% confidence level to state
that the average purchases differ for males and female.
Correlation and Regression
To determine whether a relationship exist between multiple quantitative variables, we use
correlation and regression analysis. This report investigates the relationship between the
Confidence intervals
The data analysis of this report is based on a sample of 50 customers. Therefore, it is
important that the statistics reported are comparable to the entire population to certain level of
confidence. The average dollar amount spent on all types of movies and the average number of
purchases (first choice SciFi movies only) were investigated and reported below.
We are 95% confident that the average number of purchases for first choice SciFi movies
only for the population lies between 28.20 and 39.94. The true population mean for purchases of
first choice SciFi movies was found to be 32.58, which lies within the 95% confidence interval
from the sample.
We are 95% confident that the average dollar amount spent for all types of movies is
likely between 141.47 and 187.77. This is the confidence interval using the sample mean dollar
amount spent for all types of movies. When we calculated the true population mean of dollar
spent for all types of movies, it was found to be 166.71 which lies between the 95% confidence
interval from the sample
Hypothesis Testing
There are several assumptions based on the dataset which will be verifies using
hypothesis test at a certain level of confidence. The first hypothesis made based on the data is
that the average amount spent (in $) for first choice Comedy is more than the average for first
choice Drama movies. The second assumption is that the average purchases, differs for males
and females. These hypotheses are tested at 5% significance level and reported below.
Hypothesis 1
The average dollar amount spent for first choice Comedy does not significantly differ
from the average dollar amount spent for first choice Drama movies. The t-score was used
because the population variance is unknown. The test statistics as computed by Excel was found
to be 0.0443, and the p-value = 0.4826 which is greater than the significance level of 0.05
Therefore, 0.05 level of significance, we conclude that there is no sufficient evidence to state that
he average dollar amount spent for first choice Comedy is more than the average dollar amount
spent for first choice Drama movies.
Hypothesis 2
The average purchases do not differ for males and females. The t-score was used because
the population variance is unknown. From the Excel output, the test statistic score was found to
be 1.8592, and the p-value = 0.0697. using the significance level of 5%, the p-value is larger than
0.05. therefore, we conclude that there is no sufficient evidence at 95% confidence level to state
that the average purchases differ for males and female.
Correlation and Regression
To determine whether a relationship exist between multiple quantitative variables, we use
correlation and regression analysis. This report investigates the relationship between the
9
customer’s age and the dollar amount spent and determine whether we can predict dollars spent
on movies from the age of the customer
Scatterplot
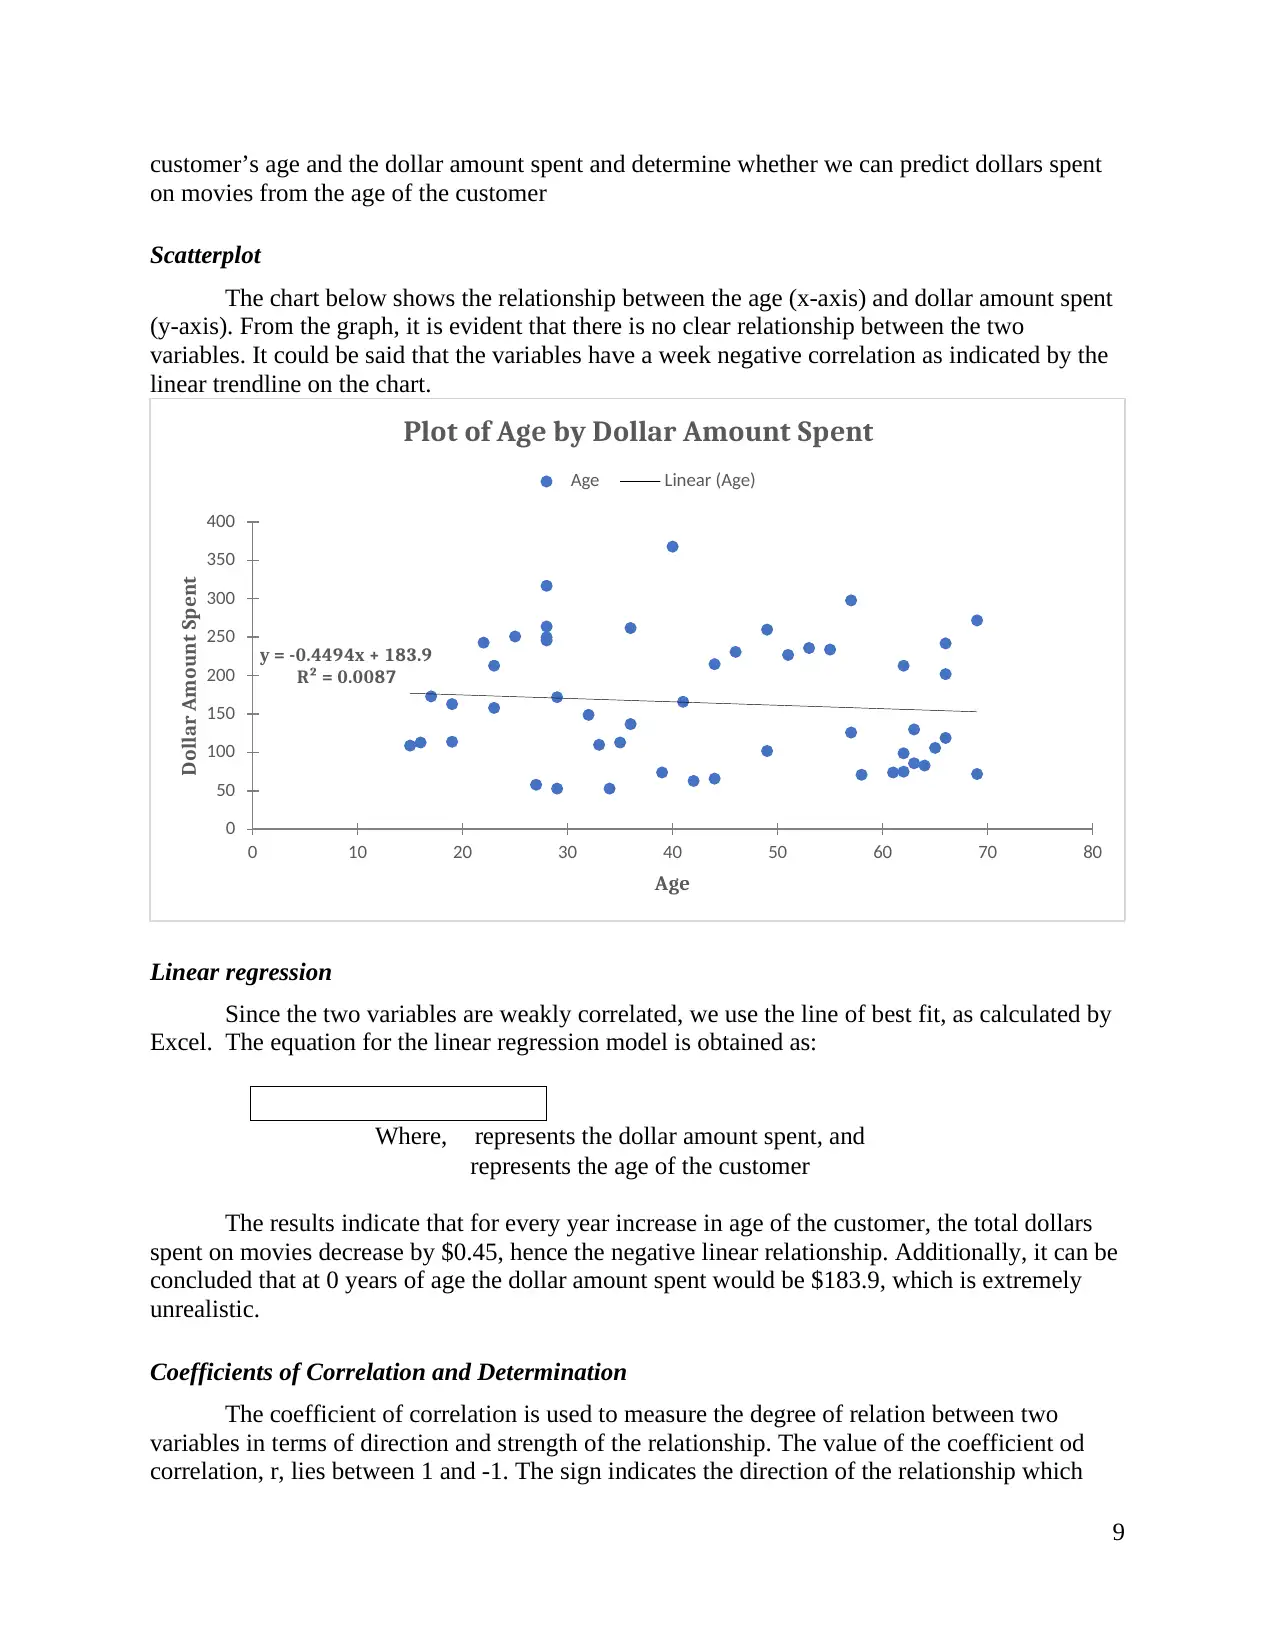
The chart below shows the relationship between the age (x-axis) and dollar amount spent
(y-axis). From the graph, it is evident that there is no clear relationship between the two
variables. It could be said that the variables have a week negative correlation as indicated by the
linear trendline on the chart.
Linear regression
Since the two variables are weakly correlated, we use the line of best fit, as calculated by
Excel. The equation for the linear regression model is obtained as:
Where, represents the dollar amount spent, and
represents the age of the customer
The results indicate that for every year increase in age of the customer, the total dollars
spent on movies decrease by $0.45, hence the negative linear relationship. Additionally, it can be
concluded that at 0 years of age the dollar amount spent would be $183.9, which is extremely
unrealistic.
Coefficients of Correlation and Determination
The coefficient of correlation is used to measure the degree of relation between two
variables in terms of direction and strength of the relationship. The value of the coefficient od
correlation, r, lies between 1 and -1. The sign indicates the direction of the relationship which
y = -0.4494x + 183.9
R² = 0.0087
0
50
100
150
200
250
300
350
400
0 10 20 30 40 50 60 70 80
Dollar Amount Spent
Age
Plot of Age by Dollar Amount Spent
Age Linear (Age)
customer’s age and the dollar amount spent and determine whether we can predict dollars spent
on movies from the age of the customer
Scatterplot
The chart below shows the relationship between the age (x-axis) and dollar amount spent
(y-axis). From the graph, it is evident that there is no clear relationship between the two
variables. It could be said that the variables have a week negative correlation as indicated by the
linear trendline on the chart.
Linear regression
Since the two variables are weakly correlated, we use the line of best fit, as calculated by
Excel. The equation for the linear regression model is obtained as:
Where, represents the dollar amount spent, and
represents the age of the customer
The results indicate that for every year increase in age of the customer, the total dollars
spent on movies decrease by $0.45, hence the negative linear relationship. Additionally, it can be
concluded that at 0 years of age the dollar amount spent would be $183.9, which is extremely
unrealistic.
Coefficients of Correlation and Determination
The coefficient of correlation is used to measure the degree of relation between two
variables in terms of direction and strength of the relationship. The value of the coefficient od
correlation, r, lies between 1 and -1. The sign indicates the direction of the relationship which
y = -0.4494x + 183.9
R² = 0.0087
0
50
100
150
200
250
300
350
400
0 10 20 30 40 50 60 70 80
Dollar Amount Spent
Age
Plot of Age by Dollar Amount Spent
Age Linear (Age)
10
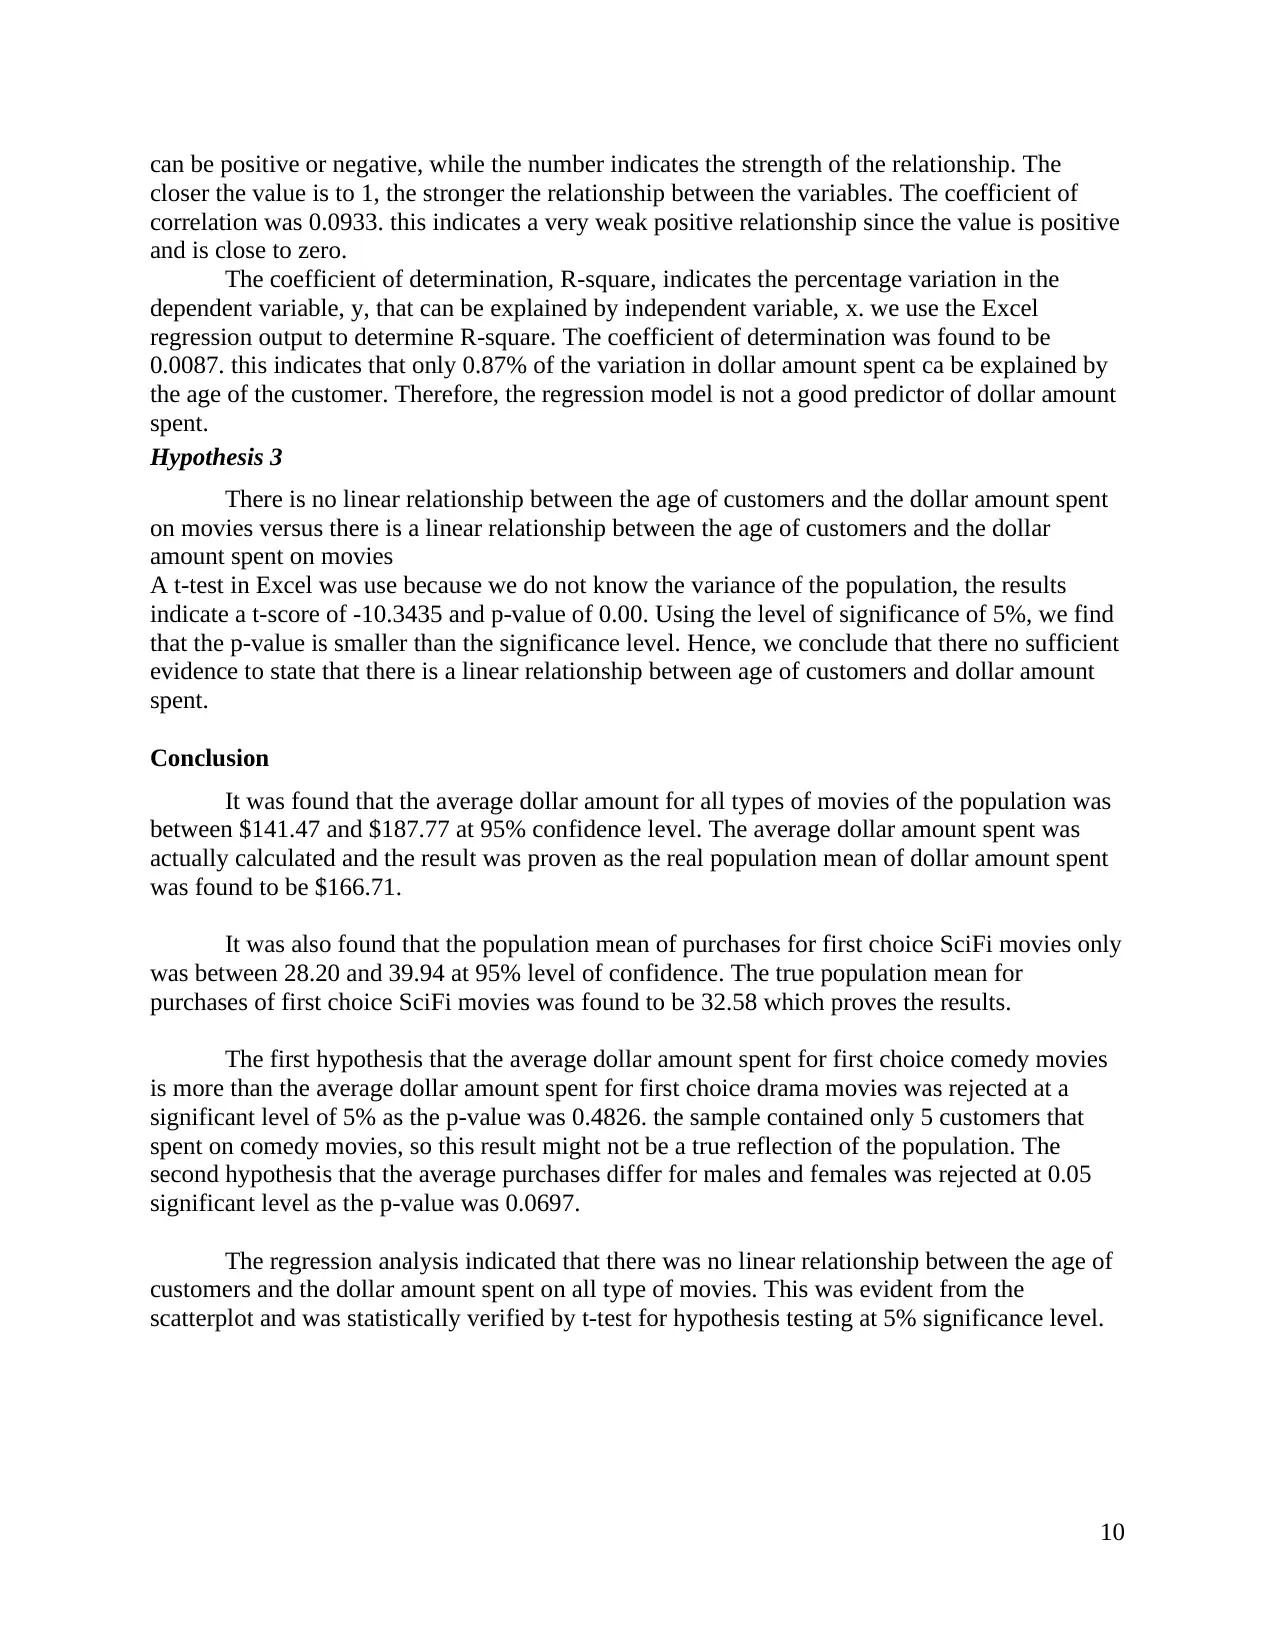
can be positive or negative, while the number indicates the strength of the relationship. The
closer the value is to 1, the stronger the relationship between the variables. The coefficient of
correlation was 0.0933. this indicates a very weak positive relationship since the value is positive
and is close to zero.
The coefficient of determination, R-square, indicates the percentage variation in the
dependent variable, y, that can be explained by independent variable, x. we use the Excel
regression output to determine R-square. The coefficient of determination was found to be
0.0087. this indicates that only 0.87% of the variation in dollar amount spent ca be explained by
the age of the customer. Therefore, the regression model is not a good predictor of dollar amount
spent.
Hypothesis 3
There is no linear relationship between the age of customers and the dollar amount spent
on movies versus there is a linear relationship between the age of customers and the dollar
amount spent on movies
A t-test in Excel was use because we do not know the variance of the population, the results
indicate a t-score of -10.3435 and p-value of 0.00. Using the level of significance of 5%, we find
that the p-value is smaller than the significance level. Hence, we conclude that there no sufficient
evidence to state that there is a linear relationship between age of customers and dollar amount
spent.
Conclusion
It was found that the average dollar amount for all types of movies of the population was
between $141.47 and $187.77 at 95% confidence level. The average dollar amount spent was
actually calculated and the result was proven as the real population mean of dollar amount spent
was found to be $166.71.
It was also found that the population mean of purchases for first choice SciFi movies only
was between 28.20 and 39.94 at 95% level of confidence. The true population mean for
purchases of first choice SciFi movies was found to be 32.58 which proves the results.
The first hypothesis that the average dollar amount spent for first choice comedy movies
is more than the average dollar amount spent for first choice drama movies was rejected at a
significant level of 5% as the p-value was 0.4826. the sample contained only 5 customers that
spent on comedy movies, so this result might not be a true reflection of the population. The
second hypothesis that the average purchases differ for males and females was rejected at 0.05
significant level as the p-value was 0.0697.
The regression analysis indicated that there was no linear relationship between the age of
customers and the dollar amount spent on all type of movies. This was evident from the
scatterplot and was statistically verified by t-test for hypothesis testing at 5% significance level.
Secure Best Marks with AI Grader
Need help grading? Try our AI Grader for instant feedback on your assignments.
11
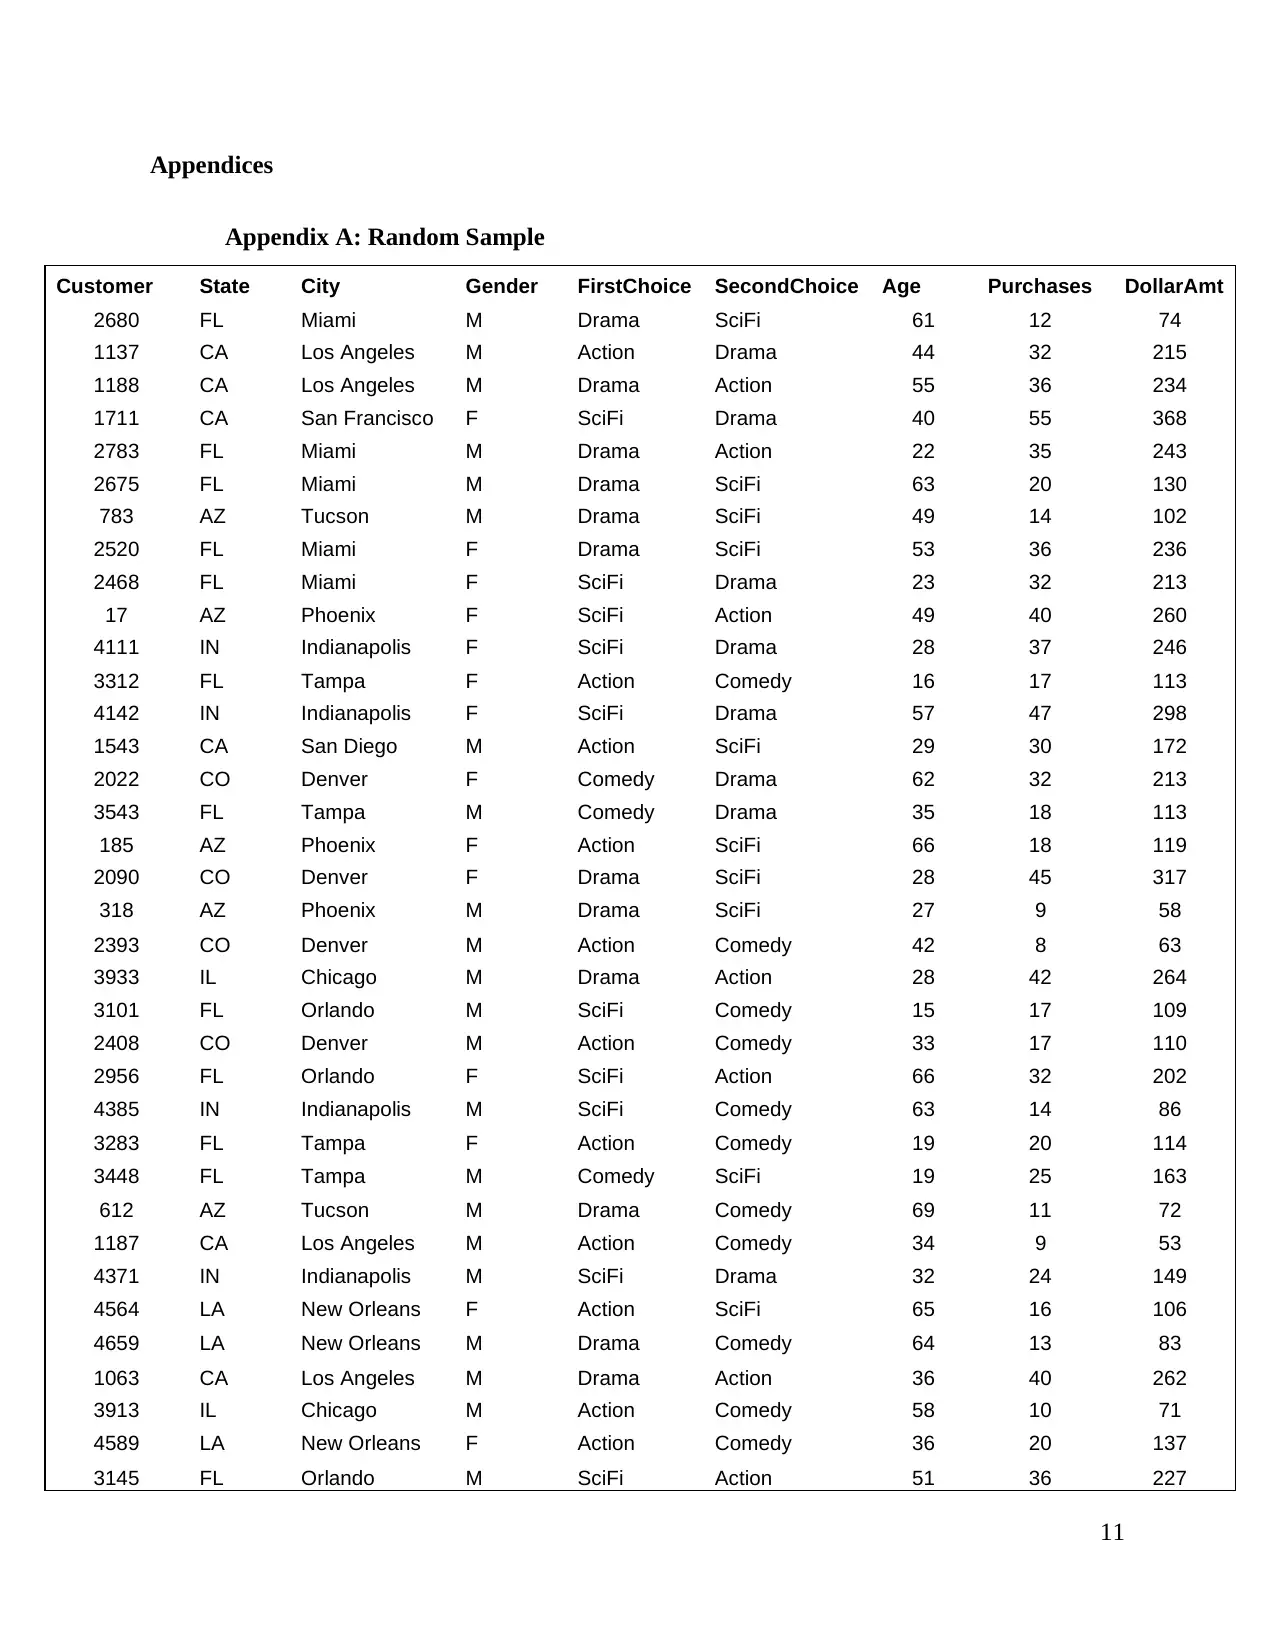
Appendices
Appendix A: Random Sample
Customer State City Gender FirstChoice SecondChoice Age Purchases DollarAmt
2680 FL Miami M Drama SciFi 61 12 74
1137 CA Los Angeles M Action Drama 44 32 215
1188 CA Los Angeles M Drama Action 55 36 234
1711 CA San Francisco F SciFi Drama 40 55 368
2783 FL Miami M Drama Action 22 35 243
2675 FL Miami M Drama SciFi 63 20 130
783 AZ Tucson M Drama SciFi 49 14 102
2520 FL Miami F Drama SciFi 53 36 236
2468 FL Miami F SciFi Drama 23 32 213
17 AZ Phoenix F SciFi Action 49 40 260
4111 IN Indianapolis F SciFi Drama 28 37 246
3312 FL Tampa F Action Comedy 16 17 113
4142 IN Indianapolis F SciFi Drama 57 47 298
1543 CA San Diego M Action SciFi 29 30 172
2022 CO Denver F Comedy Drama 62 32 213
3543 FL Tampa M Comedy Drama 35 18 113
185 AZ Phoenix F Action SciFi 66 18 119
2090 CO Denver F Drama SciFi 28 45 317
318 AZ Phoenix M Drama SciFi 27 9 58
2393 CO Denver M Action Comedy 42 8 63
3933 IL Chicago M Drama Action 28 42 264
3101 FL Orlando M SciFi Comedy 15 17 109
2408 CO Denver M Action Comedy 33 17 110
2956 FL Orlando F SciFi Action 66 32 202
4385 IN Indianapolis M SciFi Comedy 63 14 86
3283 FL Tampa F Action Comedy 19 20 114
3448 FL Tampa M Comedy SciFi 19 25 163
612 AZ Tucson M Drama Comedy 69 11 72
1187 CA Los Angeles M Action Comedy 34 9 53
4371 IN Indianapolis M SciFi Drama 32 24 149
4564 LA New Orleans F Action SciFi 65 16 106
4659 LA New Orleans M Drama Comedy 64 13 83
1063 CA Los Angeles M Drama Action 36 40 262
3913 IL Chicago M Action Comedy 58 10 71
4589 LA New Orleans F Action Comedy 36 20 137
3145 FL Orlando M SciFi Action 51 36 227
12
3261 FL Tampa F SciFi Comedy 41 25 166
805 CA Los Angeles F SciFi Drama 25 40 251
2589 FL Miami F Drama Action 39 12 74
1861 CA San Francisco M Drama Comedy 29 8 53
3816 IL Chicago F Drama Action 62 13 75
1051 CA Los Angeles M Action Drama 17 25 173
1430 CA San Diego M Action SciFi 28 36 250
3163 FL Orlando M Comedy Action 23 25 158
284 AZ Phoenix M Drama Action 46 34 231
3794 IL Chicago F SciFi Action 66 37 242
57 AZ Phoenix F SciFi Drama 69 41 272
3335 FL Tampa F Comedy SciFi 57 18 126
3389 FL Tampa F Action SciFi 44 11 66
2543 FL Miami F Drama Comedy 62 14 99
Appendix B: Descriptive Statistics
B1: Statistical Summary for the Age of Customers
Age
Mean 42.9
Standard Error 2.392718546
Median 41.5
Mode 28
Standard Deviation 16.91907509
Sample Variance 286.255102
Kurtosis -1.381052671
Skewness 0.023478775
Range 54
Minimum 15
Maximum 69
Sum 2145
Count 50
Confidence Level
(95.0%) 4.80834794
B2: Statistical Summary for the Purchases
Purchases
Mean 25.16
Standard Error 1.734255119
Median 24.5
Mode 32
13
Standard Deviation 12.26303555
Sample Variance 150.3820408
Kurtosis -0.941459587
Skewness 0.355704817
Range 47
Minimum 8
Maximum 55
Sum 1258
Count 50
Confidence Level
(95.0%) 3.485116141
B3: Statistical Summary for the Dollar Amount Spent
DollarAmt
Mean 164.62
Standard Error 11.52197
Median 153.5
Mode 74
Standard Deviation 81.47264
Sample Variance 6637.791
Kurtosis -0.85466
Skewness 0.400253
Range 315
Minimum 53
Maximum 368
Sum 8231
Count 50
Confidence Level
(95.0%) 23.15427
Appendix C: Hypothesis tests
C1: Female and male purchases differ
t-Test: Two-Sample Assuming Unequal Variances
Female Purchases Male Purchases
Mean 28.61 22.22
Variance 166.79 122.79
Observations 23 27
Hypothesized Mean
Difference 0
df 44
t Stat 1.8592
P(T<=t) one-tail 0.0348
t Critical one-tail 1.6802
P(T<=t) two-tail 0.0697
t Critical two-tail 2.0154
Paraphrase This Document
Need a fresh take? Get an instant paraphrase of this document with our AI Paraphraser
14
C2: First choice Comedy and First choice Drama differ in dollar amount spent
Appendix D: Regression Model
SUMMARY OUTPUT
Regression Statistics
Multiple R 0.0933
R Square 0.0087
Adjusted R Square -0.0119
Standard Error 81.9576
Observations 50
ANOVA
df SS MS F
Significance
F
Regression 1 2833.15 2833.15 0.42 0.52
Residual 48 322418.63 6717.05
Total 49 325251.78
Coefficients
Standard
Error t Stat P-value Lower 95%
Upper
95%
Lower
95.0%
Upper
95.0%
Intercept 183.900 31.870 5.770 0.000 119.822 247.979 119.822 247.979
Age -0.449 0.692 -0.649 0.519 -1.841 0.942 -1.841 0.942
t-Test: Two-Sample Assuming Unequal Variances
Comedy Dollar Amount Drama Dollar Amount
Mean 154.6 153.4
Variance 1510.3 8364.2
Observations 5 17
Hypothesized Mean
Difference 0
df 17
t Stat 0.0443
P(T<=t) one-tail 0.4826
t Critical one-tail 1.7396
P(T<=t) two-tail 0.9652
t Critical two-tail 2.1098
1 out of 14
Related Documents


Your All-in-One AI-Powered Toolkit for Academic Success.
+13062052269
info@desklib.com
Available 24*7 on WhatsApp / Email
![[object Object]](/_next/static/media/star-bottom.7253800d.svg)
Unlock your academic potential
© 2024 | Zucol Services PVT LTD | All rights reserved.