Quantitative Analysis for Marketing Management
VerifiedAdded on 2020/12/29
|34
|6028
|88
Report
AI Summary
This report analyzes IBM's IT industry customer benchmark survey data using quantitative methods. It examines customer satisfaction, brand perception, and purchase intent, providing insights into IBM's market position and potential areas for improvement. The report includes detailed analysis of survey data, graphs, and tables, offering valuable recommendations for IBM's marketing strategy.
Contribute Materials
Your contribution can guide someone’s learning journey. Share your
documents today.
Quantitative Analysis
for Marketing
Management
1
for Marketing
Management
1
Secure Best Marks with AI Grader
Need help grading? Try our AI Grader for instant feedback on your assignments.
Table of Contents
INTRODUCTION...........................................................................................................................3
Rational of recommendation:..........................................................................................................3
Graphs are prepared on the basis of given responses of respondents..............................................5
REFERENCES..............................................................................................................................19
APPENDICES...............................................................................................................................20
2
INTRODUCTION
Quantitative analysis is one of the effective research method that deal with evaluation of
the numerical values in the given variables. IBM is one of the top most producer of computer
hardware, software and services. As a leading digital networking company that is operating in
almost every market under which the company used to compete by making mainframe and
servers, storage systems and other peripherals devices. In order to maintain its overall position
within the highly competitive software company in the market they are planning to implement
latest technology so that more innovative products can be launched in the market. By increasing
popularity of latest software in the market some other organisation such as Microsoft and other
international companies are also trying provide tough competition (Crouch and Housden, 2012).
With the merging desktop and laptop, IBM has announced that it would also share their
technology and system to get maximum advantage from other companies. Therefore, IBM wants
to conduct a research-based analysis for decision maker in various role in other companies. For
this purpose, they have chosen a company to analyse and participant are planning to competes
with IBM. The research named the IT industry customer Benchmark would be repeated in every
year. In order to get better knowledge of the software this particular survey is essential as a
researcher.
The data is being collected from 1000 samples of buying managers from IT industries. For
example, to get instant satisfaction from IBM the outcomes would be more helpful in making
decision regarding whether emergence of two-software Company will be helpful in coming time.
The IBM company need to plan their resources according to their demand of customer about the
technology in the market. It would be further valuable to make decisions in the favour of the
company during the past coming years. The statistical evaluation of the consumer research
conduct by team indicates that customer of Software Company with considerable concerns in
regards to the features of latest software less often than in the recent past. This could pose a
threat to market share and growth of IBM which is having negative impacts on the consumer as
one of the crucial part of the company. Offering innovative and exciting feature option would
drive more chances of company visits by the skills consumer segment. It will comprise of light
and medium both types of clients. The above recommendation is depending upon the results of
regression analysis as well as descriptive data solution that show individual driven by their
motivation to use that particular product.
3
Rational of recommendation:
There are 1000 respondents taken in respect of IBM's target segment. The roles of
different persons are defined regarding managing the sections and the departments of IBM. The
research is basically done from as primary sources of data collection which would effectively
valuable for profitable business operation. IT decision maker, influencer and IT staff members
are consider creating the decision-making and principle for better analysis (Bellenger, Bernhardt
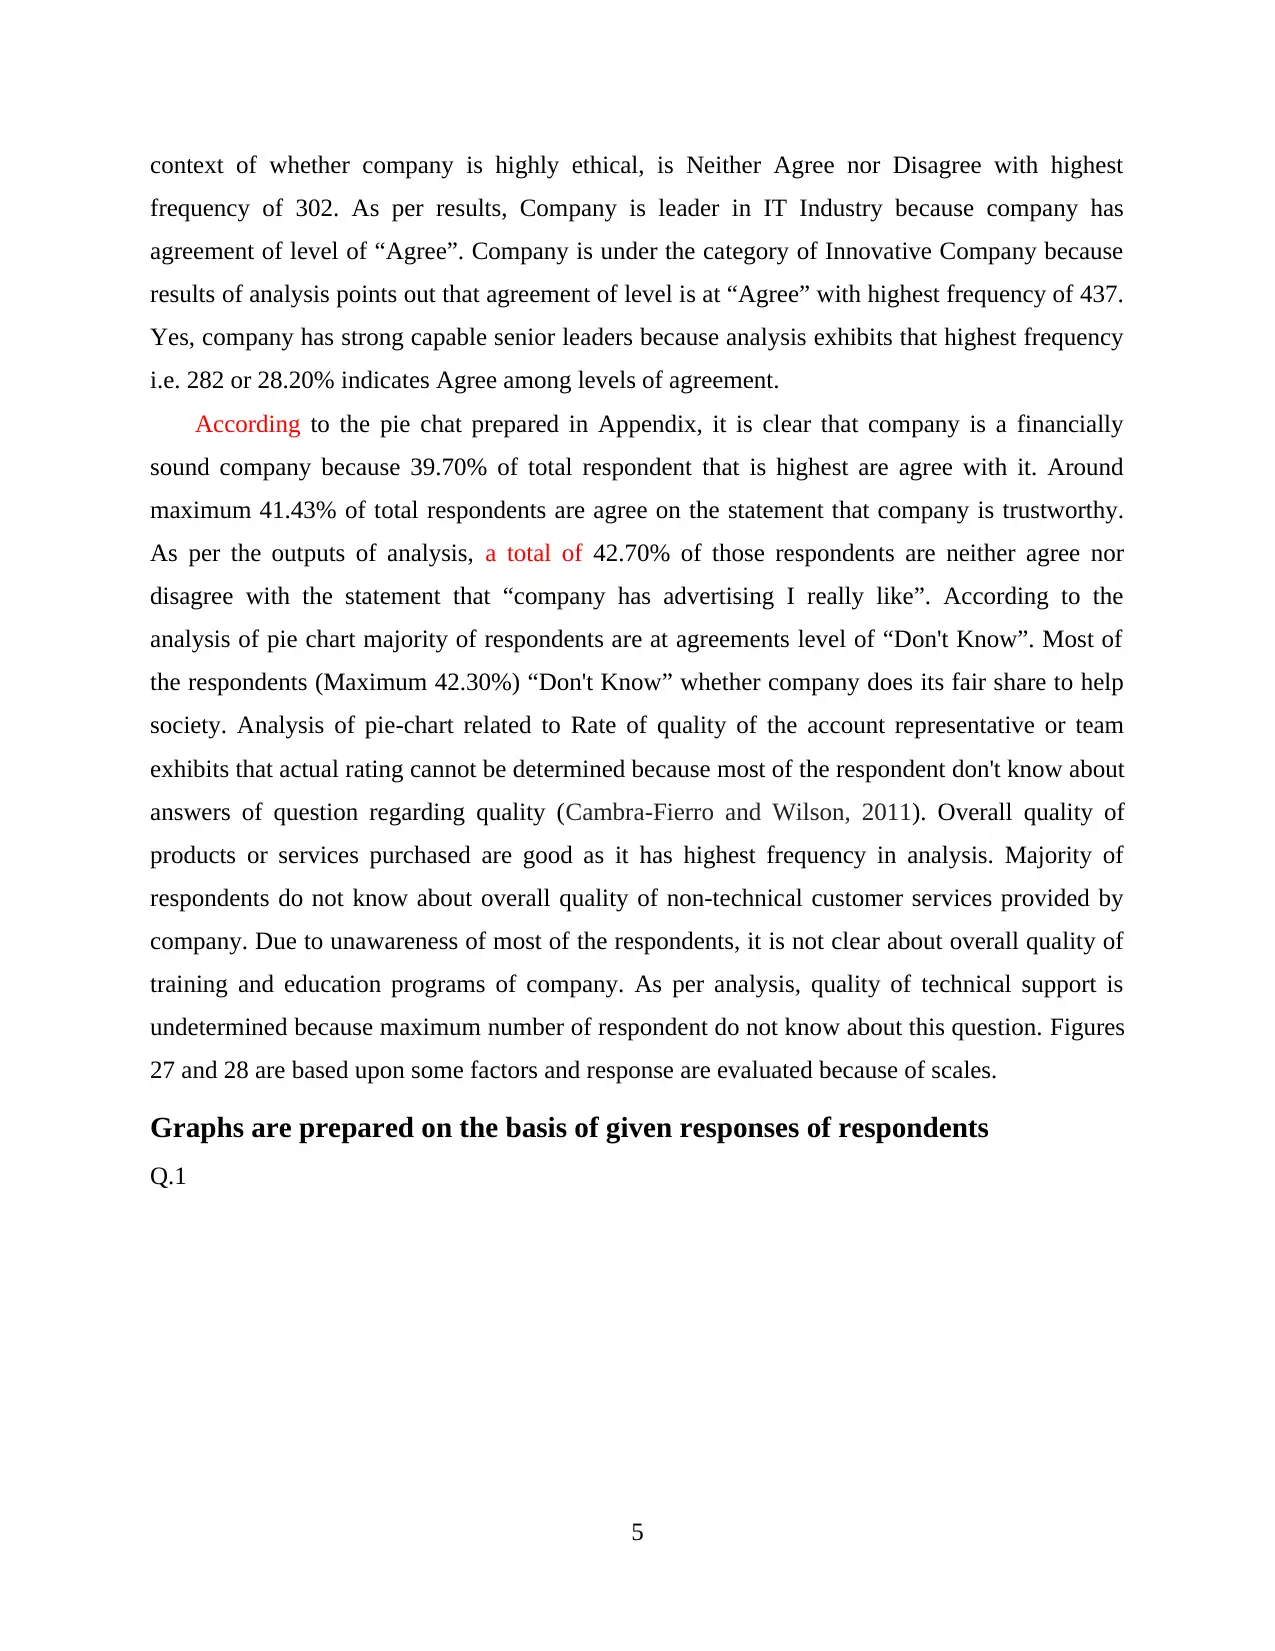
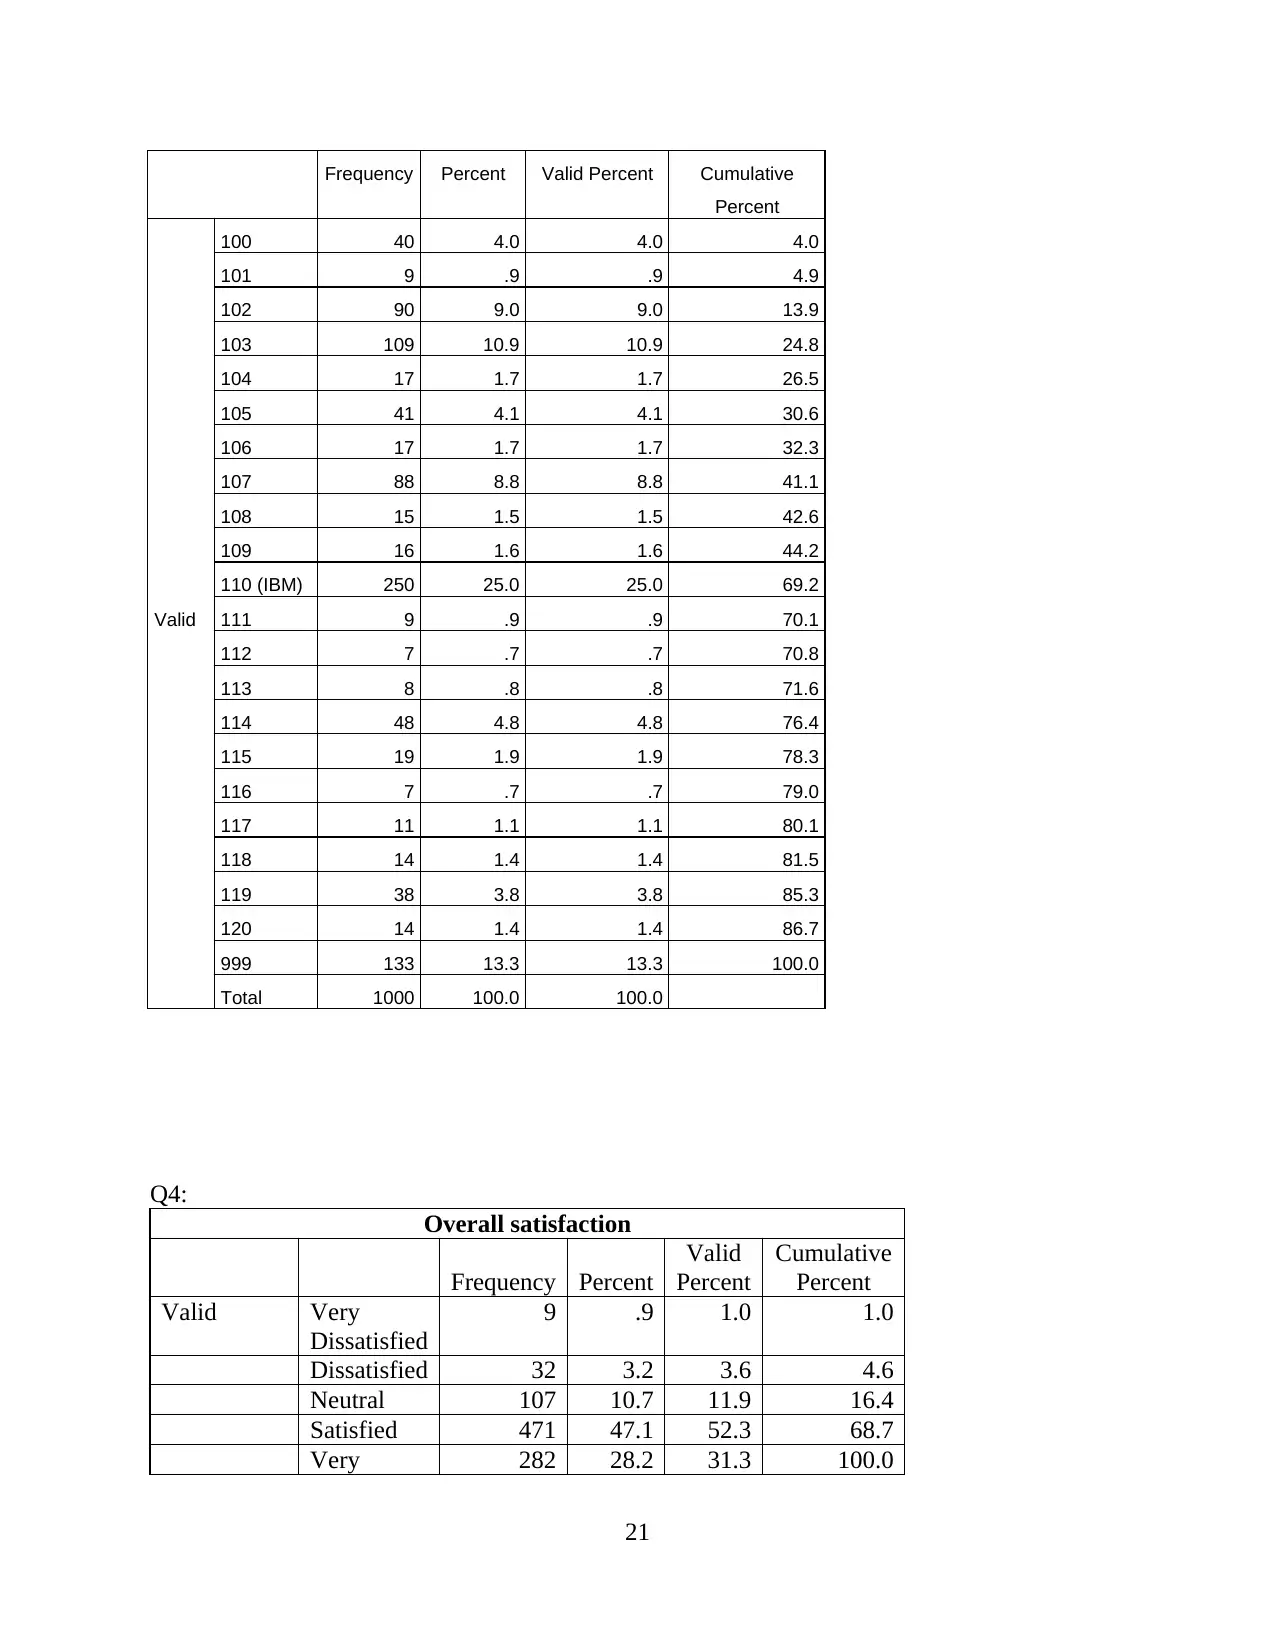
and Goldstucker, 2011). Best roles as per table Q1, IT staff role retain the valid percentage of
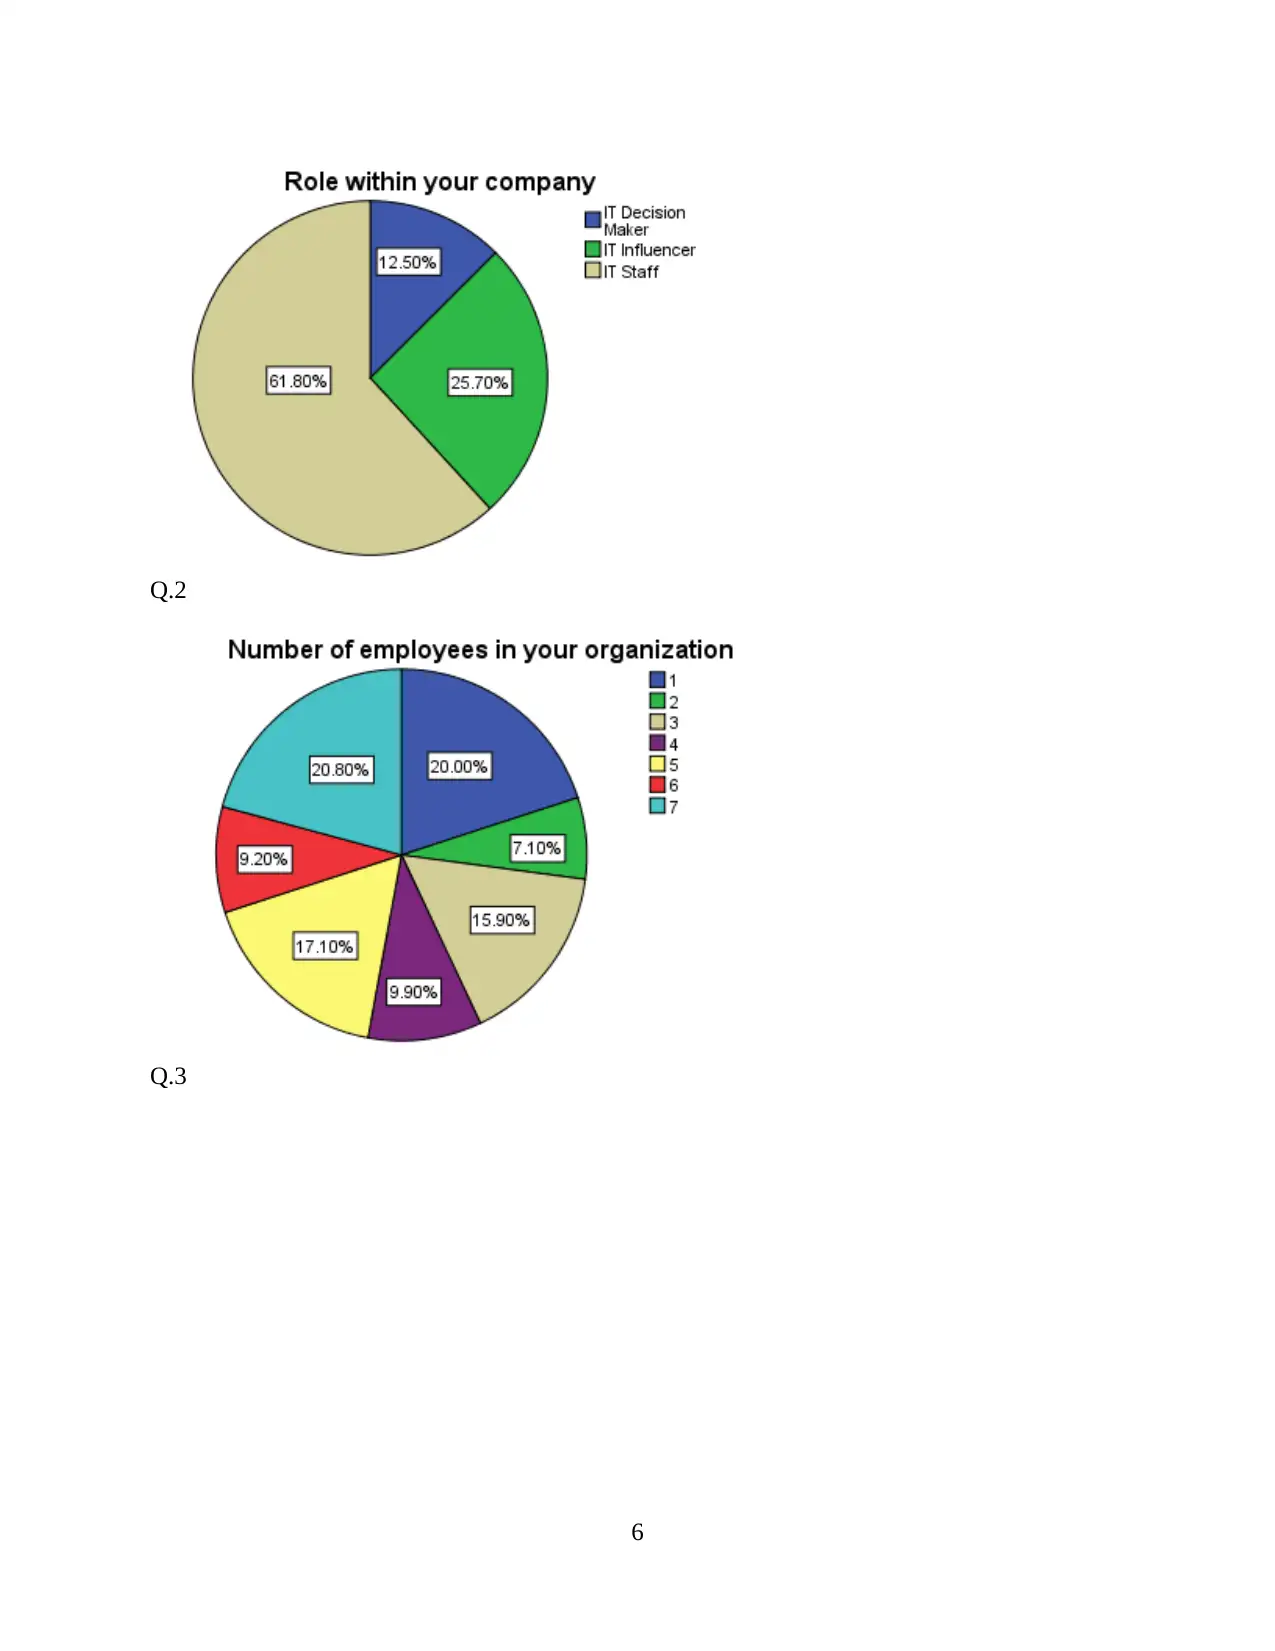
61.8% confirm the possibility of the role of person. Table 2 in Q.2 refers towards number of
employees regarding in the organisation. It is evaluating that organisations are required to define
the validity and conformity of numbers of employees in IBM. In Q.3, most preferred vendors are
analysed subject to high compatibility of Vendors. The results as per table in Q.3 presents
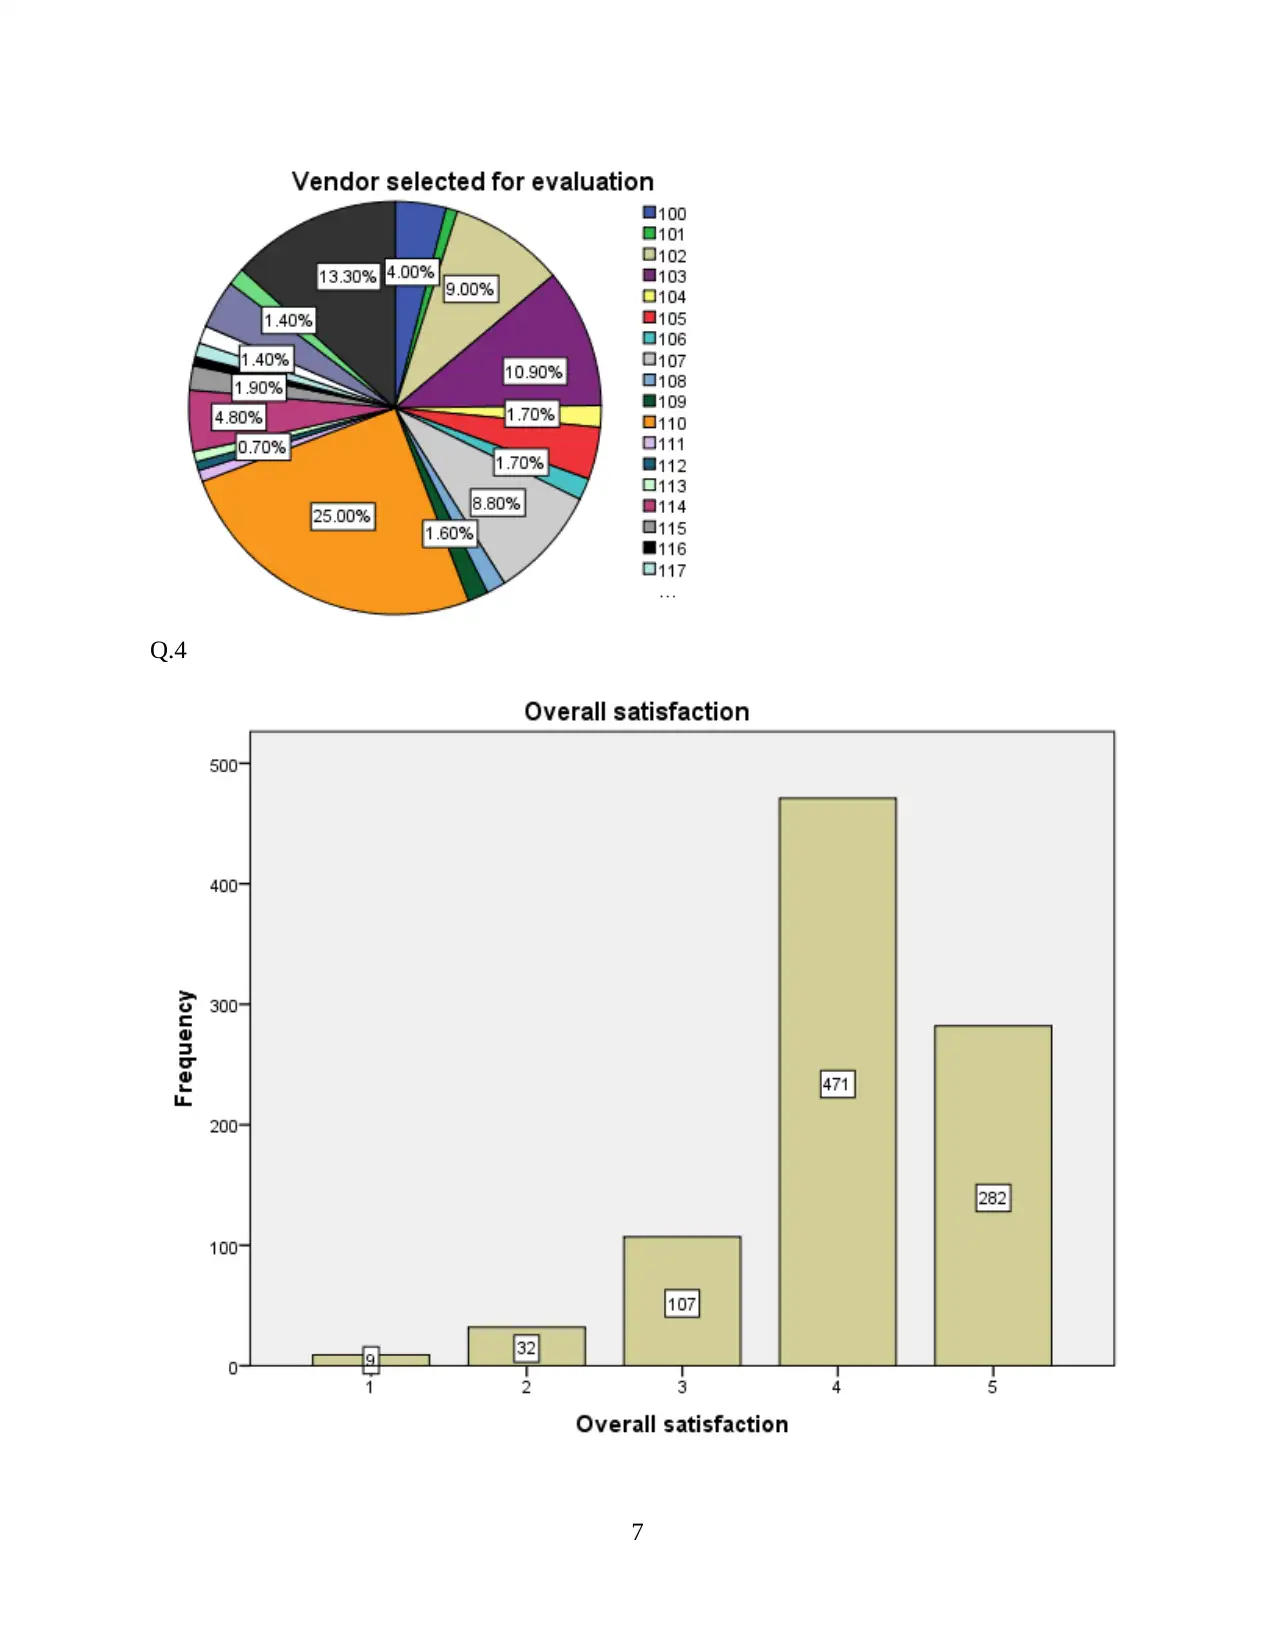
cumulative percentage of 69.2% in respect of IBM. For analysing the satisfaction level measures
are defined as code and most of the employees are counted satisfied 68.7% is calculated as
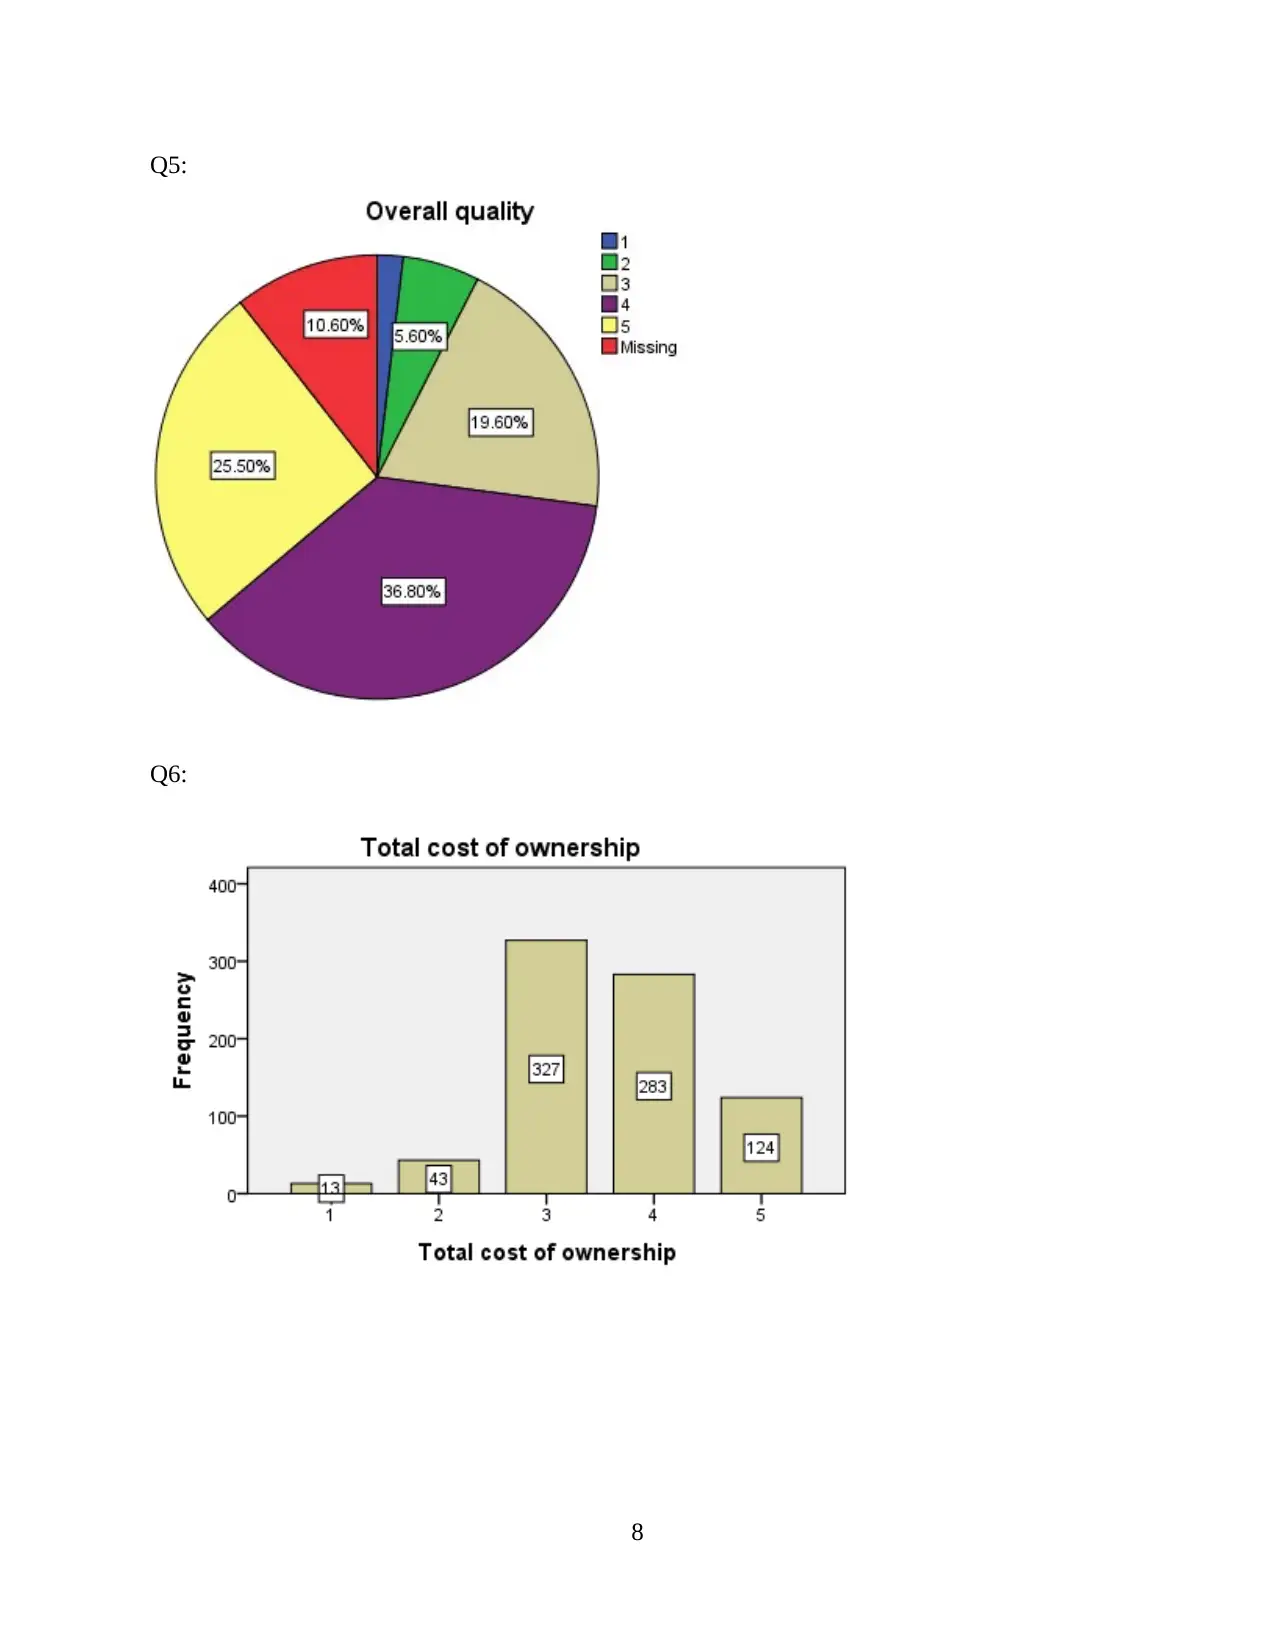
cumulative percentage of satisfied persons. For analysing the own experiences are heard and rate
given regarding products and the services. For this frequency is calculated in Q.5 and 71.5
percent respondents are agreeing with the products and services of IBM. Figures 6/ Q.6 is
defined related to ownership for the organisation and the costs are considered as on-going costs.
Figure 7 contains the relation to the price and values offered. 83.3% are considered very good
(Wierenga, 2011). In addition, frequencies are considering in this report.
Figure 18 defines the continuity of buyer’s subject to purchasing form the IBM during the
next year. Frequency is calculated to analyse the strength of buyers. Figure 19 covers the
percentage likelihood subject to continue whether continue to purchase or discontinue
purchasing from IBM. Q.20 it is analysed that covers the relation related to recommendations to
suggest IT company. By evaluating frequency of respondents’ response subject to IBM are
consider by considering very likely with 57%. Q.21 contains the logic behind the increment of
purchase of products and services. 8.
In relation to highest frequency i.e. 338 indicates that ultimately company cares about
society by their into account their opinion “Neither Agree nor Disagree” with majority of
33.80%. As per charts and graphs which are shown in the appendixes has been analyzed in order
to determine the overall profitability of the IBM and increase changes of growth in term of
customer can also be planning to high. From the appendix, it is clear that Level of agreement in
4
There are 1000 respondents taken in respect of IBM's target segment. The roles of
different persons are defined regarding managing the sections and the departments of IBM. The
research is basically done from as primary sources of data collection which would effectively
valuable for profitable business operation. IT decision maker, influencer and IT staff members
are consider creating the decision-making and principle for better analysis (Bellenger, Bernhardt
and Goldstucker, 2011). Best roles as per table Q1, IT staff role retain the valid percentage of
61.8% confirm the possibility of the role of person. Table 2 in Q.2 refers towards number of
employees regarding in the organisation. It is evaluating that organisations are required to define
the validity and conformity of numbers of employees in IBM. In Q.3, most preferred vendors are
analysed subject to high compatibility of Vendors. The results as per table in Q.3 presents
cumulative percentage of 69.2% in respect of IBM. For analysing the satisfaction level measures
are defined as code and most of the employees are counted satisfied 68.7% is calculated as
cumulative percentage of satisfied persons. For analysing the own experiences are heard and rate
given regarding products and the services. For this frequency is calculated in Q.5 and 71.5
percent respondents are agreeing with the products and services of IBM. Figures 6/ Q.6 is
defined related to ownership for the organisation and the costs are considered as on-going costs.
Figure 7 contains the relation to the price and values offered. 83.3% are considered very good
(Wierenga, 2011). In addition, frequencies are considering in this report.
Figure 18 defines the continuity of buyer’s subject to purchasing form the IBM during the
next year. Frequency is calculated to analyse the strength of buyers. Figure 19 covers the
percentage likelihood subject to continue whether continue to purchase or discontinue
purchasing from IBM. Q.20 it is analysed that covers the relation related to recommendations to
suggest IT company. By evaluating frequency of respondents’ response subject to IBM are
consider by considering very likely with 57%. Q.21 contains the logic behind the increment of
purchase of products and services. 8.
In relation to highest frequency i.e. 338 indicates that ultimately company cares about
society by their into account their opinion “Neither Agree nor Disagree” with majority of
33.80%. As per charts and graphs which are shown in the appendixes has been analyzed in order
to determine the overall profitability of the IBM and increase changes of growth in term of
customer can also be planning to high. From the appendix, it is clear that Level of agreement in
4
Secure Best Marks with AI Grader
Need help grading? Try our AI Grader for instant feedback on your assignments.
context of whether company is highly ethical, is Neither Agree nor Disagree with highest
frequency of 302. As per results, Company is leader in IT Industry because company has
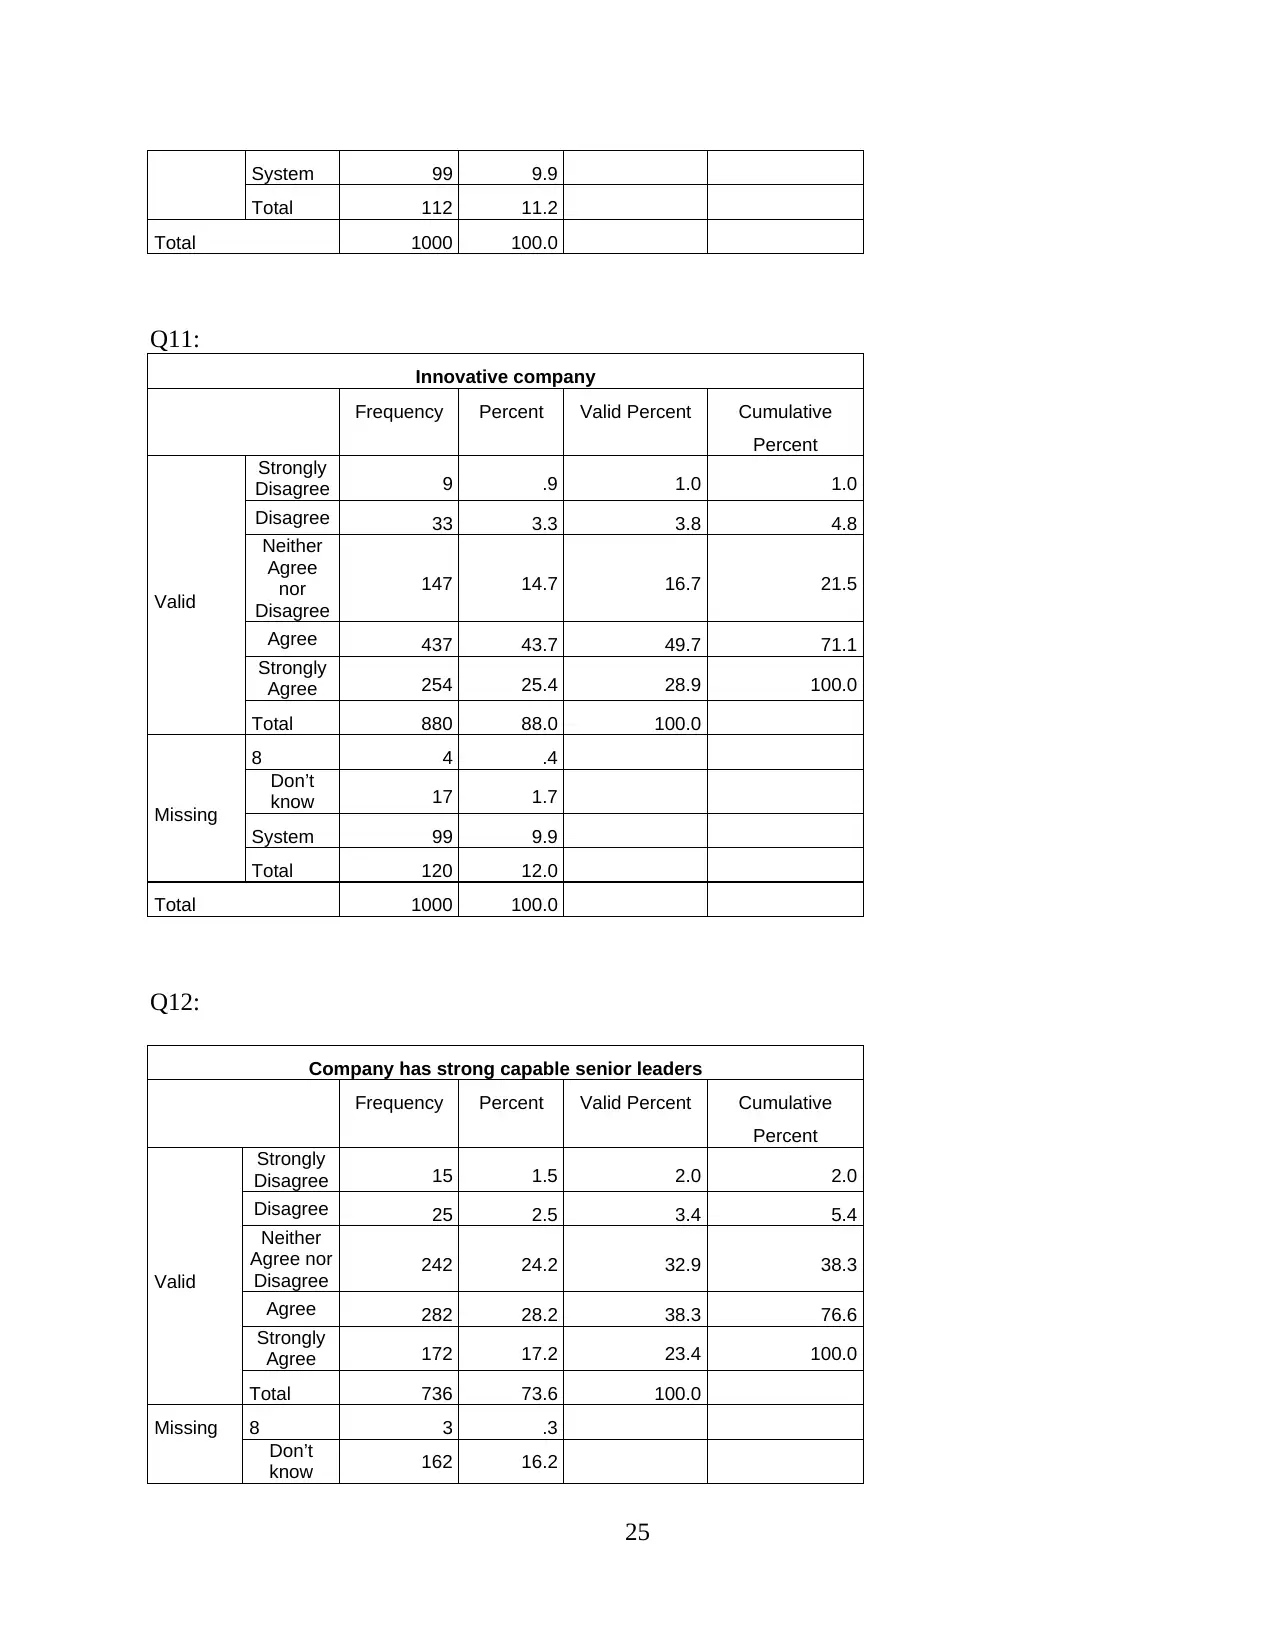
agreement of level of “Agree”. Company is under the category of Innovative Company because
results of analysis points out that agreement of level is at “Agree” with highest frequency of 437.
Yes, company has strong capable senior leaders because analysis exhibits that highest frequency
i.e. 282 or 28.20% indicates Agree among levels of agreement.
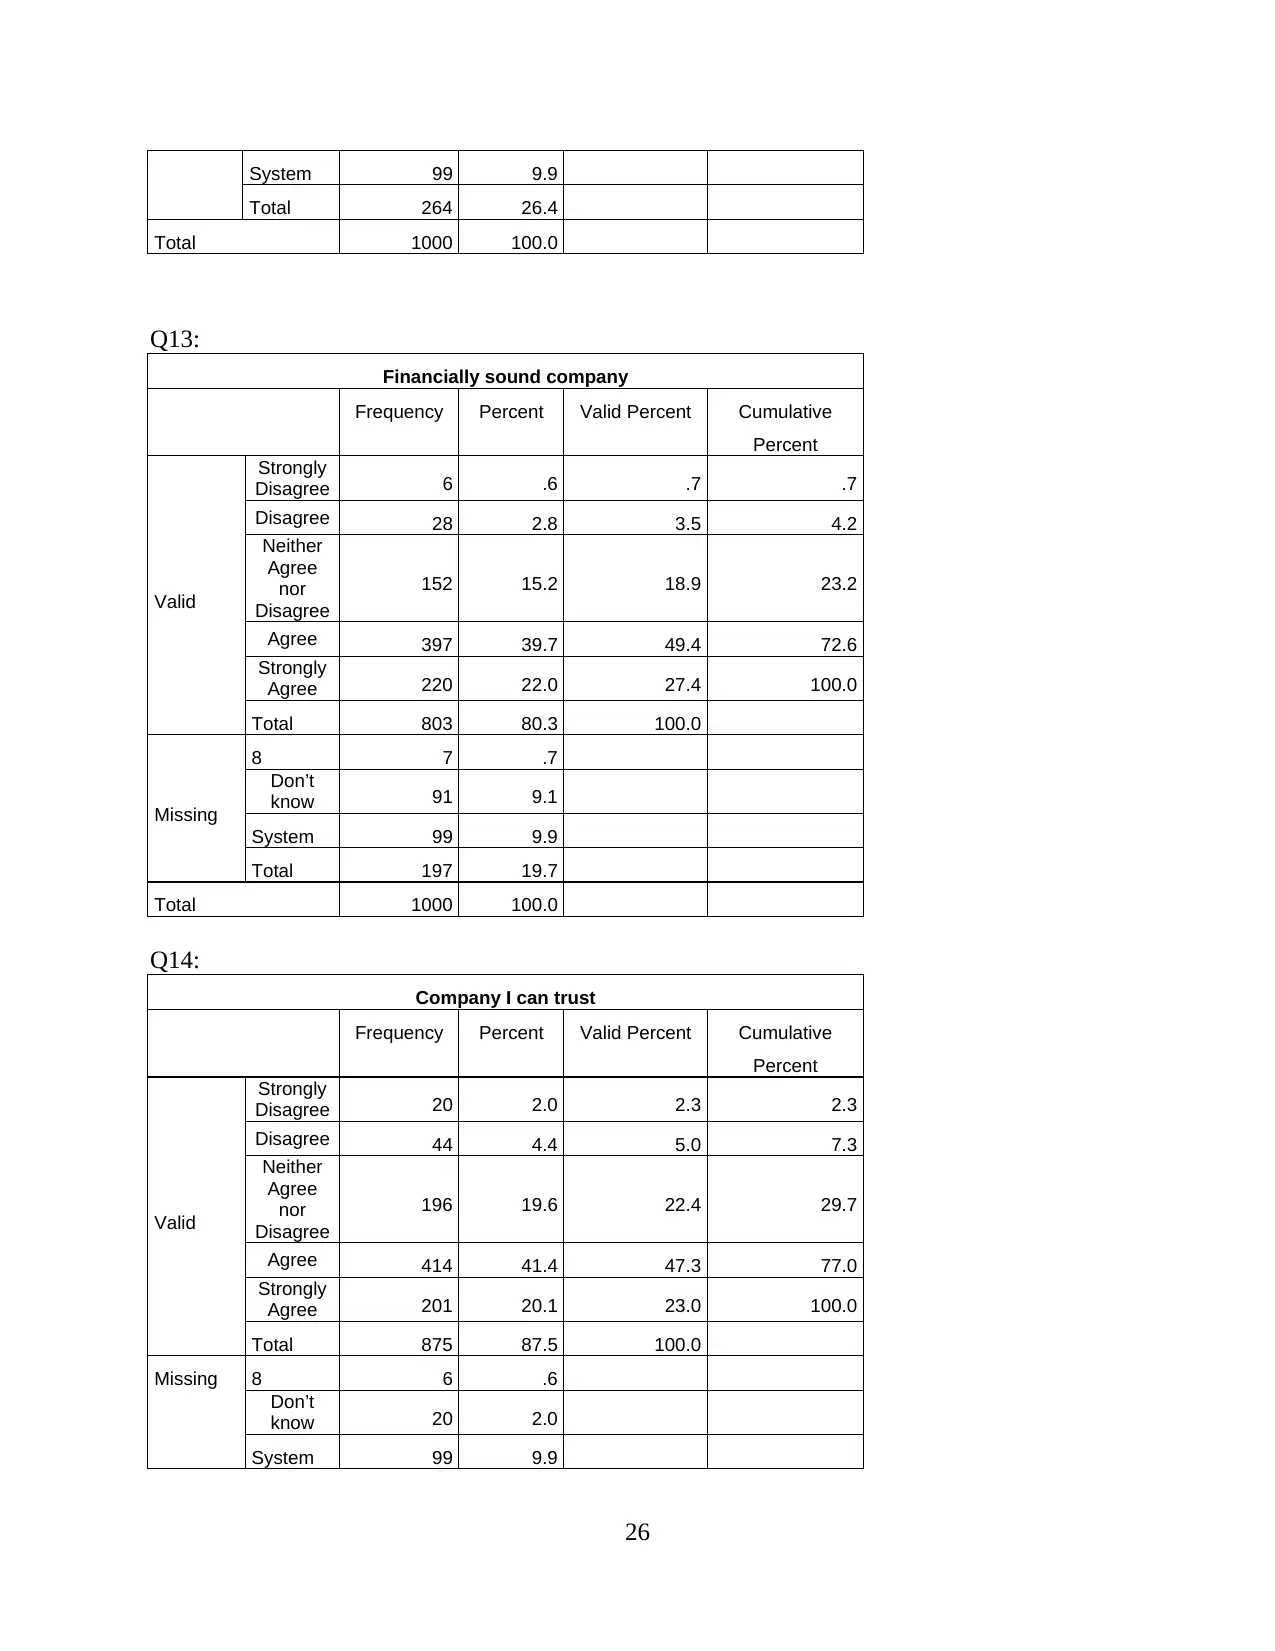
According to the pie chat prepared in Appendix, it is clear that company is a financially
sound company because 39.70% of total respondent that is highest are agree with it. Around
maximum 41.43% of total respondents are agree on the statement that company is trustworthy.
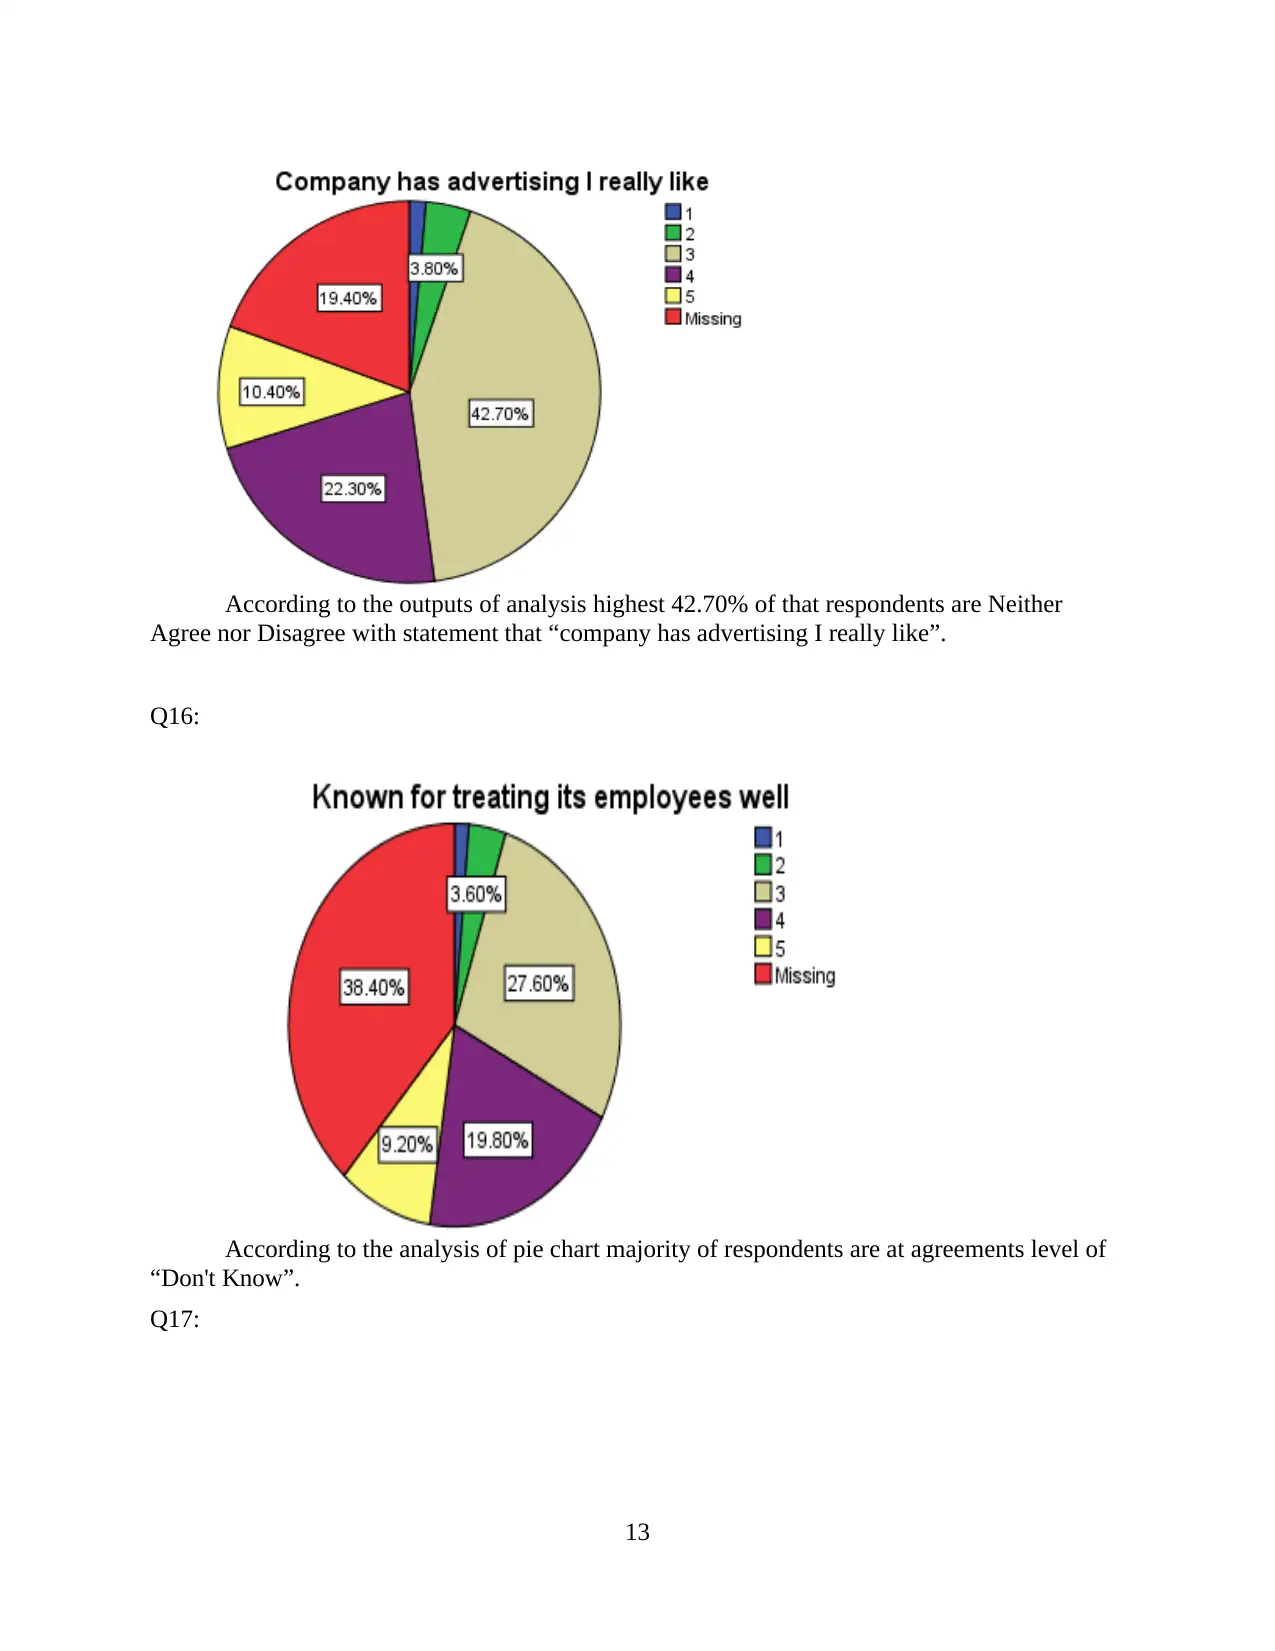
As per the outputs of analysis, a total of 42.70% of those respondents are neither agree nor
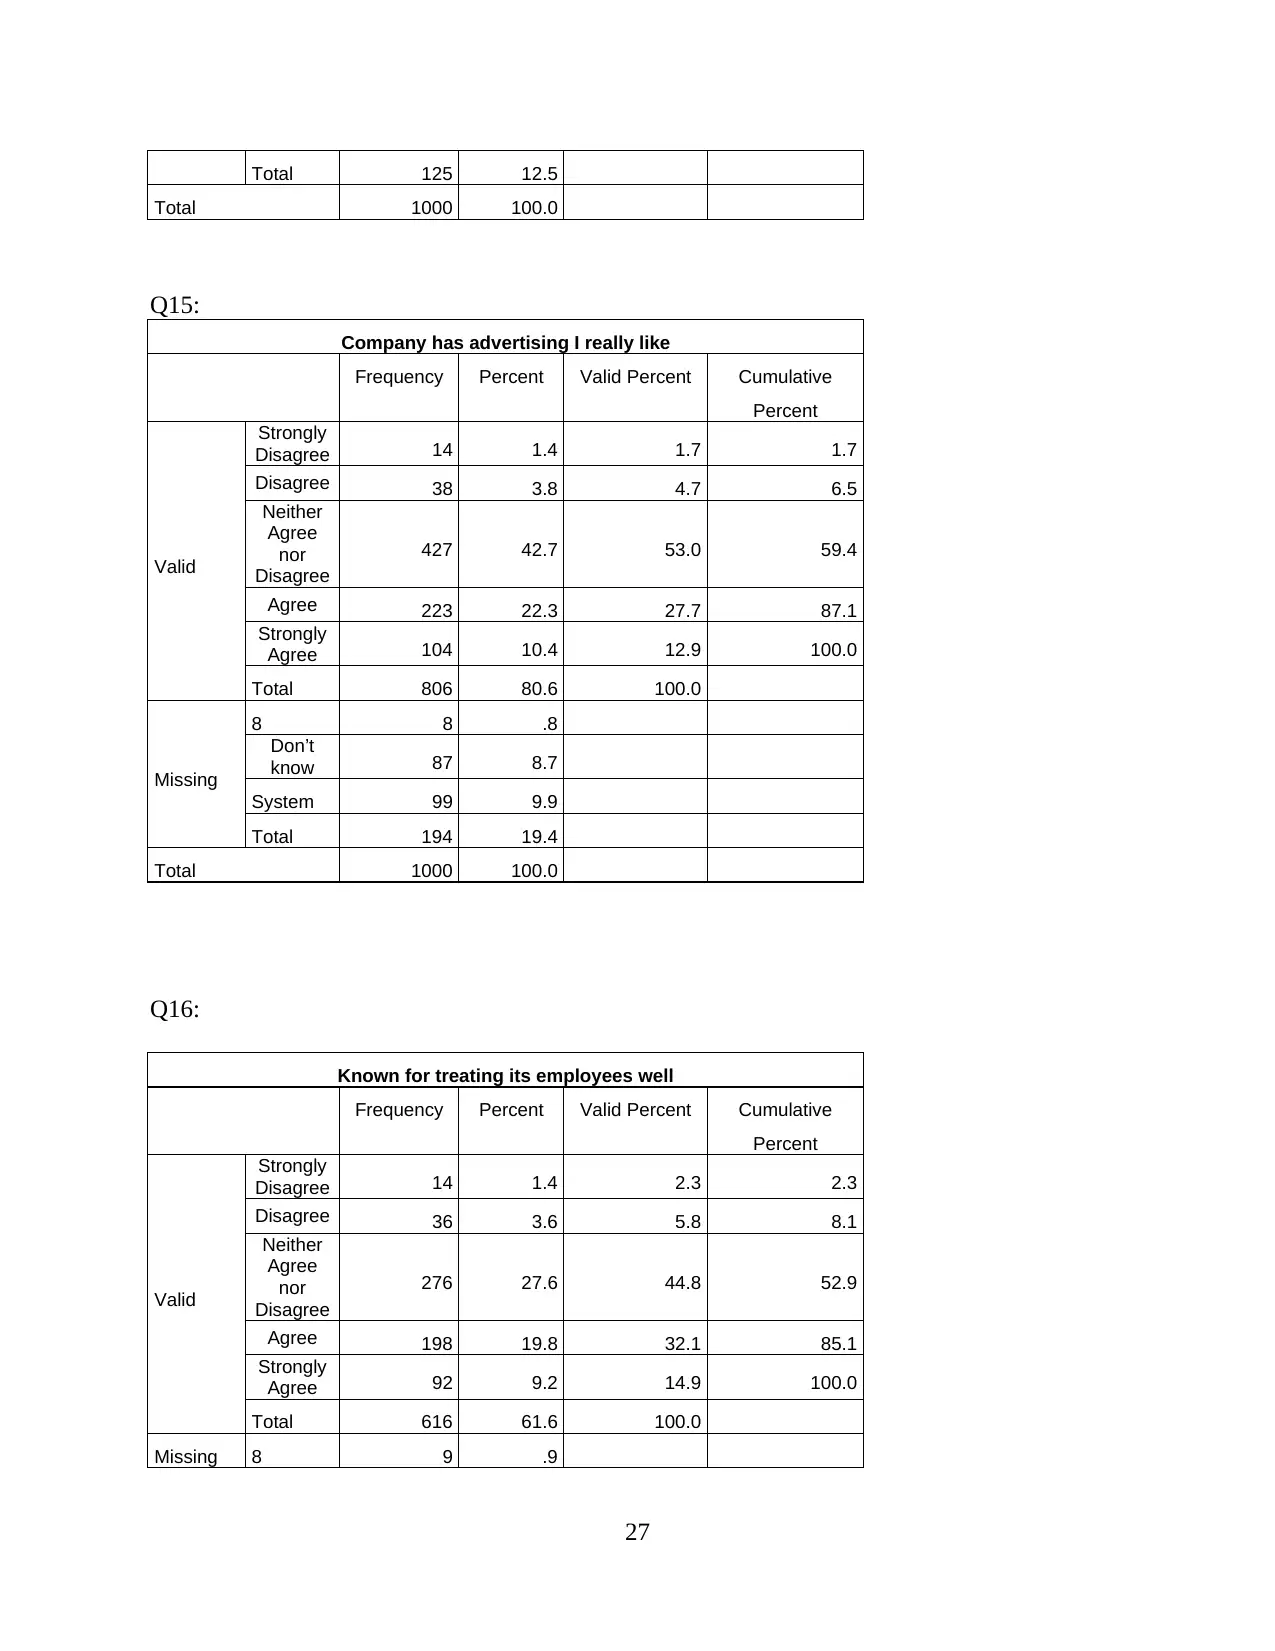
disagree with the statement that “company has advertising I really like”. According to the
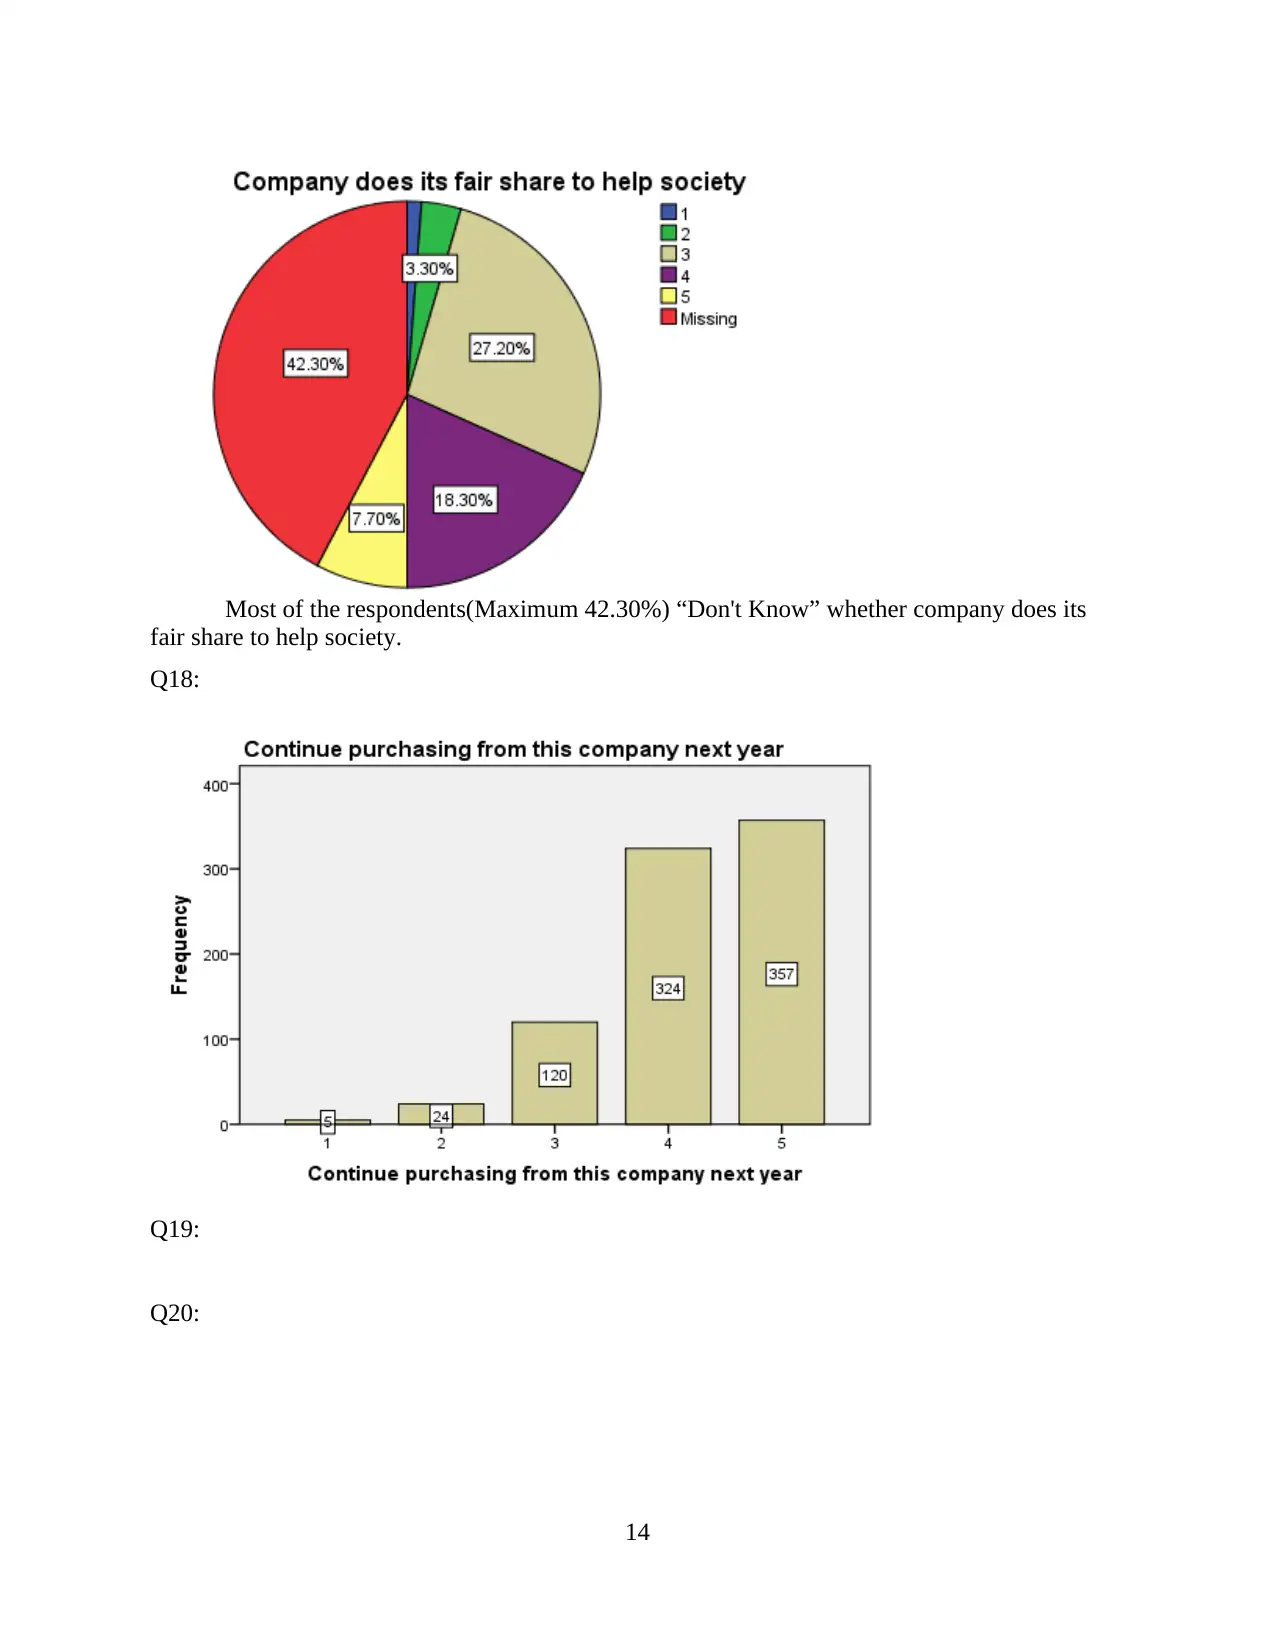
analysis of pie chart majority of respondents are at agreements level of “Don't Know”. Most of
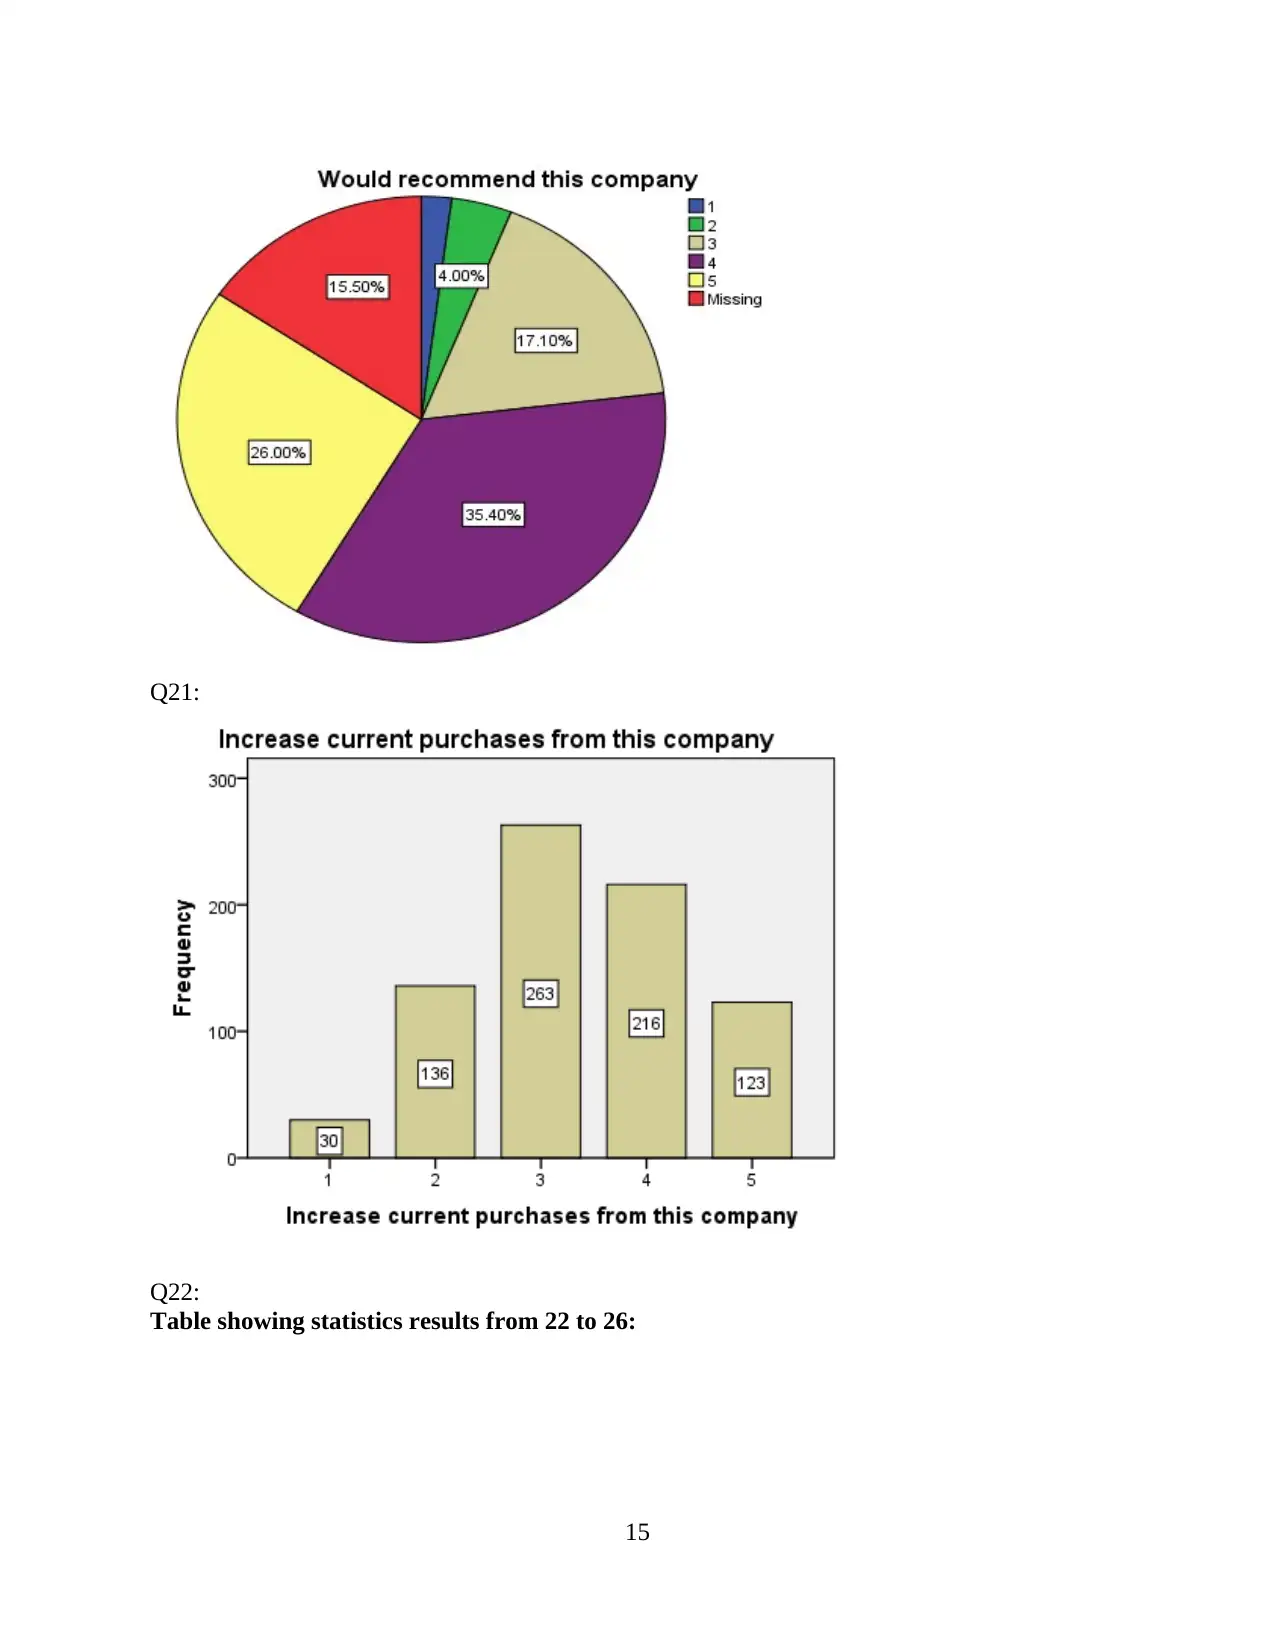
the respondents (Maximum 42.30%) “Don't Know” whether company does its fair share to help
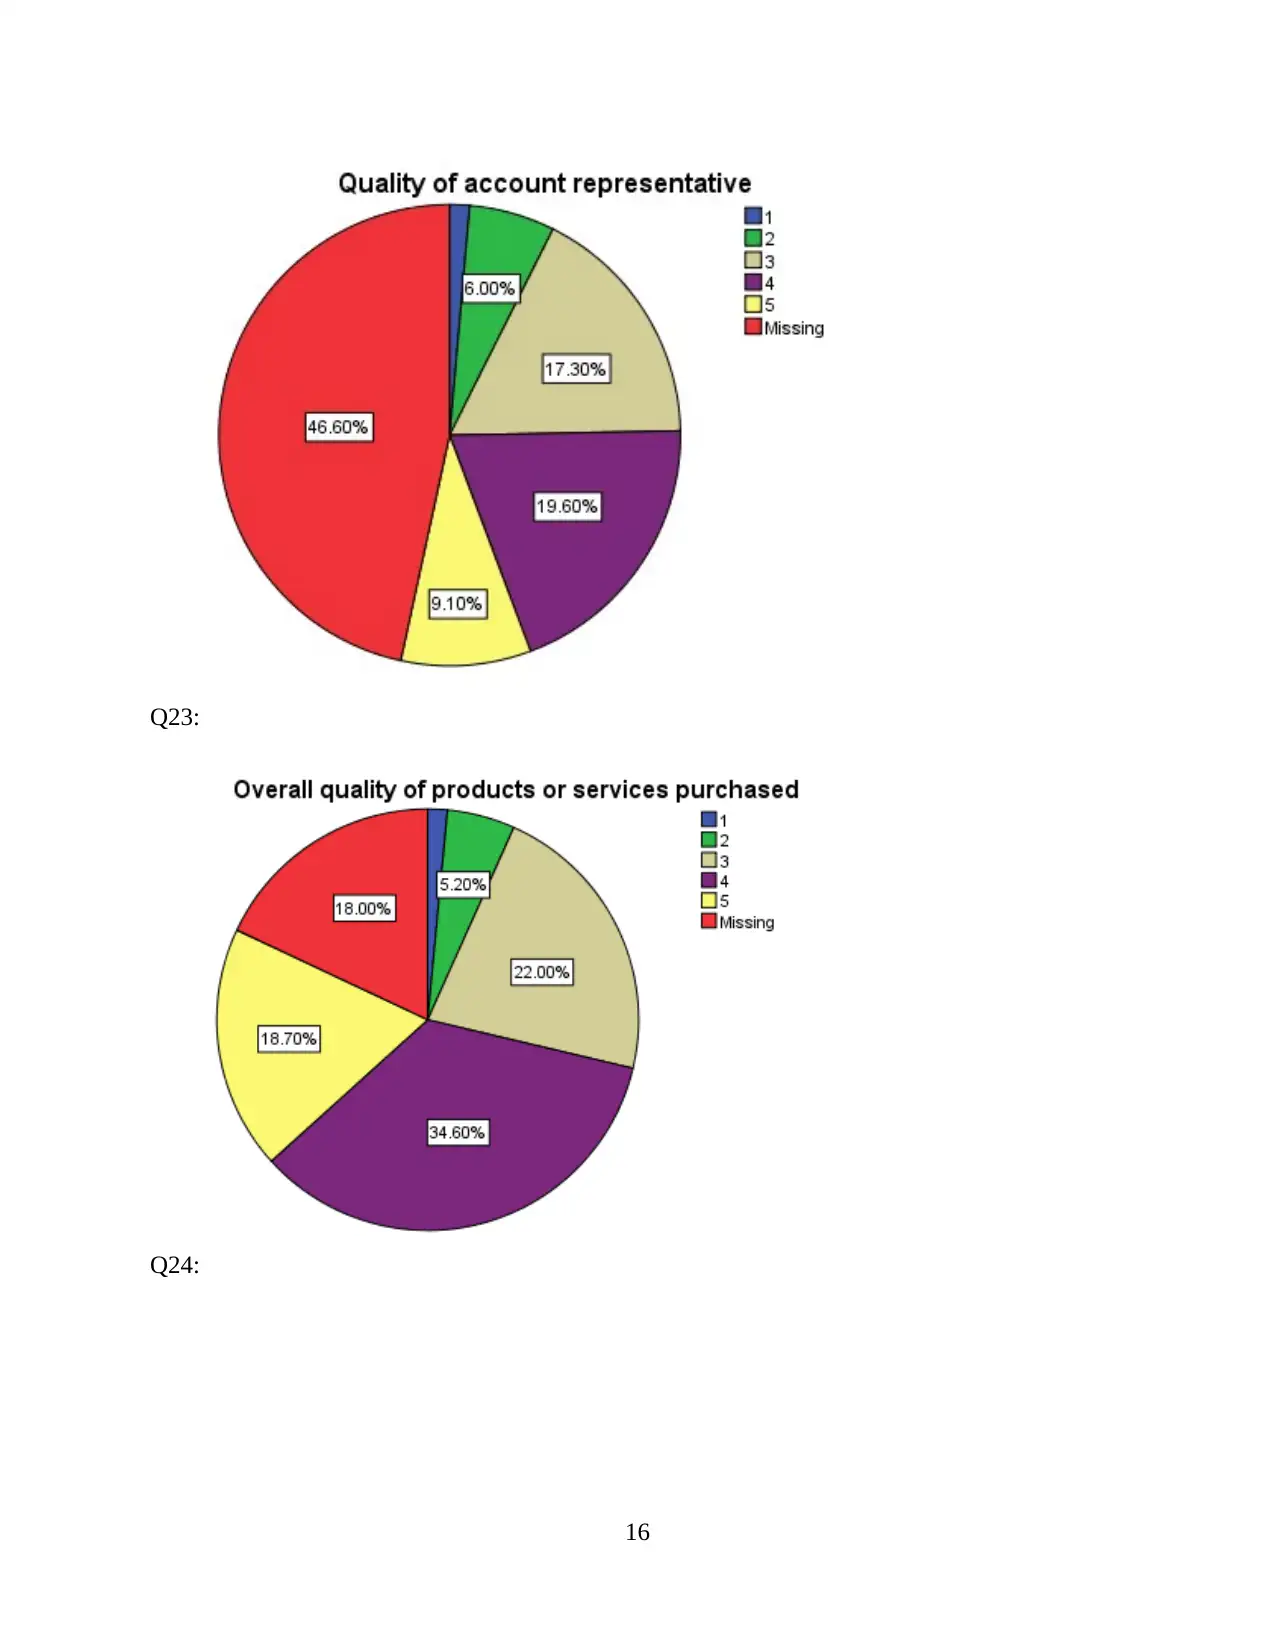
society. Analysis of pie-chart related to Rate of quality of the account representative or team
exhibits that actual rating cannot be determined because most of the respondent don't know about
answers of question regarding quality (Cambra-Fierro and Wilson, 2011). Overall quality of
products or services purchased are good as it has highest frequency in analysis. Majority of
respondents do not know about overall quality of non-technical customer services provided by
company. Due to unawareness of most of the respondents, it is not clear about overall quality of
training and education programs of company. As per analysis, quality of technical support is
undetermined because maximum number of respondent do not know about this question. Figures
27 and 28 are based upon some factors and response are evaluated because of scales.
Graphs are prepared on the basis of given responses of respondents
Q.1
5
frequency of 302. As per results, Company is leader in IT Industry because company has
agreement of level of “Agree”. Company is under the category of Innovative Company because
results of analysis points out that agreement of level is at “Agree” with highest frequency of 437.
Yes, company has strong capable senior leaders because analysis exhibits that highest frequency
i.e. 282 or 28.20% indicates Agree among levels of agreement.
According to the pie chat prepared in Appendix, it is clear that company is a financially
sound company because 39.70% of total respondent that is highest are agree with it. Around
maximum 41.43% of total respondents are agree on the statement that company is trustworthy.
As per the outputs of analysis, a total of 42.70% of those respondents are neither agree nor
disagree with the statement that “company has advertising I really like”. According to the
analysis of pie chart majority of respondents are at agreements level of “Don't Know”. Most of
the respondents (Maximum 42.30%) “Don't Know” whether company does its fair share to help
society. Analysis of pie-chart related to Rate of quality of the account representative or team
exhibits that actual rating cannot be determined because most of the respondent don't know about
answers of question regarding quality (Cambra-Fierro and Wilson, 2011). Overall quality of
products or services purchased are good as it has highest frequency in analysis. Majority of
respondents do not know about overall quality of non-technical customer services provided by
company. Due to unawareness of most of the respondents, it is not clear about overall quality of
training and education programs of company. As per analysis, quality of technical support is
undetermined because maximum number of respondent do not know about this question. Figures
27 and 28 are based upon some factors and response are evaluated because of scales.
Graphs are prepared on the basis of given responses of respondents
Q.1
5
Q.2
Q.3
6
Q.3
6
Q.4
7
7
Paraphrase This Document
Need a fresh take? Get an instant paraphrase of this document with our AI Paraphraser
Q5:
Q6:
8
Q6:
8
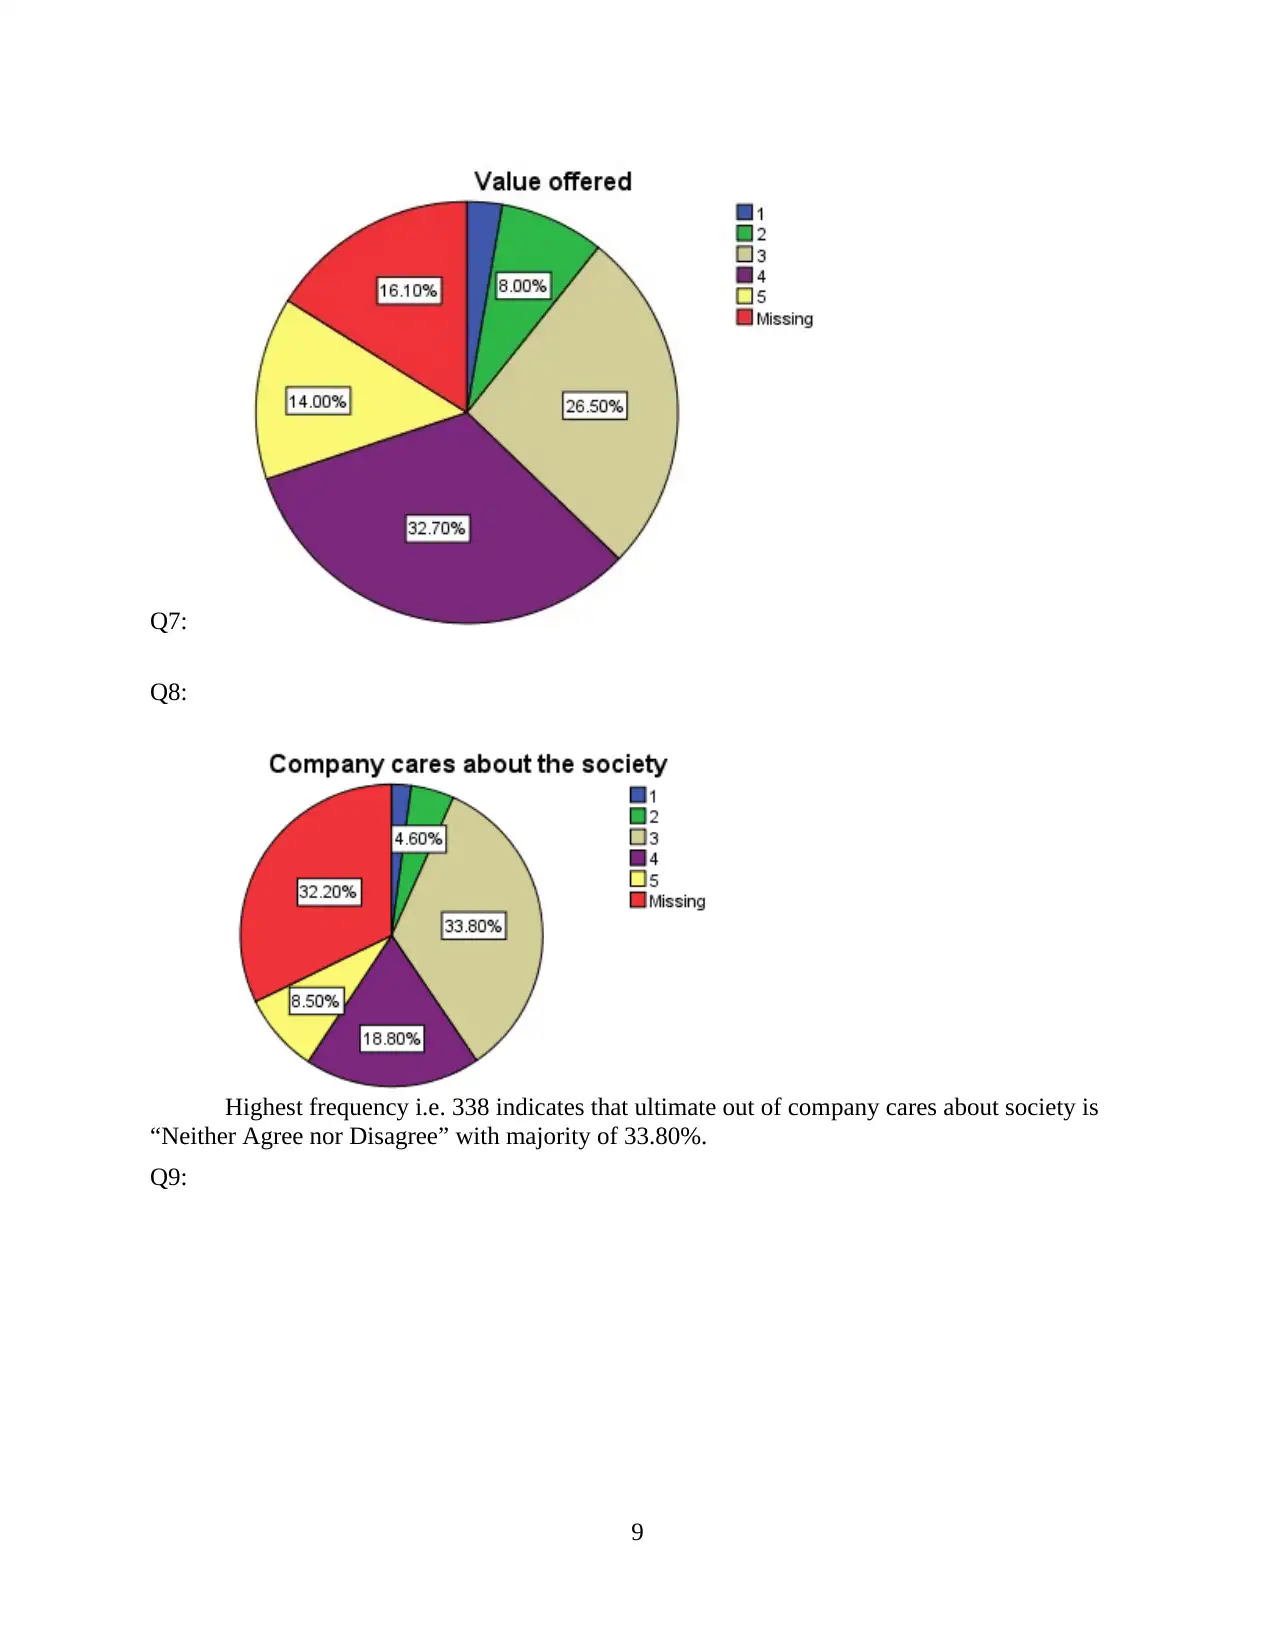
Q7:
Q8:
Highest frequency i.e. 338 indicates that ultimate out of company cares about society is
“Neither Agree nor Disagree” with majority of 33.80%.
Q9:
9
Q8:
Highest frequency i.e. 338 indicates that ultimate out of company cares about society is
“Neither Agree nor Disagree” with majority of 33.80%.
Q9:
9
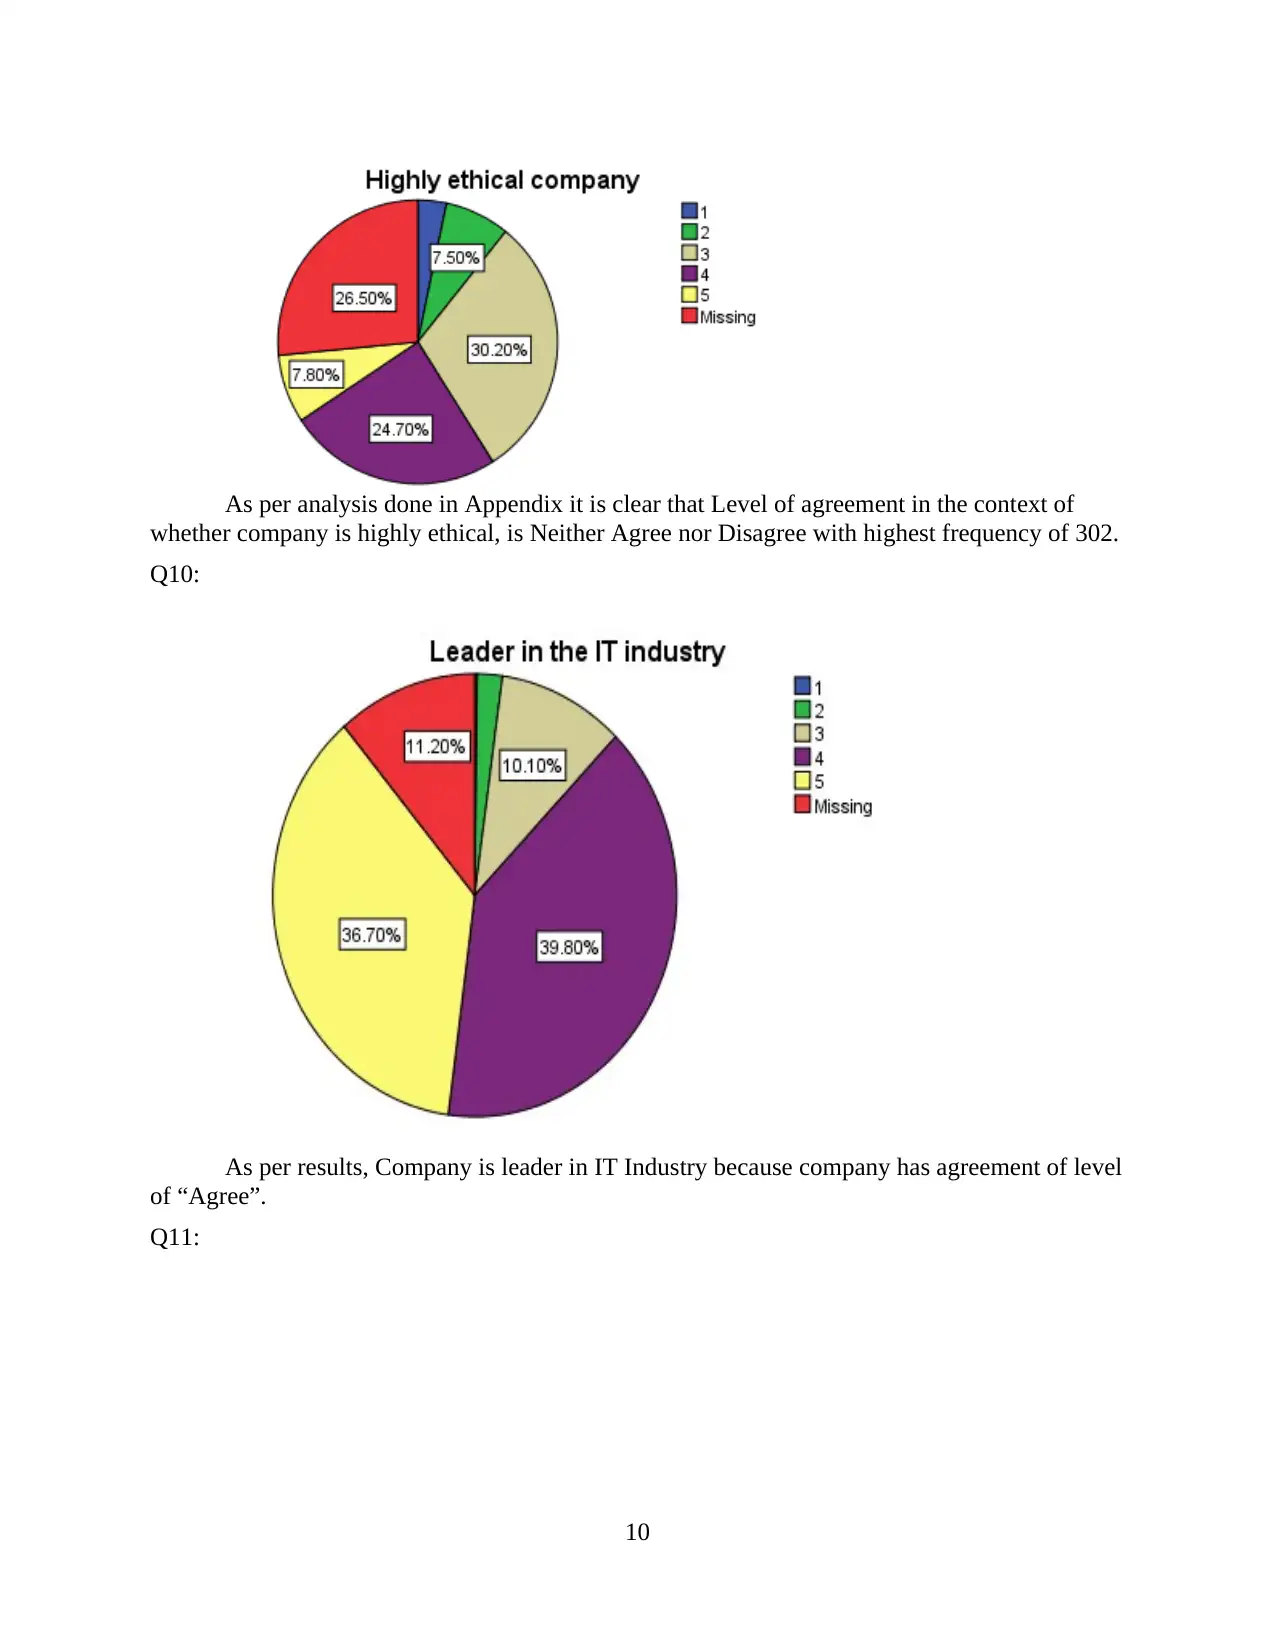
As per analysis done in Appendix it is clear that Level of agreement in the context of
whether company is highly ethical, is Neither Agree nor Disagree with highest frequency of 302.
Q10:
As per results, Company is leader in IT Industry because company has agreement of level
of “Agree”.
Q11:
10
whether company is highly ethical, is Neither Agree nor Disagree with highest frequency of 302.
Q10:
As per results, Company is leader in IT Industry because company has agreement of level
of “Agree”.
Q11:
10
Secure Best Marks with AI Grader
Need help grading? Try our AI Grader for instant feedback on your assignments.
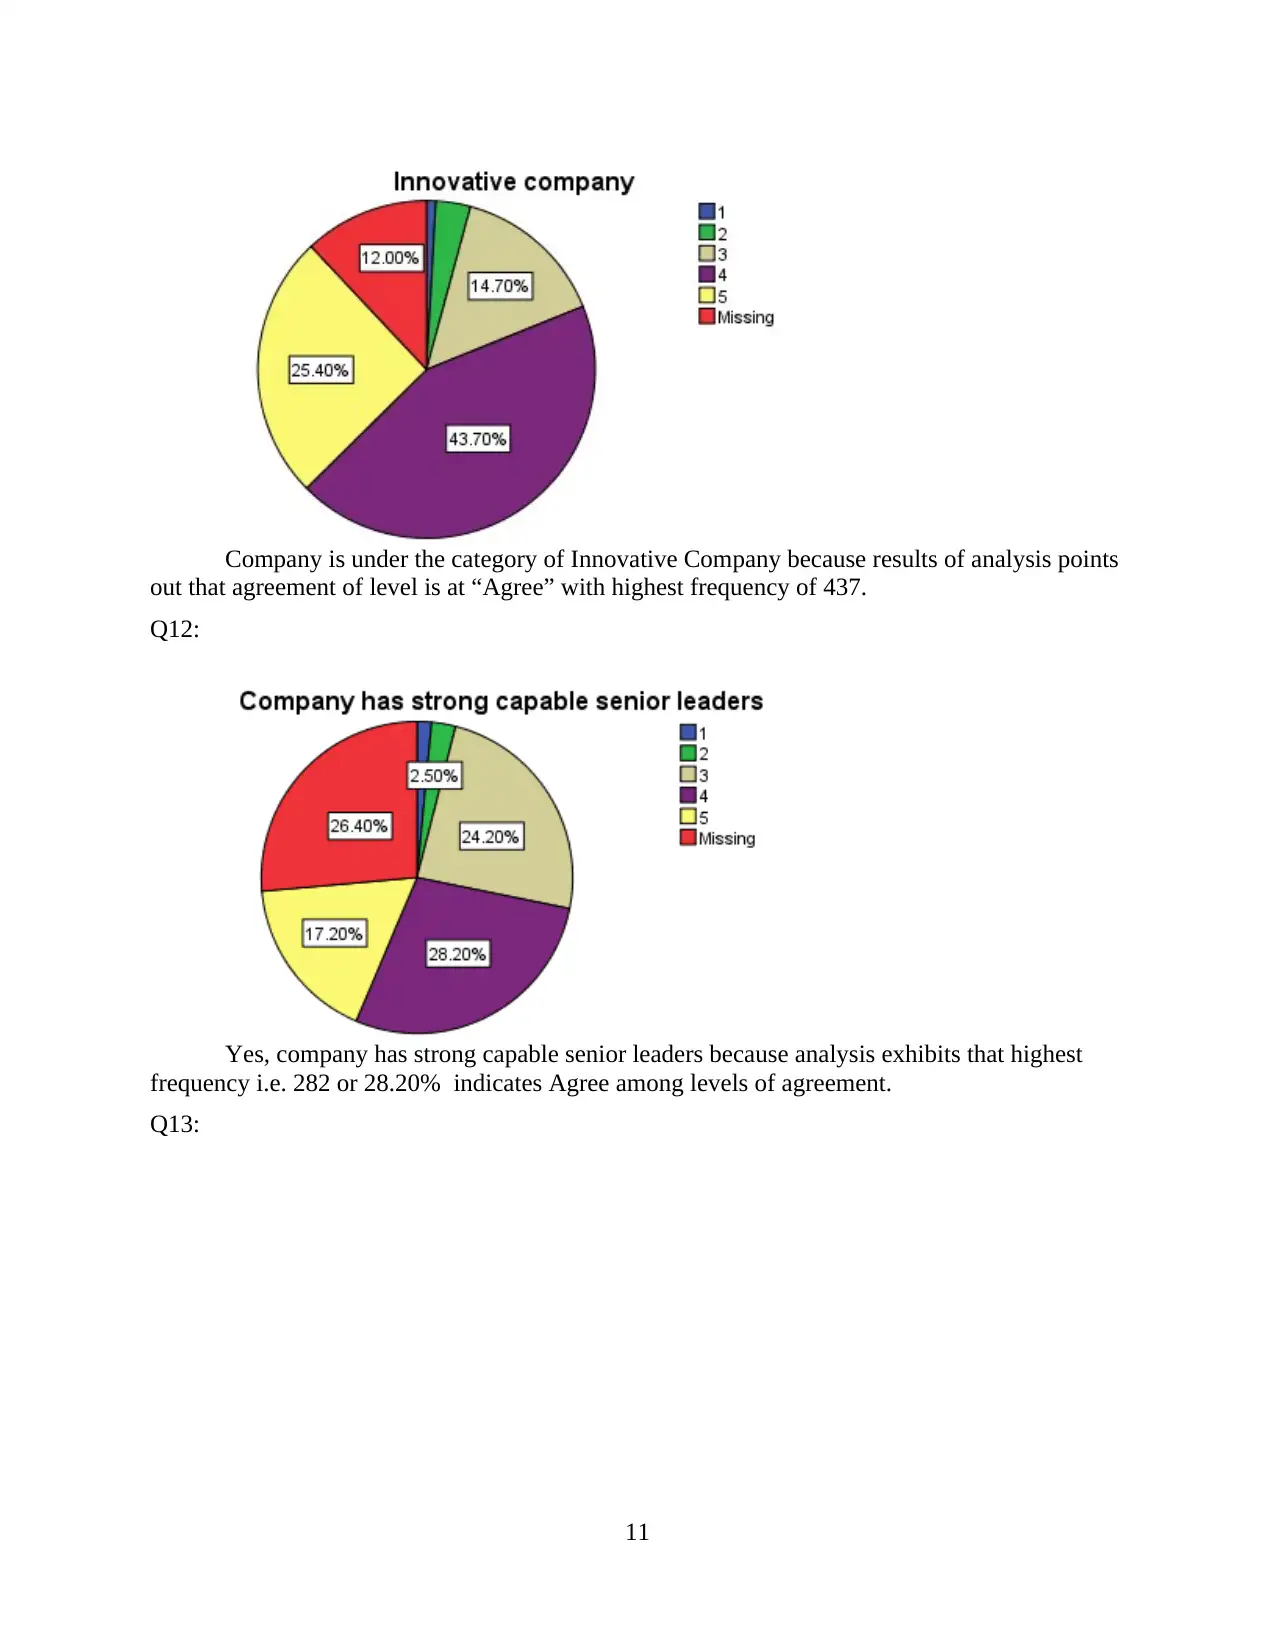
Company is under the category of Innovative Company because results of analysis points
out that agreement of level is at “Agree” with highest frequency of 437.
Q12:
Yes, company has strong capable senior leaders because analysis exhibits that highest
frequency i.e. 282 or 28.20% indicates Agree among levels of agreement.
Q13:
11
out that agreement of level is at “Agree” with highest frequency of 437.
Q12:
Yes, company has strong capable senior leaders because analysis exhibits that highest
frequency i.e. 282 or 28.20% indicates Agree among levels of agreement.
Q13:
11
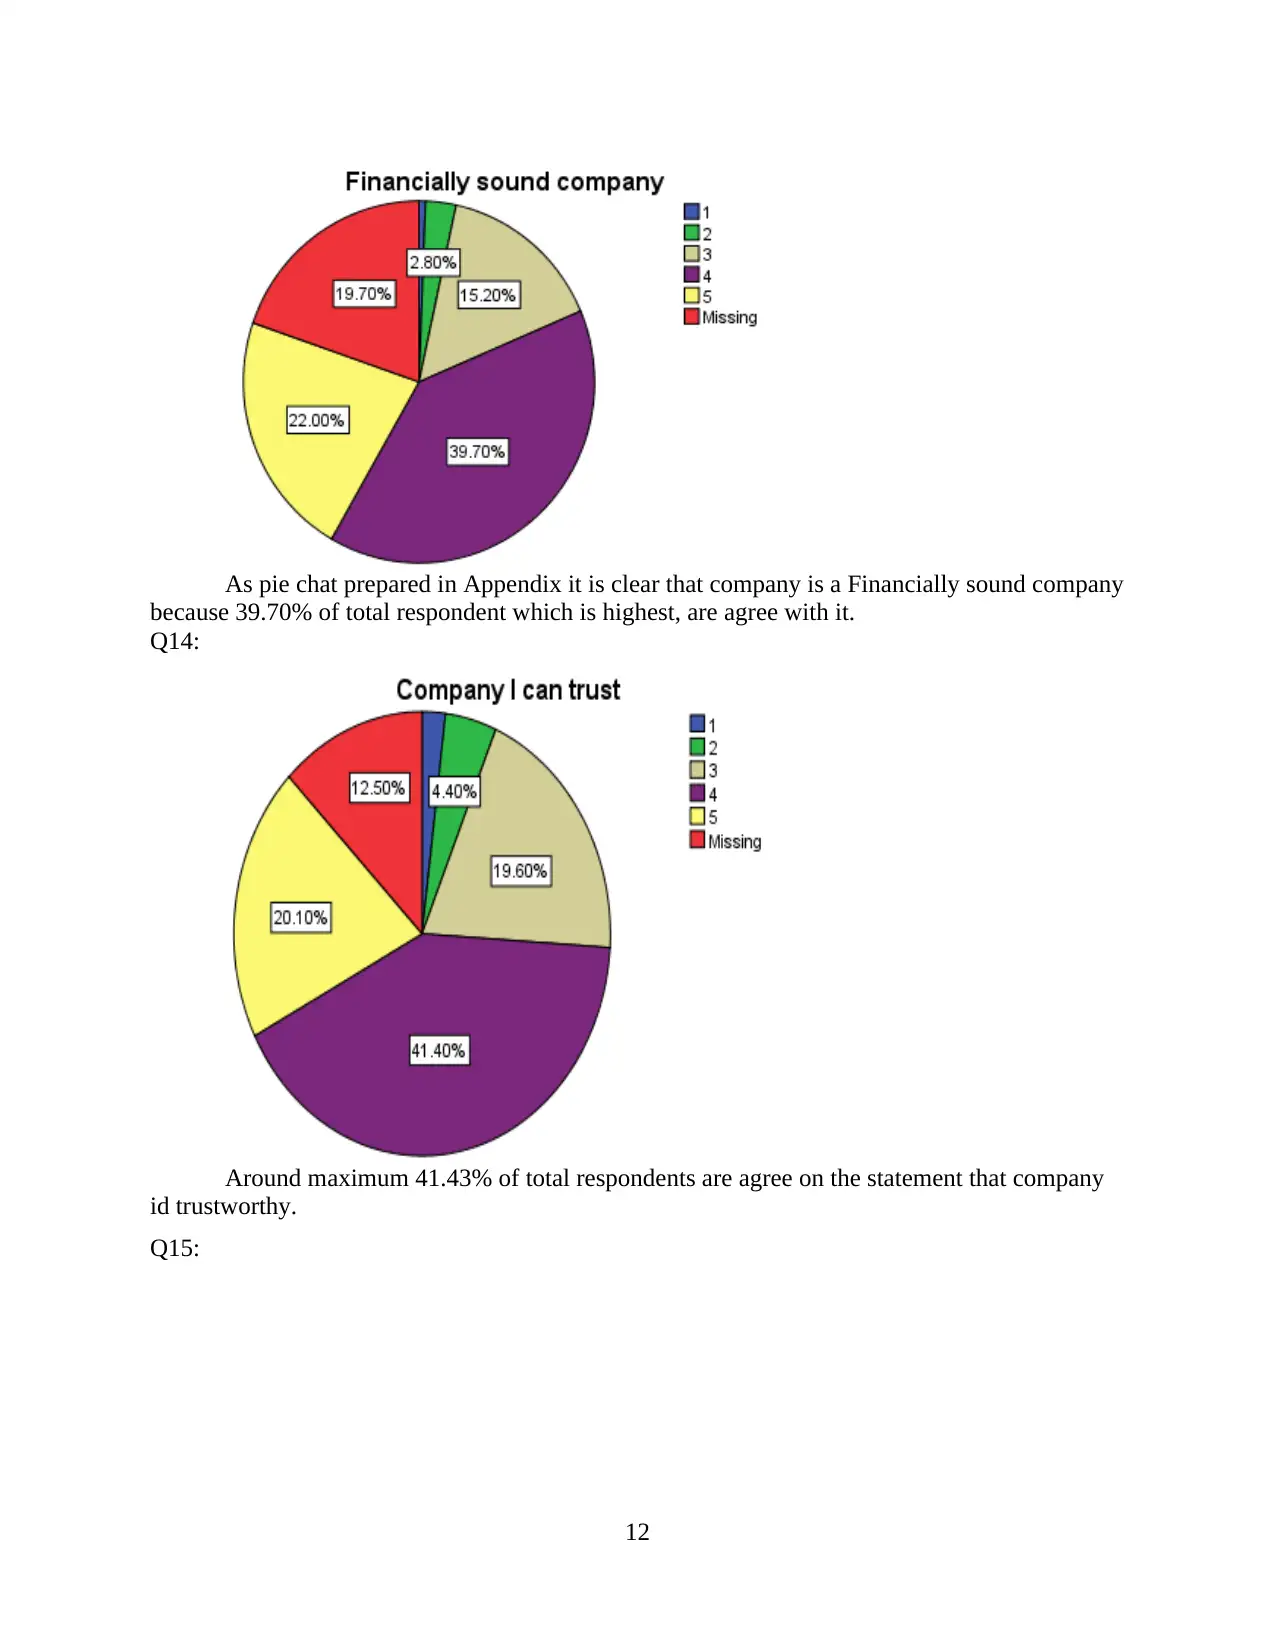
As pie chat prepared in Appendix it is clear that company is a Financially sound company
because 39.70% of total respondent which is highest, are agree with it.
Q14:
Around maximum 41.43% of total respondents are agree on the statement that company
id trustworthy.
Q15:
12
because 39.70% of total respondent which is highest, are agree with it.
Q14:
Around maximum 41.43% of total respondents are agree on the statement that company
id trustworthy.
Q15:
12
According to the outputs of analysis highest 42.70% of that respondents are Neither
Agree nor Disagree with statement that “company has advertising I really like”.
Q16:
According to the analysis of pie chart majority of respondents are at agreements level of
“Don't Know”.
Q17:
13
Agree nor Disagree with statement that “company has advertising I really like”.
Q16:
According to the analysis of pie chart majority of respondents are at agreements level of
“Don't Know”.
Q17:
13
Paraphrase This Document
Need a fresh take? Get an instant paraphrase of this document with our AI Paraphraser
Most of the respondents(Maximum 42.30%) “Don't Know” whether company does its
fair share to help society.
Q18:
Q19:
Q20:
14
fair share to help society.
Q18:
Q19:
Q20:
14
Q21:
Q22:
Table showing statistics results from 22 to 26:
15
Q22:
Table showing statistics results from 22 to 26:
15
Q23:
Q24:
16
Q24:
16
Secure Best Marks with AI Grader
Need help grading? Try our AI Grader for instant feedback on your assignments.
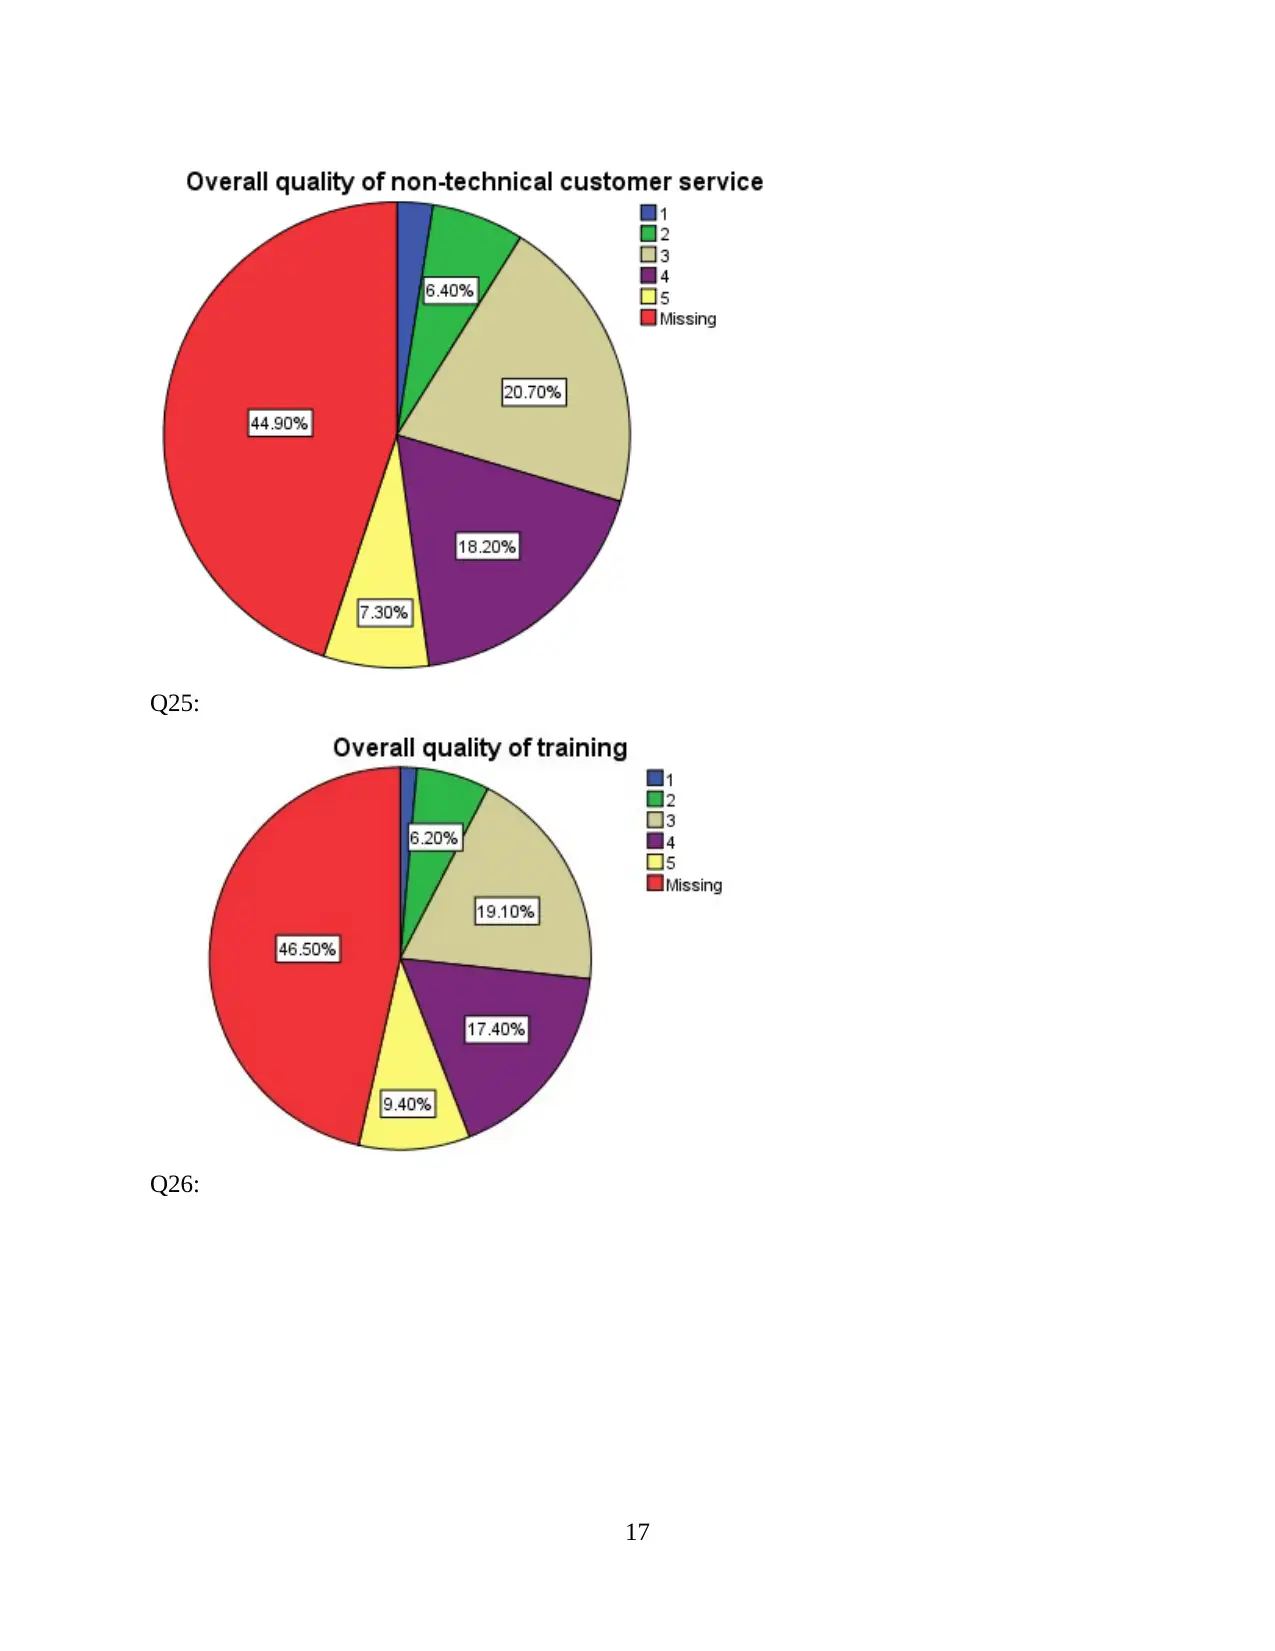
Q25:
Q26:
17
Q26:
17
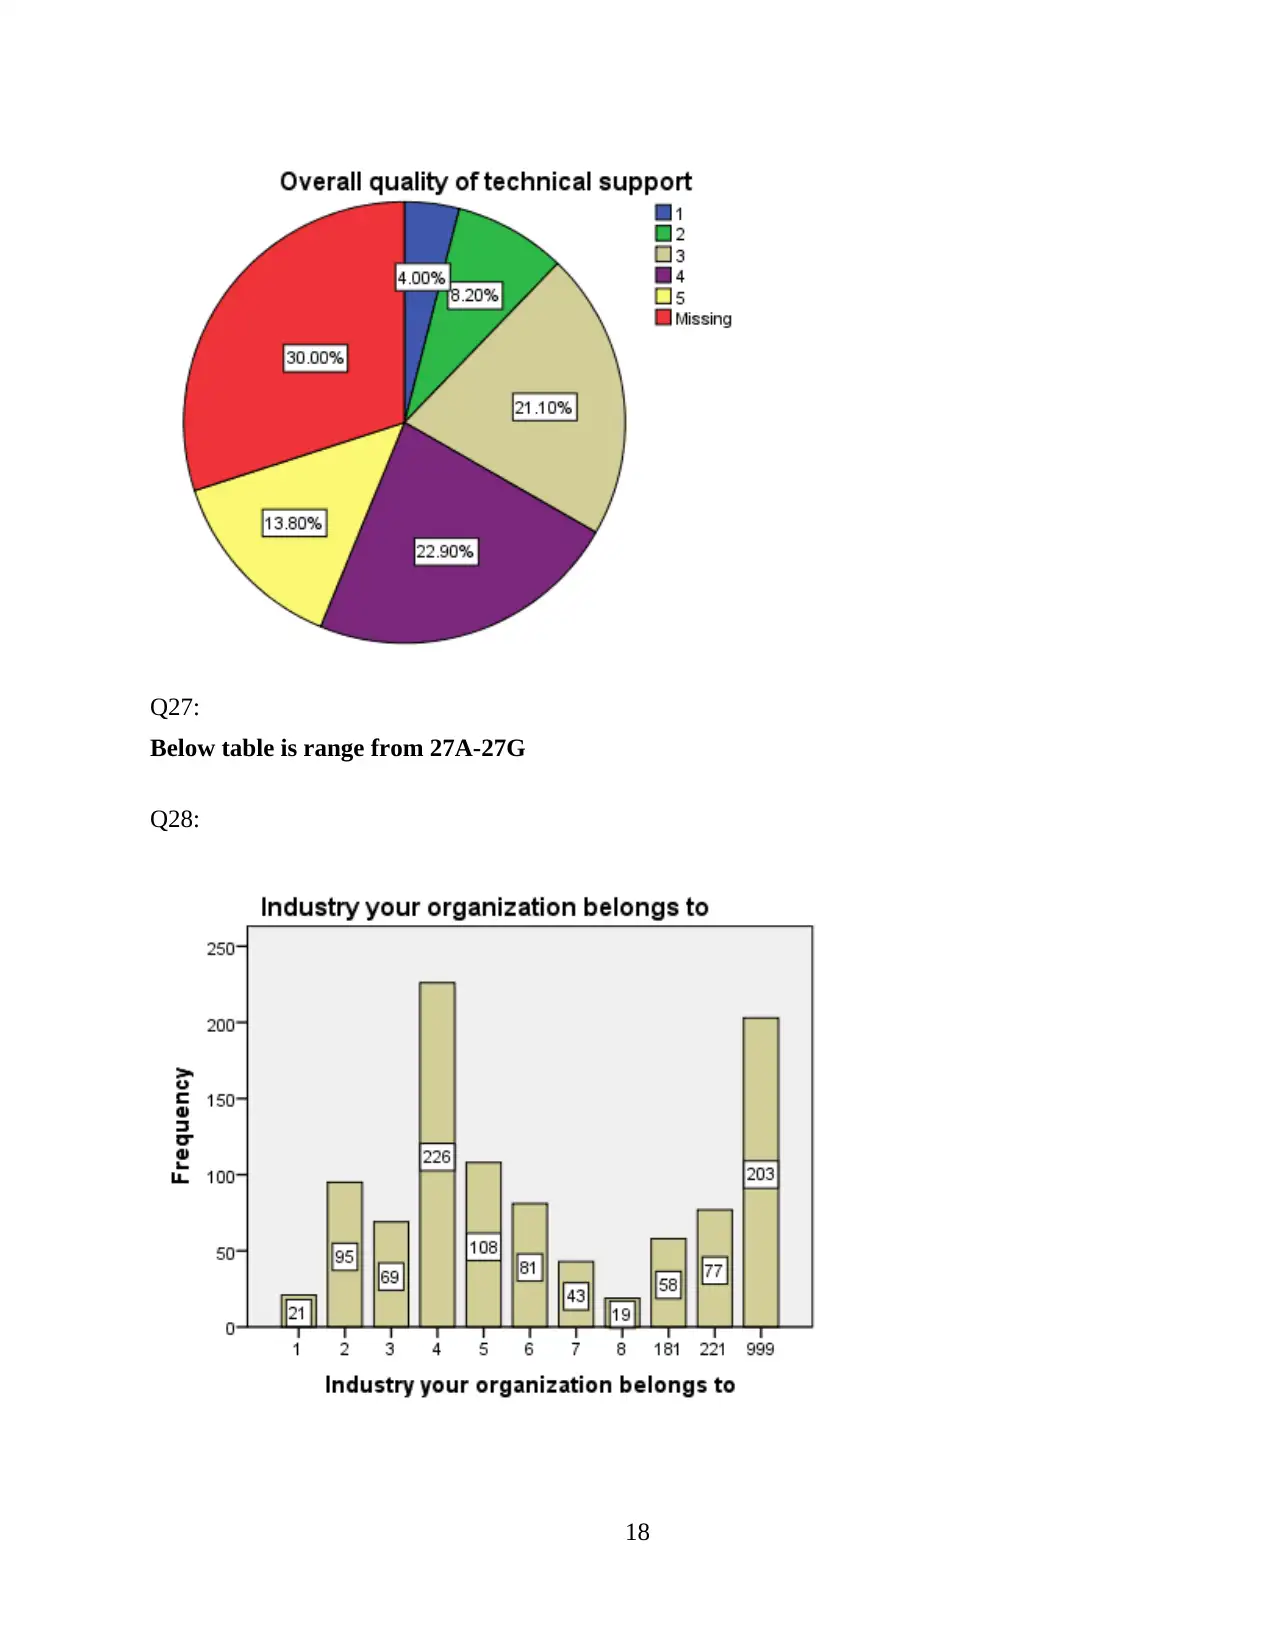
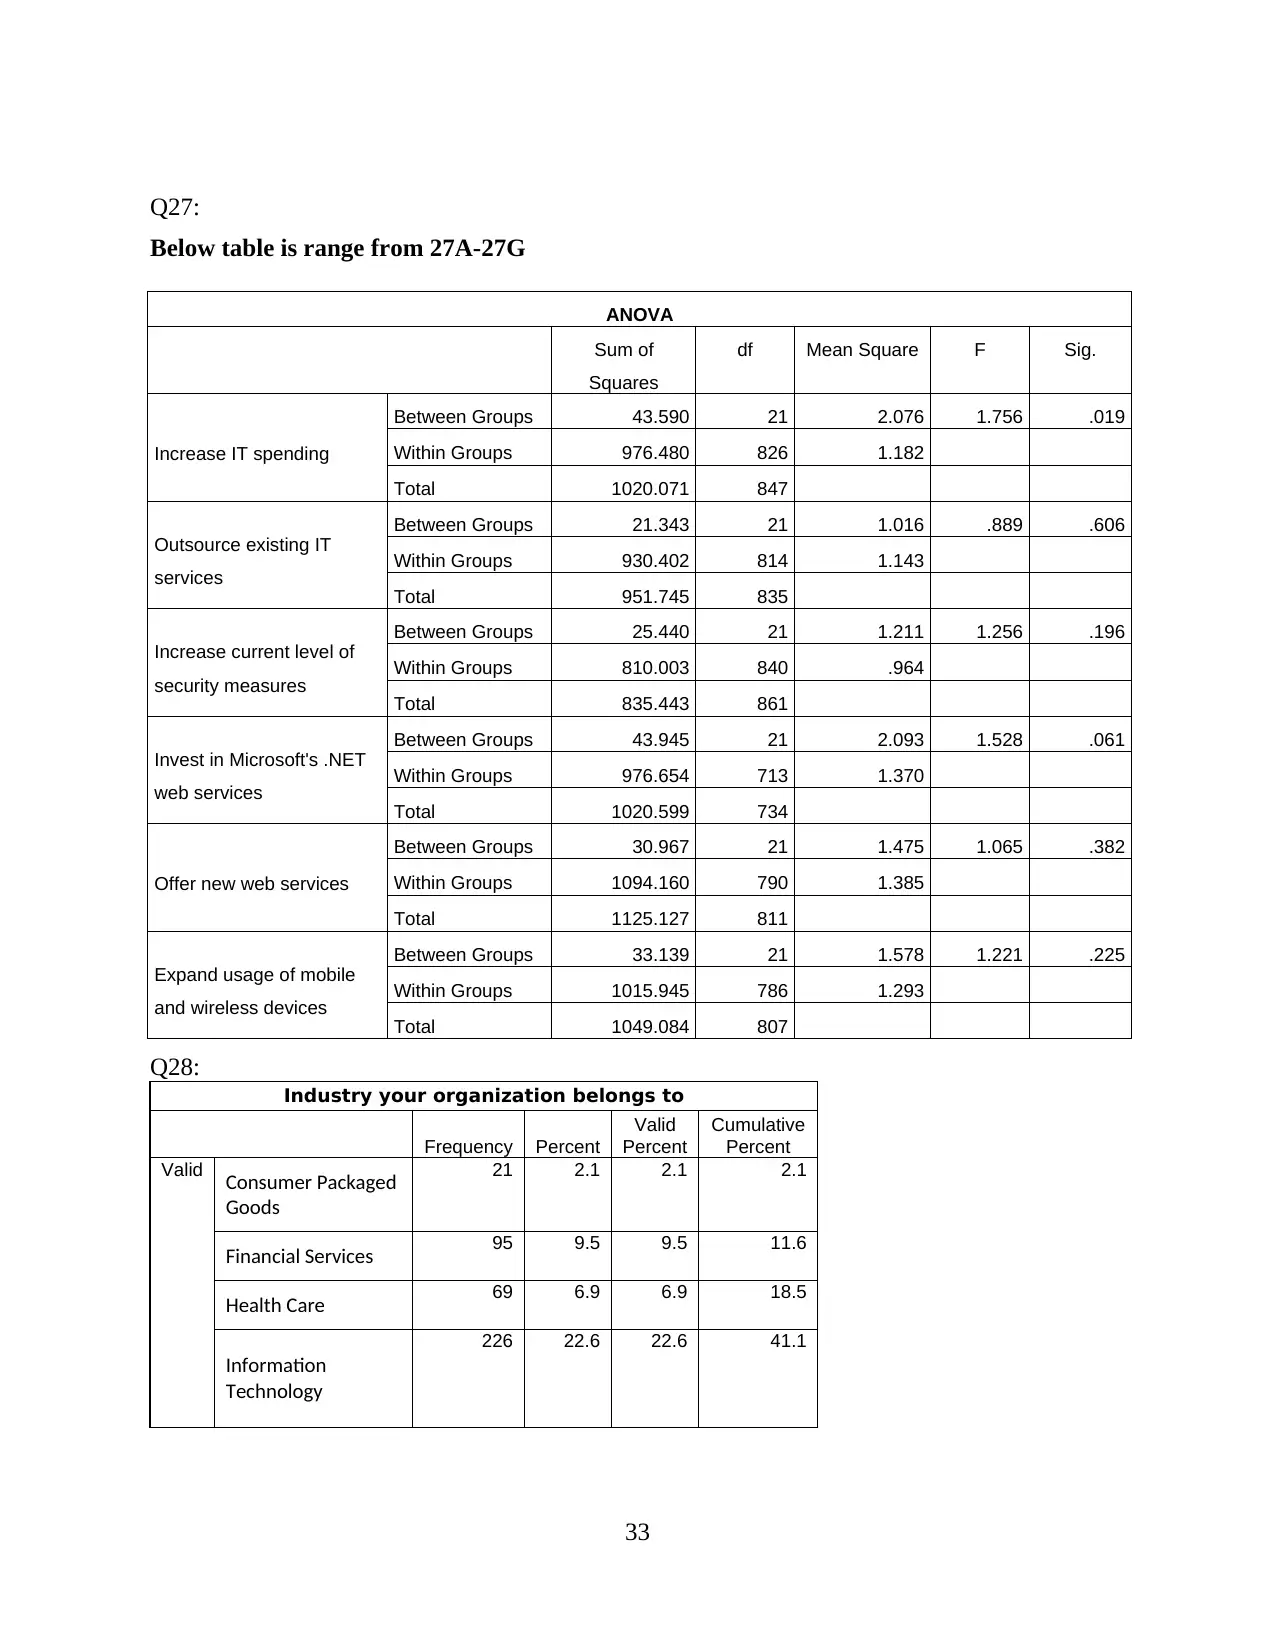
Q27:
Below table is range from 27A-27G
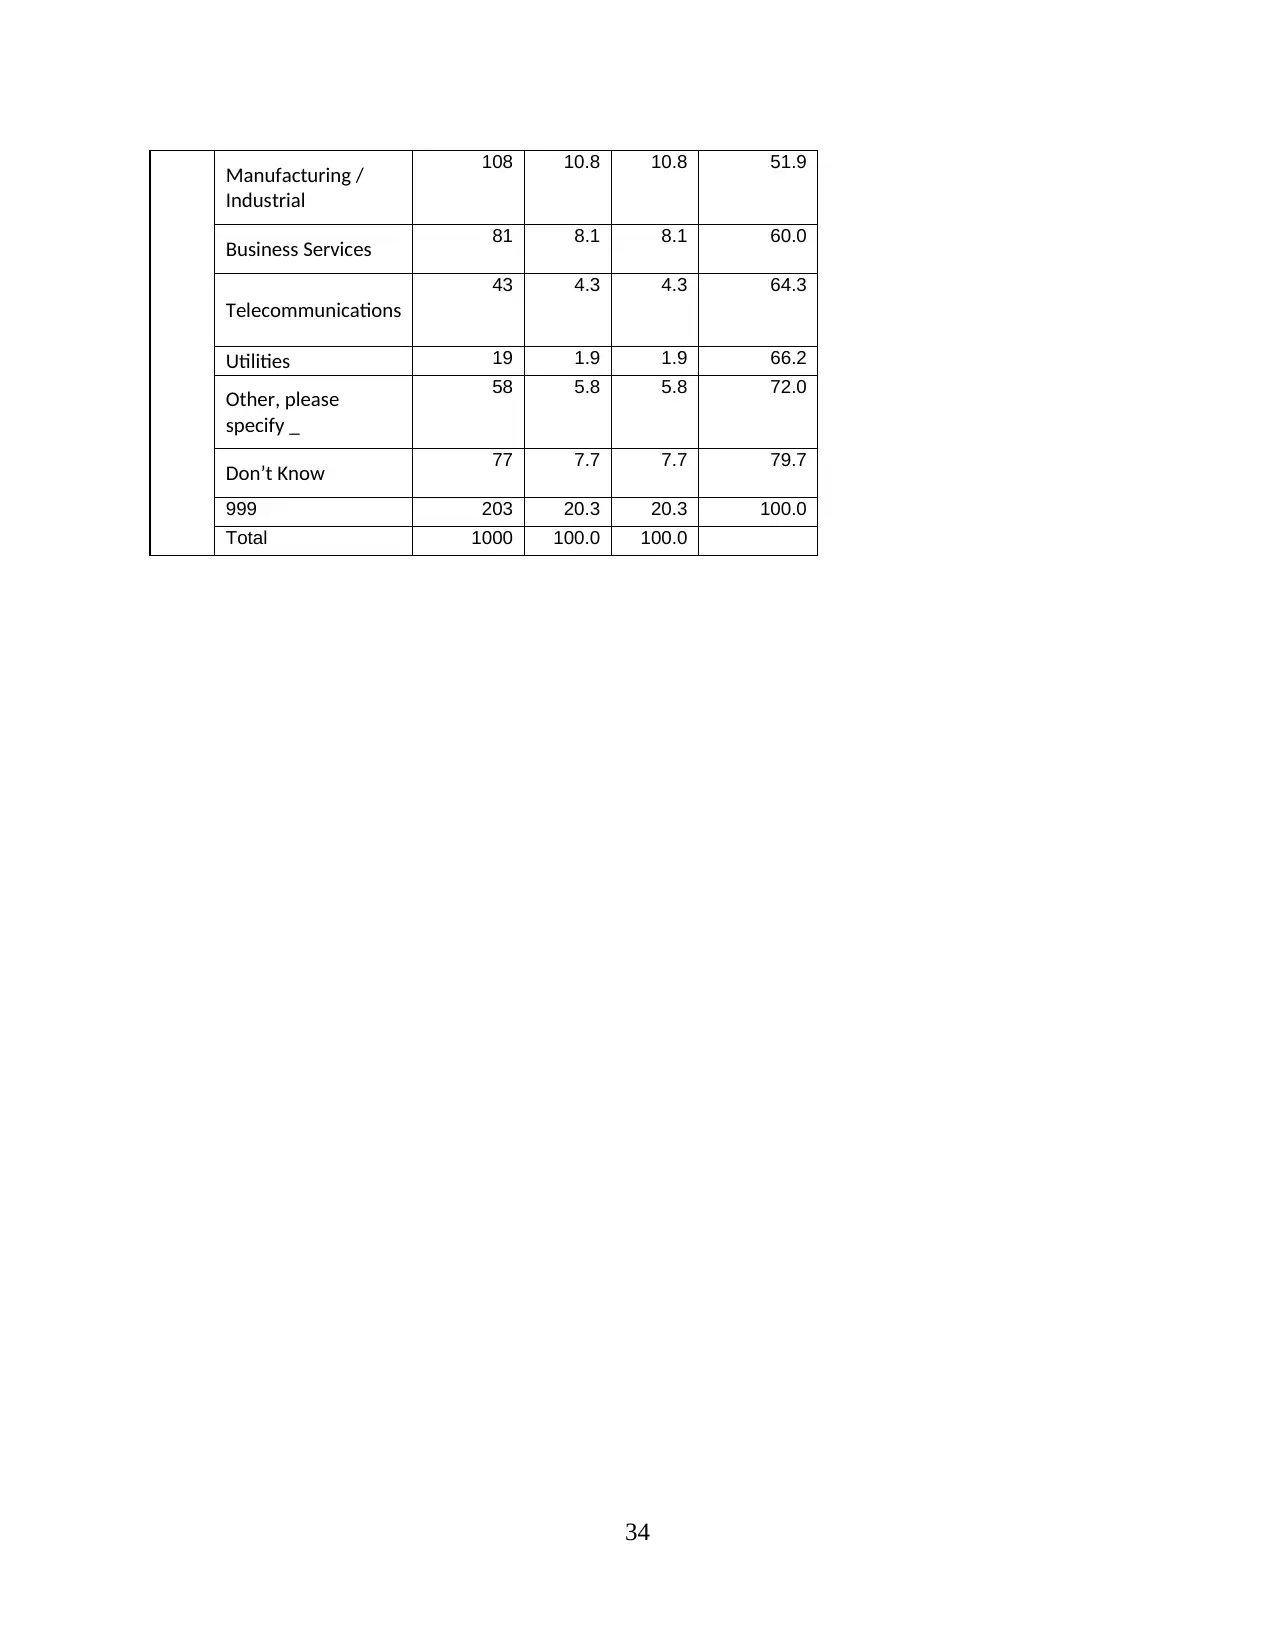
Q28:
18
Below table is range from 27A-27G
Q28:
18
REFERENCES
Books and journals:
Crouch, S. and Housden, M., 2012. Marketing research for managers. Routledge.
Bellenger, D. N., Bernhardt, K. L. and Goldstucker, J. L., 2011. Qualitative research in
marketing. Marketing Classics Press.
Wierenga, B., 2011. Managerial decision making in marketing: The next research
frontier. International Journal of Research in Marketing. 28(2). pp.89-101.
Cambra-Fierro, J. and Wilson, A., 2011. Qualitative data analysis software: Will it ever become
mainstream? Evidence from Spain. International Journal of Market Research. 53(1).
pp.17-24.
19
Paraphrase This Document
Need a fresh take? Get an instant paraphrase of this document with our AI Paraphraser
APPENDICES
Q1:
Statistics
Role within your company
N Valid 1000
Missing 0
Mean 2.49
Median 3.00
Sum 2493
Role within your company
Frequency Percent Valid Percent Cumulative
Percent
Valid
IT Decision Maker 125 12.5 12.5 12.5
IT Influencer 257 25.7 25.7 38.2
IT Staff 618 61.8 61.8 100.0
Total 1000 100.0 100.0
Q2:
Number of employees in your organization
Frequency Percent Valid Percent Cumulative
Percent
Valid
1 200 20.0 20.0 20.0
2 71 7.1 7.1 27.1
3 159 15.9 15.9 43.0
4 99 9.9 9.9 52.9
5 171 17.1 17.1 70.0
6 92 9.2 9.2 79.2
7 208 20.8 20.8 100.0
Total 1000 100.0 100.0
Q3:
Vendor selected for evaluation
20
Frequency Percent Valid Percent Cumulative
Percent
Valid
100 40 4.0 4.0 4.0
101 9 .9 .9 4.9
102 90 9.0 9.0 13.9
103 109 10.9 10.9 24.8
104 17 1.7 1.7 26.5
105 41 4.1 4.1 30.6
106 17 1.7 1.7 32.3
107 88 8.8 8.8 41.1
108 15 1.5 1.5 42.6
109 16 1.6 1.6 44.2
110 (IBM) 250 25.0 25.0 69.2
111 9 .9 .9 70.1
112 7 .7 .7 70.8
113 8 .8 .8 71.6
114 48 4.8 4.8 76.4
115 19 1.9 1.9 78.3
116 7 .7 .7 79.0
117 11 1.1 1.1 80.1
118 14 1.4 1.4 81.5
119 38 3.8 3.8 85.3
120 14 1.4 1.4 86.7
999 133 13.3 13.3 100.0
Total 1000 100.0 100.0
Q4:
Overall satisfaction
Frequency Percent
Valid
Percent
Cumulative
Percent
Valid Very
Dissatisfied
9 .9 1.0 1.0
Dissatisfied 32 3.2 3.6 4.6
Neutral 107 10.7 11.9 16.4
Satisfied 471 47.1 52.3 68.7
Very 282 28.2 31.3 100.0
21
Percent
Valid
100 40 4.0 4.0 4.0
101 9 .9 .9 4.9
102 90 9.0 9.0 13.9
103 109 10.9 10.9 24.8
104 17 1.7 1.7 26.5
105 41 4.1 4.1 30.6
106 17 1.7 1.7 32.3
107 88 8.8 8.8 41.1
108 15 1.5 1.5 42.6
109 16 1.6 1.6 44.2
110 (IBM) 250 25.0 25.0 69.2
111 9 .9 .9 70.1
112 7 .7 .7 70.8
113 8 .8 .8 71.6
114 48 4.8 4.8 76.4
115 19 1.9 1.9 78.3
116 7 .7 .7 79.0
117 11 1.1 1.1 80.1
118 14 1.4 1.4 81.5
119 38 3.8 3.8 85.3
120 14 1.4 1.4 86.7
999 133 13.3 13.3 100.0
Total 1000 100.0 100.0
Q4:
Overall satisfaction
Frequency Percent
Valid
Percent
Cumulative
Percent
Valid Very
Dissatisfied
9 .9 1.0 1.0
Dissatisfied 32 3.2 3.6 4.6
Neutral 107 10.7 11.9 16.4
Satisfied 471 47.1 52.3 68.7
Very 282 28.2 31.3 100.0
21
Satisfied
Total 901 90.1 100.0
Missing 8 3 .3
Don’t
know
6 .6
System 90 9.0
Total 99 9.9
Total 1000 100.0
Q5:
Overall quality
Frequency Percent Valid Percent Cumulative
Percent
Valid
Poor 19 1.9 2.1 2.1
Fair 56 5.6 6.3 8.4
Good 196 19.6 21.9 30.3
Very Good 368 36.8 41.2 71.5
Excellent 255 25.5 28.5 100.0
Total 894 89.4 100.0
Missing
8 7 .7
Don’t know 9 .9
System 90 9.0
Total 106 10.6
Total 1000 100.0
Q6:
Total cost of ownership
Frequency Percent Valid Percent Cumulative
Percent
Valid
Very Low 13 1.3 1.6 1.6
Low 43 4.3 5.4 7.1
Moderate 327 32.7 41.4 48.5
High 283 28.3 35.8 84.3
Very High 124 12.4 15.7 100.0
Total 790 79.0 100.0
Missing 8 3 .3
Don’t know 117 11.7
22
Secure Best Marks with AI Grader
Need help grading? Try our AI Grader for instant feedback on your assignments.
System 90 9.0
Total 210 21.0
Total 1000 100.0
Q7:
Value offered
Frequency Percent Valid Percent Cumulative
Percent
Valid
Poor 27 2.7 3.2 3.2
Marginal 80 8.0 9.5 12.8
Good 265 26.5 31.6 44.3
Very Good 327 32.7 39.0 83.3
Excellent 140 14.0 16.7 100.0
Total 839 83.9 100.0
Missing
8 3 .3
Don’t know 68 6.8
System 90 9.0
Total 161 16.1
Total 1000 100.0
Q8:
Company cares about the society
Frequency Percent Valid Percent Cumulative
Percent
Valid
Strongly
Disagree 21 2.1 3.1 3.1
Disagree 46 4.6 6.8 9.9
Neither
Agree
nor
Disagree
338 33.8 49.9 59.7
Agree 188 18.8 27.7 87.5
Strongly
Agree 85 8.5 12.5 100.0
Total 678 67.8 100.0
Missing 8 6 .6
Don’t
know 217 21.7
System 99 9.9
23
Total 322 32.2
Total 1000 100.0
Q9:
Highly ethical company
Frequency Percent Valid Percent Cumulative
Percent
Valid
Strongly
Disagree 33 3.3 4.5 4.5
Disagree 75 7.5 10.2 14.7
Neither
Agree
nor
Disagree
302 30.2 41.1 55.8
Agree 247 24.7 33.6 89.4
Strongly
Agree 78 7.8 10.6 100.0
Total 735 73.5 100.0
Missing
8 4 .4
Don’t
know 162 16.2
System 99 9.9
Total 265 26.5
Total 1000 100.0
Q10:
Leader in the IT industry
Frequency Percent Valid Percent Cumulative
Percent
Valid
Strongly
Disagree 2 .2 .2 .2
Disagree 20 2.0 2.3 2.5
Neither
Agree
nor
Disagree
101 10.1 11.4 13.9
Agree 398 39.8 44.8 58.7
Strongly
Agree 367 36.7 41.3 100.0
Total 888 88.8 100.0
Missing 8 5 .5
Don’t
know 8 .8
24
Total 1000 100.0
Q9:
Highly ethical company
Frequency Percent Valid Percent Cumulative
Percent
Valid
Strongly
Disagree 33 3.3 4.5 4.5
Disagree 75 7.5 10.2 14.7
Neither
Agree
nor
Disagree
302 30.2 41.1 55.8
Agree 247 24.7 33.6 89.4
Strongly
Agree 78 7.8 10.6 100.0
Total 735 73.5 100.0
Missing
8 4 .4
Don’t
know 162 16.2
System 99 9.9
Total 265 26.5
Total 1000 100.0
Q10:
Leader in the IT industry
Frequency Percent Valid Percent Cumulative
Percent
Valid
Strongly
Disagree 2 .2 .2 .2
Disagree 20 2.0 2.3 2.5
Neither
Agree
nor
Disagree
101 10.1 11.4 13.9
Agree 398 39.8 44.8 58.7
Strongly
Agree 367 36.7 41.3 100.0
Total 888 88.8 100.0
Missing 8 5 .5
Don’t
know 8 .8
24
System 99 9.9
Total 112 11.2
Total 1000 100.0
Q11:
Innovative company
Frequency Percent Valid Percent Cumulative
Percent
Valid
Strongly
Disagree 9 .9 1.0 1.0
Disagree 33 3.3 3.8 4.8
Neither
Agree
nor
Disagree
147 14.7 16.7 21.5
Agree 437 43.7 49.7 71.1
Strongly
Agree 254 25.4 28.9 100.0
Total 880 88.0 100.0
Missing
8 4 .4
Don’t
know 17 1.7
System 99 9.9
Total 120 12.0
Total 1000 100.0
Q12:
Company has strong capable senior leaders
Frequency Percent Valid Percent Cumulative
Percent
Valid
Strongly
Disagree 15 1.5 2.0 2.0
Disagree 25 2.5 3.4 5.4
Neither
Agree nor
Disagree 242 24.2 32.9 38.3
Agree 282 28.2 38.3 76.6
Strongly
Agree 172 17.2 23.4 100.0
Total 736 73.6 100.0
Missing 8 3 .3
Don’t
know 162 16.2
25
Paraphrase This Document
Need a fresh take? Get an instant paraphrase of this document with our AI Paraphraser
System 99 9.9
Total 264 26.4
Total 1000 100.0
Q13:
Financially sound company
Frequency Percent Valid Percent Cumulative
Percent
Valid
Strongly
Disagree 6 .6 .7 .7
Disagree 28 2.8 3.5 4.2
Neither
Agree
nor
Disagree
152 15.2 18.9 23.2
Agree 397 39.7 49.4 72.6
Strongly
Agree 220 22.0 27.4 100.0
Total 803 80.3 100.0
Missing
8 7 .7
Don’t
know 91 9.1
System 99 9.9
Total 197 19.7
Total 1000 100.0
Q14:
Company I can trust
Frequency Percent Valid Percent Cumulative
Percent
Valid
Strongly
Disagree 20 2.0 2.3 2.3
Disagree 44 4.4 5.0 7.3
Neither
Agree
nor
Disagree
196 19.6 22.4 29.7
Agree 414 41.4 47.3 77.0
Strongly
Agree 201 20.1 23.0 100.0
Total 875 87.5 100.0
Missing 8 6 .6
Don’t
know 20 2.0
System 99 9.9
26
Total 125 12.5
Total 1000 100.0
Q15:
Company has advertising I really like
Frequency Percent Valid Percent Cumulative
Percent
Valid
Strongly
Disagree 14 1.4 1.7 1.7
Disagree 38 3.8 4.7 6.5
Neither
Agree
nor
Disagree
427 42.7 53.0 59.4
Agree 223 22.3 27.7 87.1
Strongly
Agree 104 10.4 12.9 100.0
Total 806 80.6 100.0
Missing
8 8 .8
Don’t
know 87 8.7
System 99 9.9
Total 194 19.4
Total 1000 100.0
Q16:
Known for treating its employees well
Frequency Percent Valid Percent Cumulative
Percent
Valid
Strongly
Disagree 14 1.4 2.3 2.3
Disagree 36 3.6 5.8 8.1
Neither
Agree
nor
Disagree
276 27.6 44.8 52.9
Agree 198 19.8 32.1 85.1
Strongly
Agree 92 9.2 14.9 100.0
Total 616 61.6 100.0
Missing 8 9 .9
27
Total 1000 100.0
Q15:
Company has advertising I really like
Frequency Percent Valid Percent Cumulative
Percent
Valid
Strongly
Disagree 14 1.4 1.7 1.7
Disagree 38 3.8 4.7 6.5
Neither
Agree
nor
Disagree
427 42.7 53.0 59.4
Agree 223 22.3 27.7 87.1
Strongly
Agree 104 10.4 12.9 100.0
Total 806 80.6 100.0
Missing
8 8 .8
Don’t
know 87 8.7
System 99 9.9
Total 194 19.4
Total 1000 100.0
Q16:
Known for treating its employees well
Frequency Percent Valid Percent Cumulative
Percent
Valid
Strongly
Disagree 14 1.4 2.3 2.3
Disagree 36 3.6 5.8 8.1
Neither
Agree
nor
Disagree
276 27.6 44.8 52.9
Agree 198 19.8 32.1 85.1
Strongly
Agree 92 9.2 14.9 100.0
Total 616 61.6 100.0
Missing 8 9 .9
27
Don’t
know 276 27.6
System 99 9.9
Total 384 38.4
Total 1000 100.0
Q17:
Company does its fair share to help society
Frequency Percent Valid Percent Cumulative
Percent
Valid
Strongly
Disagree 12 1.2 2.1 2.1
Disagree 33 3.3 5.7 7.8
Neither
Agree
nor
Disagree
272 27.2 47.1 54.9
Agree 183 18.3 31.7 86.7
Strongly
Agree 77 7.7 13.3 100.0
Total 577 57.7 100.0
Missing
8 1 .1
Don’t
know 315 31.5
System 107 10.7
Total 423 42.3
Total 1000 100.0
Q18:
Continue purchasing from this company next year
Frequency Percent Valid Percent Cumulative
Percent
Valid Not at all
Likely 5 .5 .6 .6
Not Very
Likely 24 2.4 2.9 3.5
Somewhat
Likely 120 12.0 14.5 18.0
Very Likely 324 32.4 39.0 57.0
28
Secure Best Marks with AI Grader
Need help grading? Try our AI Grader for instant feedback on your assignments.
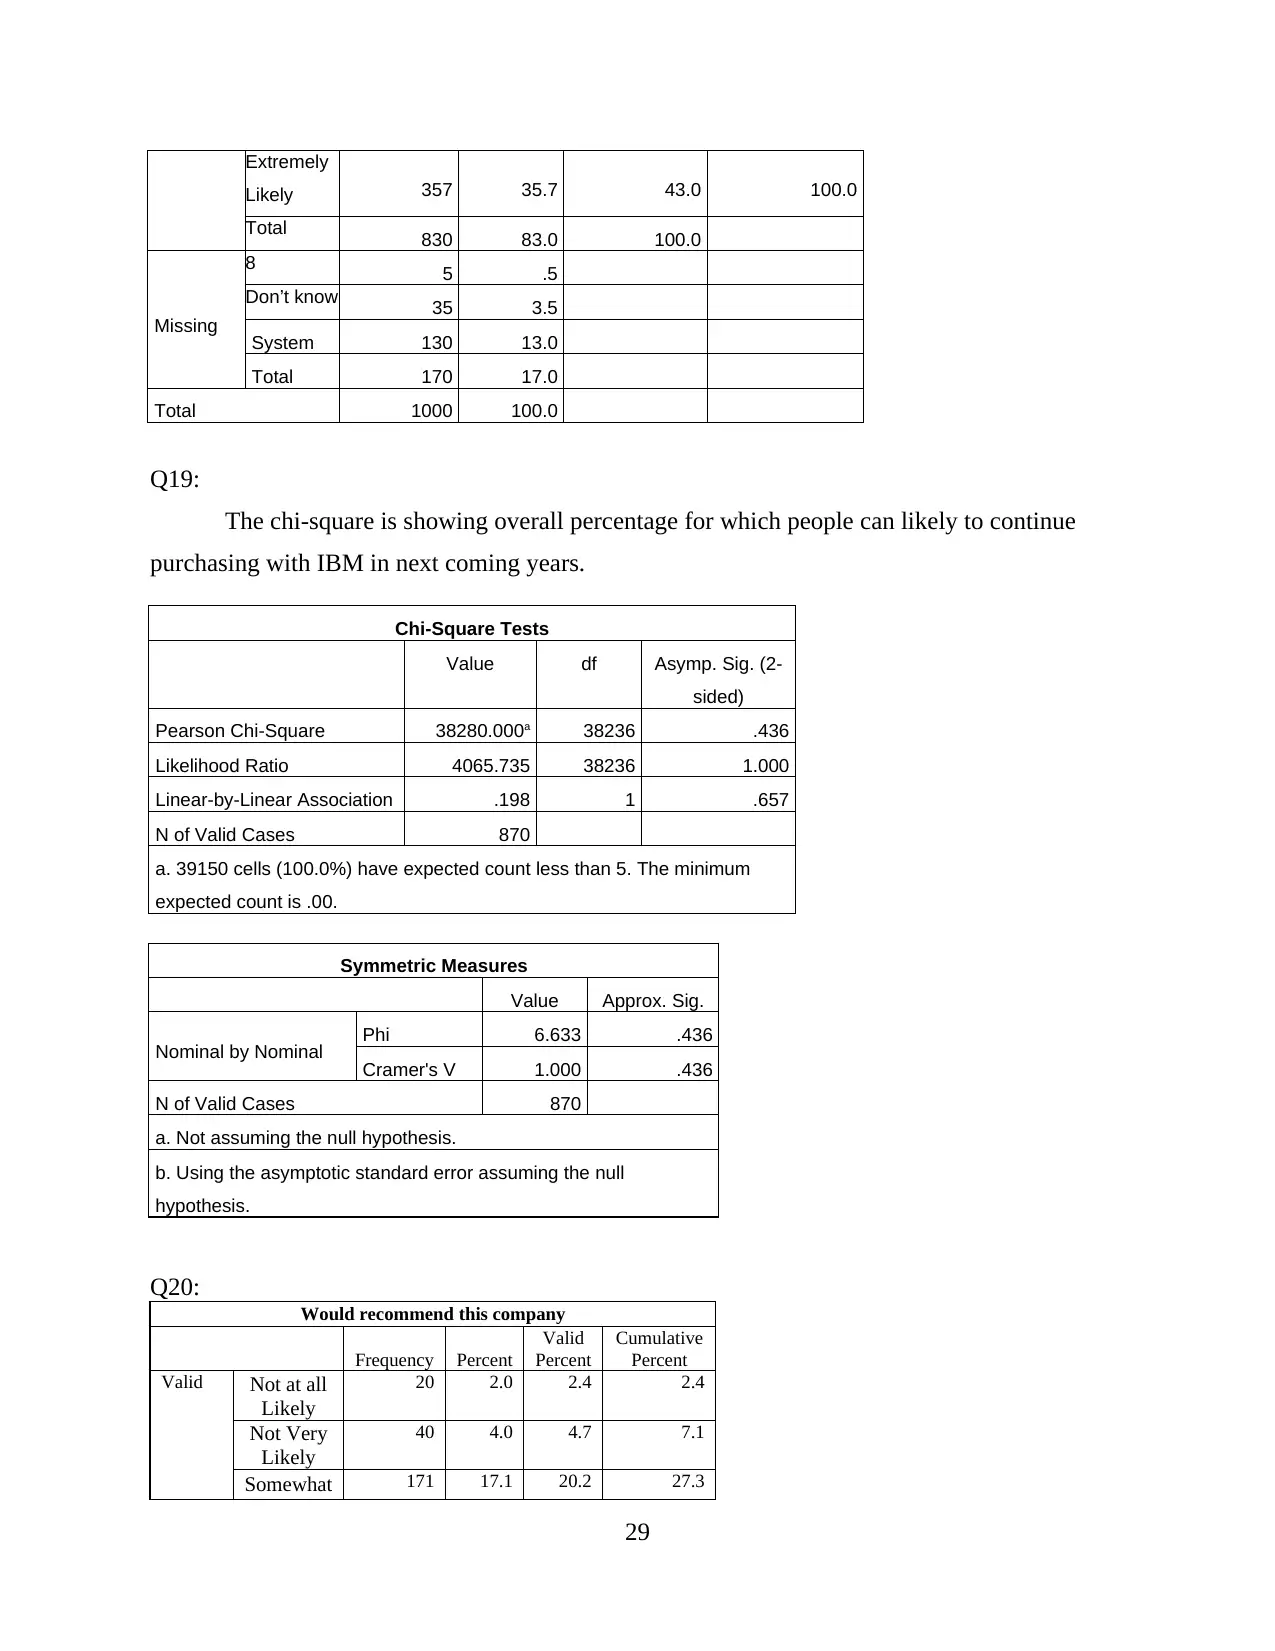
Extremely
Likely 357 35.7 43.0 100.0
Total 830 83.0 100.0
Missing
8 5 .5
Don’t know 35 3.5
System 130 13.0
Total 170 17.0
Total 1000 100.0
Q19:
The chi-square is showing overall percentage for which people can likely to continue
purchasing with IBM in next coming years.
Chi-Square Tests
Value df Asymp. Sig. (2-
sided)
Pearson Chi-Square 38280.000a 38236 .436
Likelihood Ratio 4065.735 38236 1.000
Linear-by-Linear Association .198 1 .657
N of Valid Cases 870
a. 39150 cells (100.0%) have expected count less than 5. The minimum
expected count is .00.
Symmetric Measures
Value Approx. Sig.
Nominal by Nominal Phi 6.633 .436
Cramer's V 1.000 .436
N of Valid Cases 870
a. Not assuming the null hypothesis.
b. Using the asymptotic standard error assuming the null
hypothesis.
Q20:
Would recommend this company
Frequency Percent
Valid
Percent
Cumulative
Percent
Valid Not at all
Likely
20 2.0 2.4 2.4
Not Very
Likely
40 4.0 4.7 7.1
Somewhat 171 17.1 20.2 27.3
29
Likely
Very
Likely
354 35.4 41.9 69.2
Extremely
Likely
260 26.0 30.8 100.0
Total 845 84.5 100.0
Missing 8 5 .5
Don’t
know
20 2.0
System 130 13.0
Total 155 15.5
Total 1000 100.0
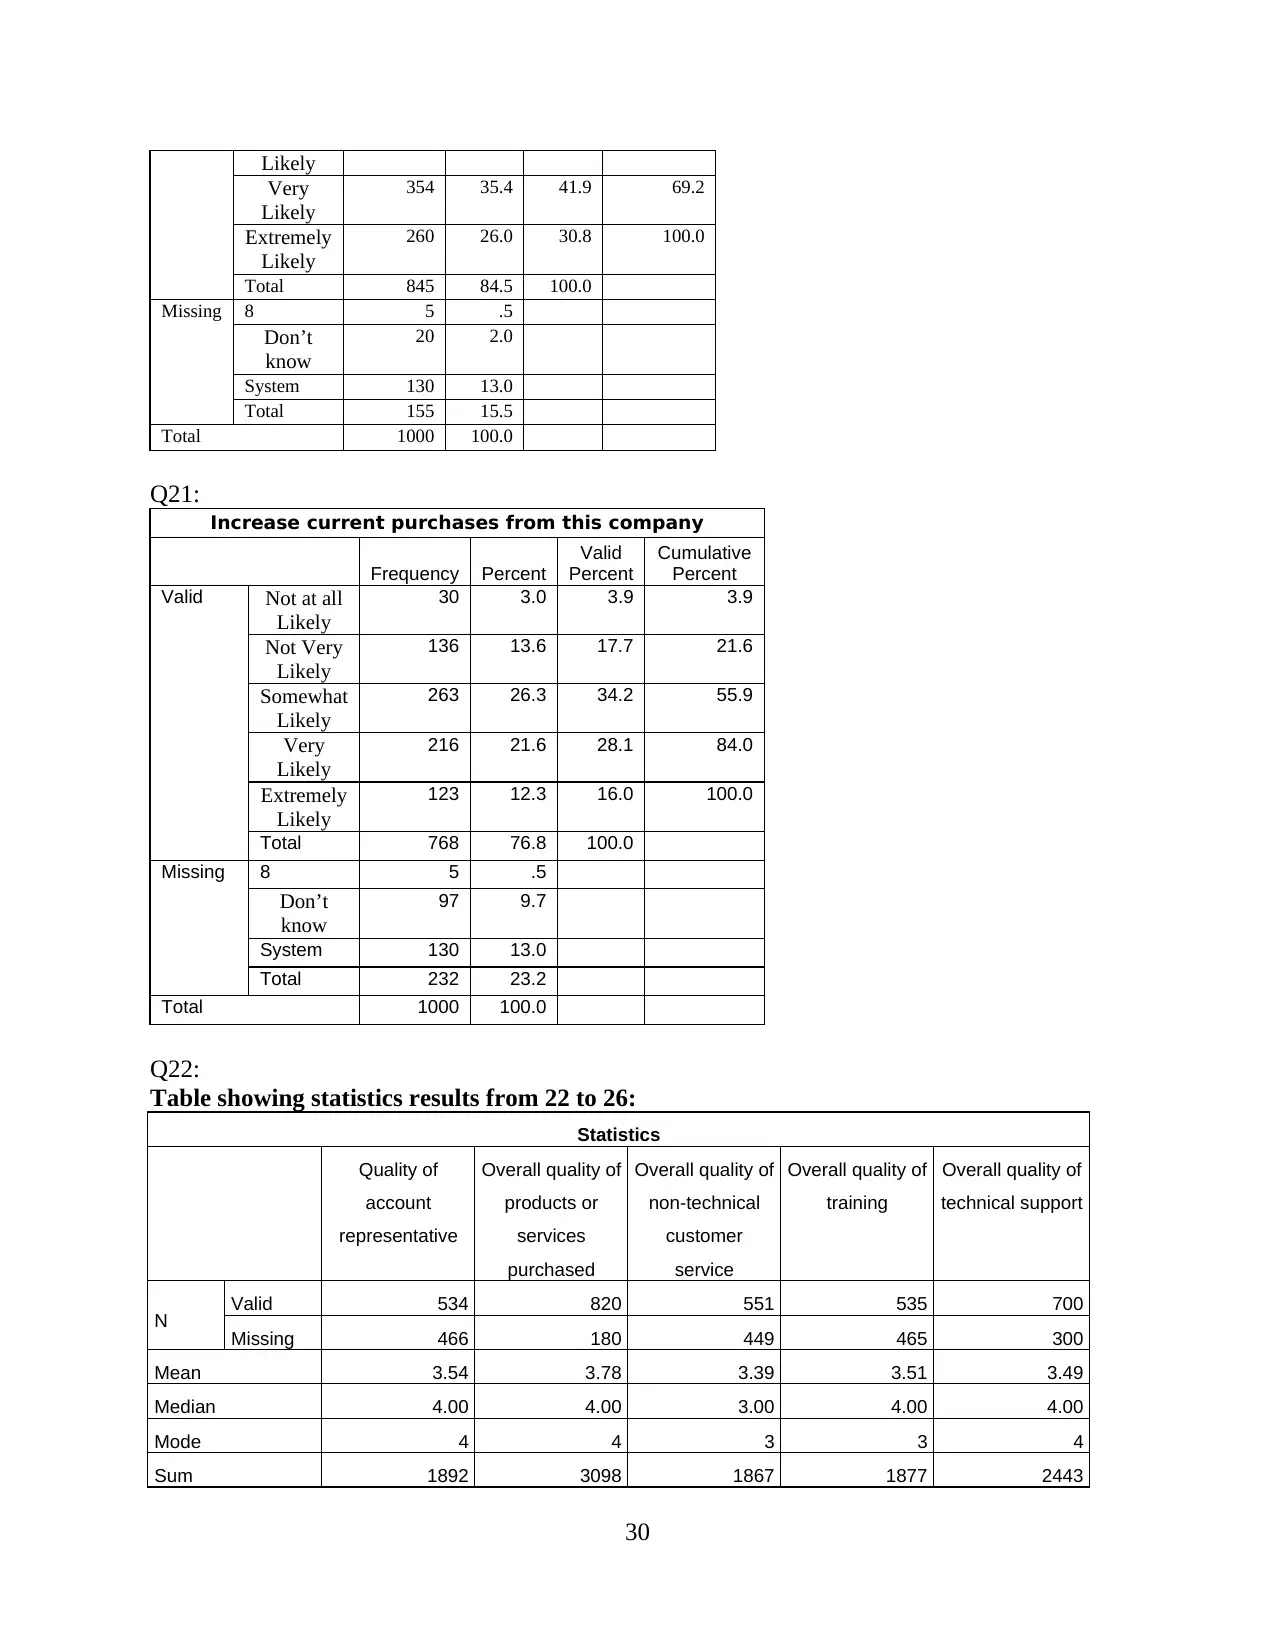
Q21:
Increase current purchases from this company
Frequency Percent
Valid
Percent
Cumulative
Percent
Valid Not at all
Likely
30 3.0 3.9 3.9
Not Very
Likely
136 13.6 17.7 21.6
Somewhat
Likely
263 26.3 34.2 55.9
Very
Likely
216 21.6 28.1 84.0
Extremely
Likely
123 12.3 16.0 100.0
Total 768 76.8 100.0
Missing 8 5 .5
Don’t
know
97 9.7
System 130 13.0
Total 232 23.2
Total 1000 100.0
Q22:
Table showing statistics results from 22 to 26:
Statistics
Quality of
account
representative
Overall quality of
products or
services
purchased
Overall quality of
non-technical
customer
service
Overall quality of
training
Overall quality of
technical support
N Valid 534 820 551 535 700
Missing 466 180 449 465 300
Mean 3.54 3.78 3.39 3.51 3.49
Median 4.00 4.00 3.00 4.00 4.00
Mode 4 4 3 3 4
Sum 1892 3098 1867 1877 2443
30
Very
Likely
354 35.4 41.9 69.2
Extremely
Likely
260 26.0 30.8 100.0
Total 845 84.5 100.0
Missing 8 5 .5
Don’t
know
20 2.0
System 130 13.0
Total 155 15.5
Total 1000 100.0
Q21:
Increase current purchases from this company
Frequency Percent
Valid
Percent
Cumulative
Percent
Valid Not at all
Likely
30 3.0 3.9 3.9
Not Very
Likely
136 13.6 17.7 21.6
Somewhat
Likely
263 26.3 34.2 55.9
Very
Likely
216 21.6 28.1 84.0
Extremely
Likely
123 12.3 16.0 100.0
Total 768 76.8 100.0
Missing 8 5 .5
Don’t
know
97 9.7
System 130 13.0
Total 232 23.2
Total 1000 100.0
Q22:
Table showing statistics results from 22 to 26:
Statistics
Quality of
account
representative
Overall quality of
products or
services
purchased
Overall quality of
non-technical
customer
service
Overall quality of
training
Overall quality of
technical support
N Valid 534 820 551 535 700
Missing 466 180 449 465 300
Mean 3.54 3.78 3.39 3.51 3.49
Median 4.00 4.00 3.00 4.00 4.00
Mode 4 4 3 3 4
Sum 1892 3098 1867 1877 2443
30
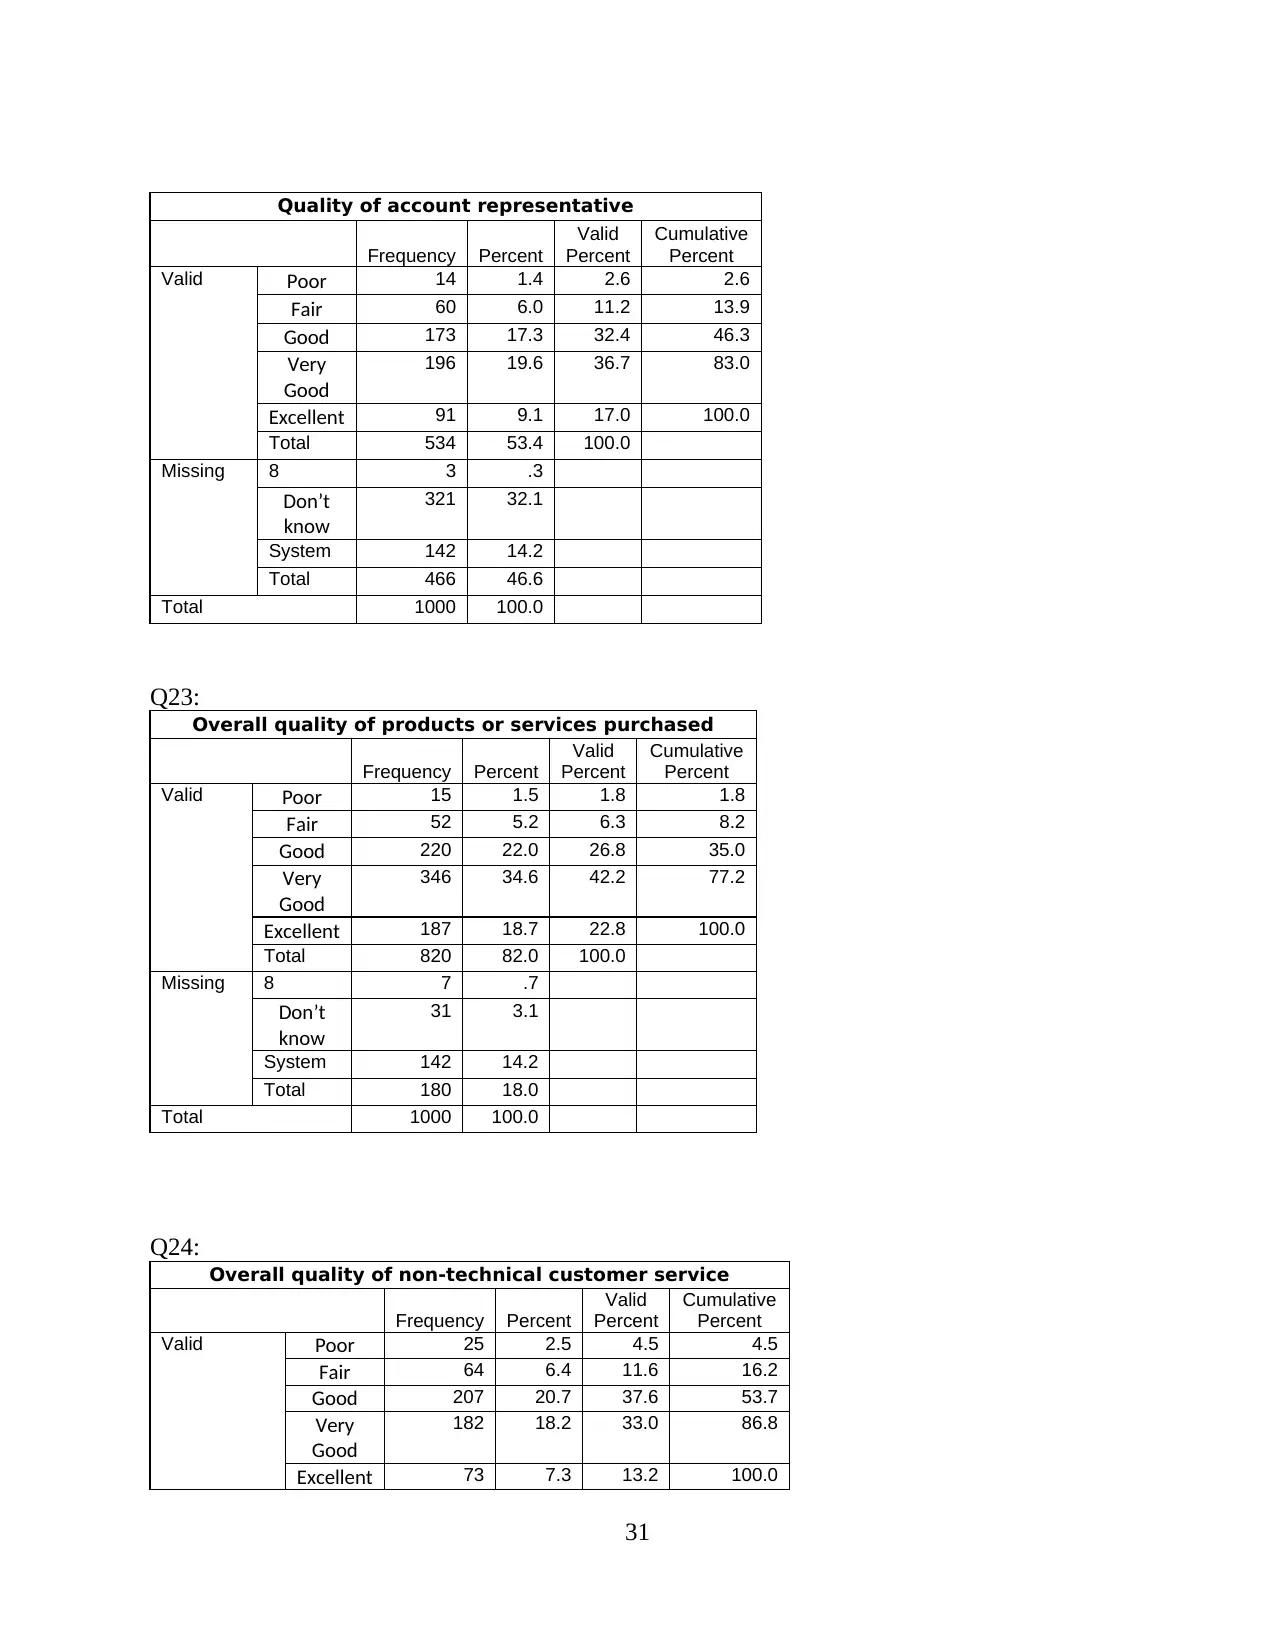
Quality of account representative
Frequency Percent
Valid
Percent
Cumulative
Percent
Valid Poor 14 1.4 2.6 2.6
Fair 60 6.0 11.2 13.9
Good 173 17.3 32.4 46.3
Very
Good
196 19.6 36.7 83.0
Excellent 91 9.1 17.0 100.0
Total 534 53.4 100.0
Missing 8 3 .3
Don’t
know
321 32.1
System 142 14.2
Total 466 46.6
Total 1000 100.0
Q23:
Overall quality of products or services purchased
Frequency Percent
Valid
Percent
Cumulative
Percent
Valid Poor 15 1.5 1.8 1.8
Fair 52 5.2 6.3 8.2
Good 220 22.0 26.8 35.0
Very
Good
346 34.6 42.2 77.2
Excellent 187 18.7 22.8 100.0
Total 820 82.0 100.0
Missing 8 7 .7
Don’t
know
31 3.1
System 142 14.2
Total 180 18.0
Total 1000 100.0
Q24:
Overall quality of non-technical customer service
Frequency Percent
Valid
Percent
Cumulative
Percent
Valid Poor 25 2.5 4.5 4.5
Fair 64 6.4 11.6 16.2
Good 207 20.7 37.6 53.7
Very
Good
182 18.2 33.0 86.8
Excellent 73 7.3 13.2 100.0
31
Frequency Percent
Valid
Percent
Cumulative
Percent
Valid Poor 14 1.4 2.6 2.6
Fair 60 6.0 11.2 13.9
Good 173 17.3 32.4 46.3
Very
Good
196 19.6 36.7 83.0
Excellent 91 9.1 17.0 100.0
Total 534 53.4 100.0
Missing 8 3 .3
Don’t
know
321 32.1
System 142 14.2
Total 466 46.6
Total 1000 100.0
Q23:
Overall quality of products or services purchased
Frequency Percent
Valid
Percent
Cumulative
Percent
Valid Poor 15 1.5 1.8 1.8
Fair 52 5.2 6.3 8.2
Good 220 22.0 26.8 35.0
Very
Good
346 34.6 42.2 77.2
Excellent 187 18.7 22.8 100.0
Total 820 82.0 100.0
Missing 8 7 .7
Don’t
know
31 3.1
System 142 14.2
Total 180 18.0
Total 1000 100.0
Q24:
Overall quality of non-technical customer service
Frequency Percent
Valid
Percent
Cumulative
Percent
Valid Poor 25 2.5 4.5 4.5
Fair 64 6.4 11.6 16.2
Good 207 20.7 37.6 53.7
Very
Good
182 18.2 33.0 86.8
Excellent 73 7.3 13.2 100.0
31
Paraphrase This Document
Need a fresh take? Get an instant paraphrase of this document with our AI Paraphraser
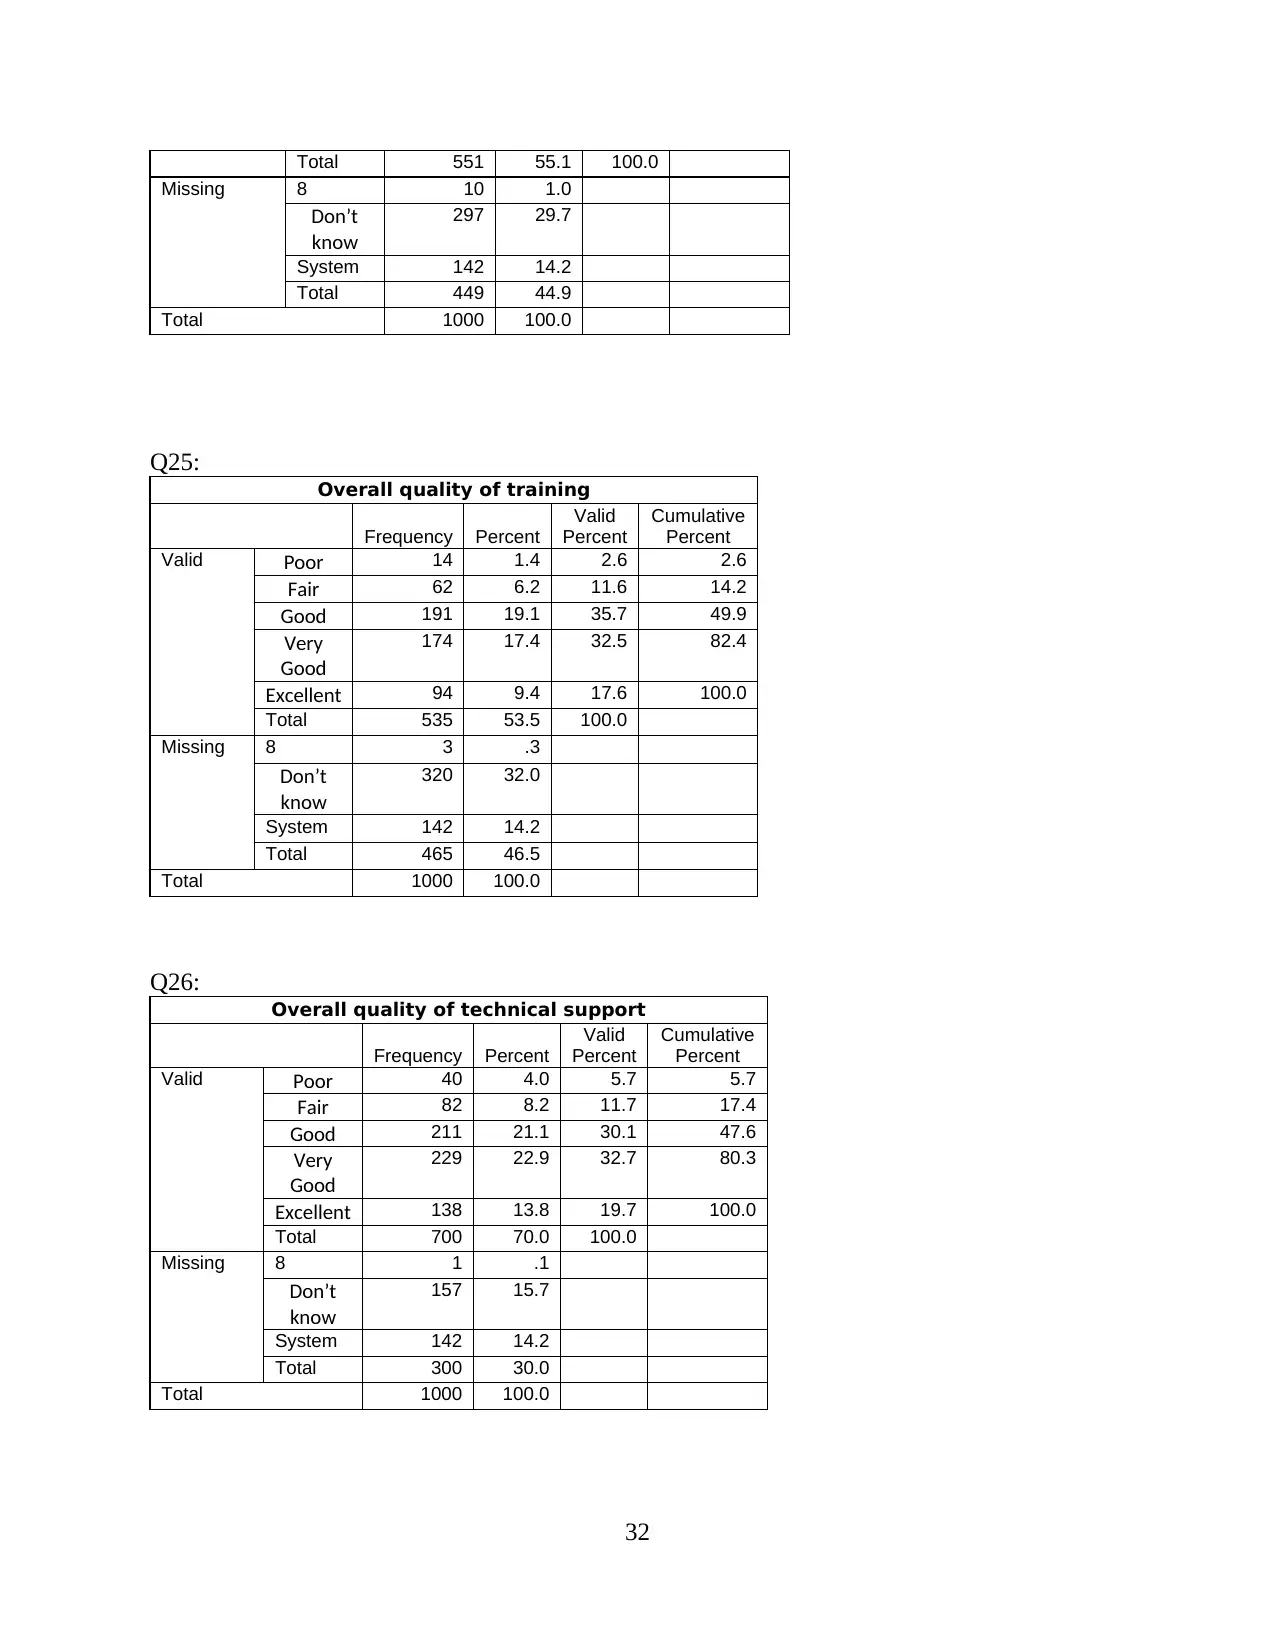
Total 551 55.1 100.0
Missing 8 10 1.0
Don’t
know
297 29.7
System 142 14.2
Total 449 44.9
Total 1000 100.0
Q25:
Overall quality of training
Frequency Percent
Valid
Percent
Cumulative
Percent
Valid Poor 14 1.4 2.6 2.6
Fair 62 6.2 11.6 14.2
Good 191 19.1 35.7 49.9
Very
Good
174 17.4 32.5 82.4
Excellent 94 9.4 17.6 100.0
Total 535 53.5 100.0
Missing 8 3 .3
Don’t
know
320 32.0
System 142 14.2
Total 465 46.5
Total 1000 100.0
Q26:
Overall quality of technical support
Frequency Percent
Valid
Percent
Cumulative
Percent
Valid Poor 40 4.0 5.7 5.7
Fair 82 8.2 11.7 17.4
Good 211 21.1 30.1 47.6
Very
Good
229 22.9 32.7 80.3
Excellent 138 13.8 19.7 100.0
Total 700 70.0 100.0
Missing 8 1 .1
Don’t
know
157 15.7
System 142 14.2
Total 300 30.0
Total 1000 100.0
32
Q27:
Below table is range from 27A-27G
ANOVA
Sum of
Squares
df Mean Square F Sig.
Increase IT spending
Between Groups 43.590 21 2.076 1.756 .019
Within Groups 976.480 826 1.182
Total 1020.071 847
Outsource existing IT
services
Between Groups 21.343 21 1.016 .889 .606
Within Groups 930.402 814 1.143
Total 951.745 835
Increase current level of
security measures
Between Groups 25.440 21 1.211 1.256 .196
Within Groups 810.003 840 .964
Total 835.443 861
Invest in Microsoft's .NET
web services
Between Groups 43.945 21 2.093 1.528 .061
Within Groups 976.654 713 1.370
Total 1020.599 734
Offer new web services
Between Groups 30.967 21 1.475 1.065 .382
Within Groups 1094.160 790 1.385
Total 1125.127 811
Expand usage of mobile
and wireless devices
Between Groups 33.139 21 1.578 1.221 .225
Within Groups 1015.945 786 1.293
Total 1049.084 807
Q28:
Industry your organization belongs to
Frequency Percent
Valid
Percent
Cumulative
Percent
Valid Consumer Packaged
Goods
21 2.1 2.1 2.1
Financial Services 95 9.5 9.5 11.6
Health Care 69 6.9 6.9 18.5
Information
Technology
226 22.6 22.6 41.1
33
Manufacturing /
Industrial
108 10.8 10.8 51.9
Business Services 81 8.1 8.1 60.0
Telecommunications
43 4.3 4.3 64.3
Utilities 19 1.9 1.9 66.2
Other, please
specify _
58 5.8 5.8 72.0
Don’t Know 77 7.7 7.7 79.7
999 203 20.3 20.3 100.0
Total 1000 100.0 100.0
34
Industrial
108 10.8 10.8 51.9
Business Services 81 8.1 8.1 60.0
Telecommunications
43 4.3 4.3 64.3
Utilities 19 1.9 1.9 66.2
Other, please
specify _
58 5.8 5.8 72.0
Don’t Know 77 7.7 7.7 79.7
999 203 20.3 20.3 100.0
Total 1000 100.0 100.0
34
1 out of 34


Your All-in-One AI-Powered Toolkit for Academic Success.
+13062052269
info@desklib.com
Available 24*7 on WhatsApp / Email
![[object Object]](/_next/static/media/star-bottom.7253800d.svg)
Unlock your academic potential
© 2024 | Zucol Services PVT LTD | All rights reserved.