Quantitative Research Methods Table Reliability Statistics Table
Added on 2020-06-05
29 Pages1669 Words137 Views
QUANTITATIVE RESEARCH METHODS
Table of ContentsQ1................................................................................................................................................................3Reliability statistics table.........................................................................................................................3Q2................................................................................................................................................................3Relationship between total optimism and Total Mastery.........................................................................3Q4................................................................................................................................................................5Gender and total mastery.........................................................................................................................5Smoker....................................................................................................................................................8Q5..............................................................................................................................................................12Marital status.........................................................................................................................................12High education limit..............................................................................................................................21REFERENCES..........................................................................................................................................29
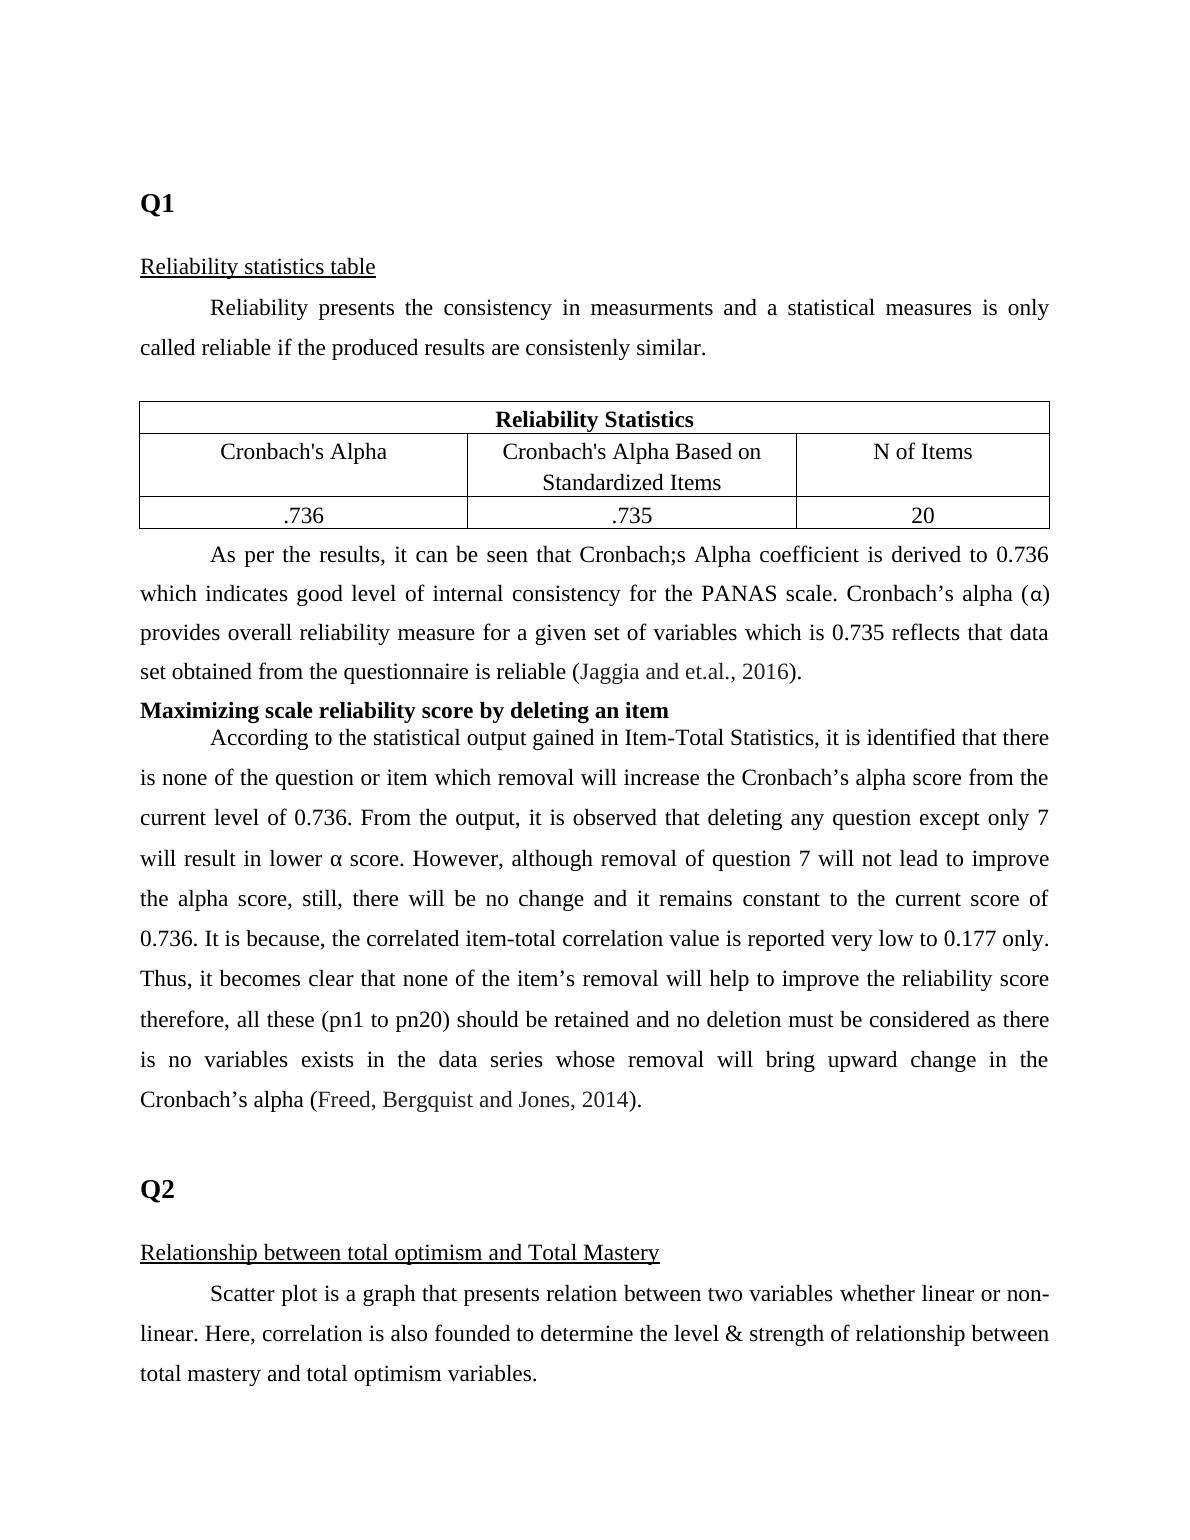
Q1Reliability statistics tableReliability presents the consistency in measurments and a statistical measures is onlycalled reliable if the produced results are consistenly similar. Reliability StatisticsCronbach's AlphaCronbach's Alpha Based onStandardized ItemsN of Items.736.73520As per the results, it can be seen that Cronbach;s Alpha coefficient is derived to 0.736which indicates good level of internal consistency for the PANAS scale. Cronbach’s alpha (α)provides overall reliability measure for a given set of variables which is 0.735 reflects that dataset obtained from the questionnaire is reliable (Jaggia and et.al., 2016). Maximizing scale reliability score by deleting an itemAccording to the statistical output gained in Item-Total Statistics, it is identified that thereis none of the question or item which removal will increase the Cronbach’s alpha score from thecurrent level of 0.736. From the output, it is observed that deleting any question except only 7will result in lower α score. However, although removal of question 7 will not lead to improvethe alpha score, still, there will be no change and it remains constant to the current score of0.736. It is because, the correlated item-total correlation value is reported very low to 0.177 only.Thus, it becomes clear that none of the item’s removal will help to improve the reliability scoretherefore, all these (pn1 to pn20) should be retained and no deletion must be considered as thereis no variables exists in the data series whose removal will bring upward change in theCronbach’s alpha (Freed, Bergquist and Jones, 2014). Q2Relationship between total optimism and Total MasteryScatter plot is a graph that presents relation between two variables whether linear or non-linear. Here, correlation is also founded to determine the level & strength of relationship betweentotal mastery and total optimism variables.
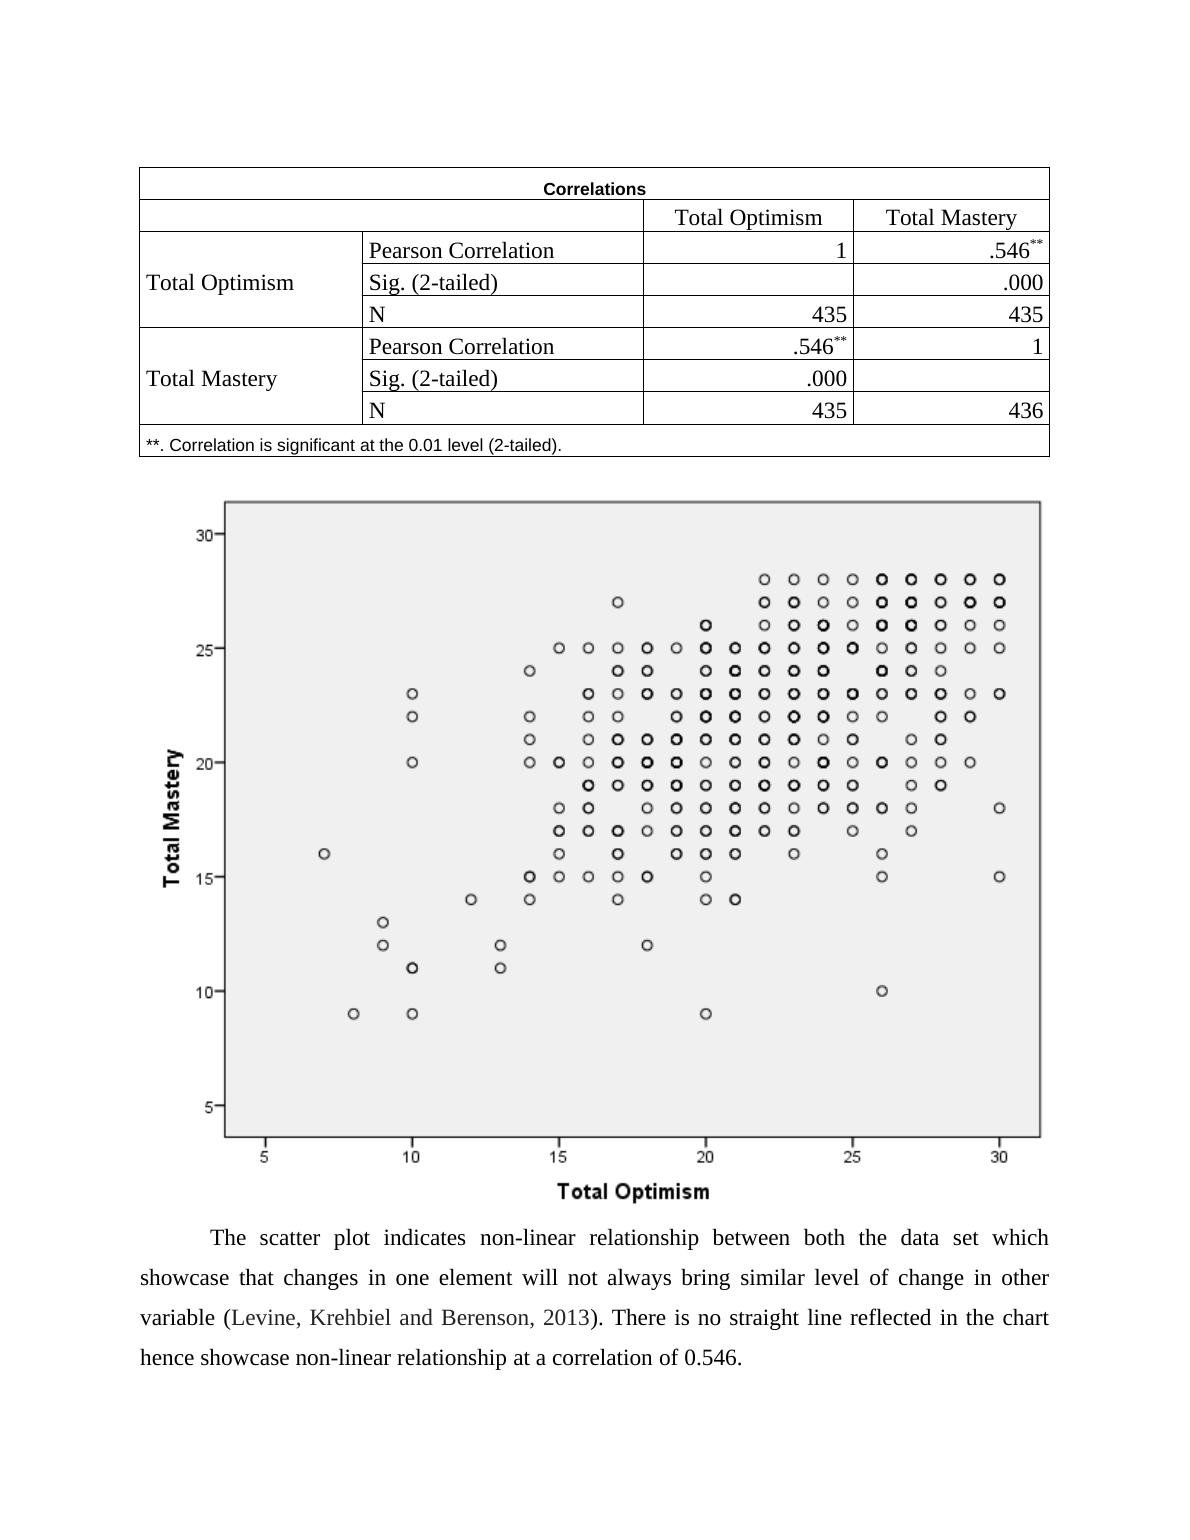
CorrelationsTotal OptimismTotal MasteryTotal OptimismPearson Correlation1.546**Sig. (2-tailed).000N435435Total MasteryPearson Correlation.546**1Sig. (2-tailed).000N435436**. Correlation is significant at the 0.01 level (2-tailed).The scatter plot indicates non-linear relationship between both the data set whichshowcase that changes in one element will not always bring similar level of change in othervariable (Levine, Krehbiel and Berenson, 2013). There is no straight line reflected in the charthence showcase non-linear relationship at a correlation of 0.546.
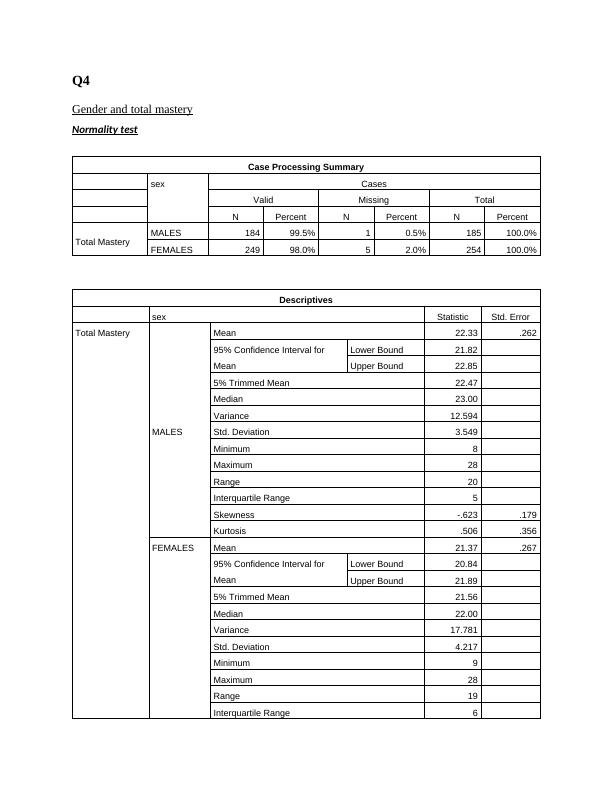
Q4 Gender and total masteryNormality testCase Processing SummarysexCasesValidMissingTotalNPercentNPercentNPercentTotal MasteryMALES18499.5%10.5%185100.0%FEMALES24998.0%52.0%254100.0%DescriptivessexStatisticStd. ErrorTotal MasteryMALESMean22.33.26295% Confidence Interval for MeanLower Bound21.82Upper Bound22.855% Trimmed Mean22.47Median23.00Variance12.594Std. Deviation3.549Minimum8Maximum28Range20Interquartile Range5Skewness-.623.179Kurtosis.506.356FEMALESMean21.37.26795% Confidence Interval for MeanLower Bound20.84Upper Bound21.895% Trimmed Mean21.56Median22.00Variance17.781Std. Deviation4.217Minimum9Maximum28Range19Interquartile Range6
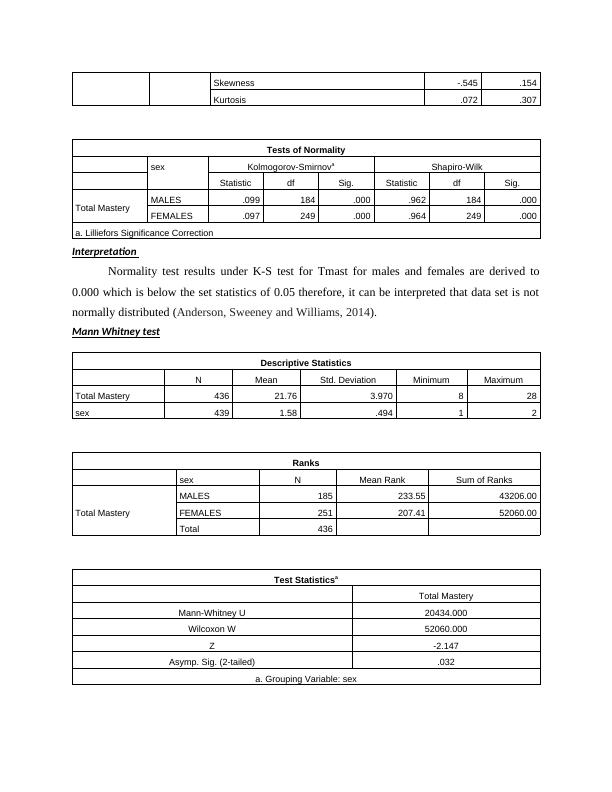
Skewness-.545.154Kurtosis.072.307Tests of NormalitysexKolmogorov-SmirnovaShapiro-WilkStatisticdfSig.StatisticdfSig.Total MasteryMALES.099184.000.962184.000FEMALES.097249.000.964249.000a. Lilliefors Significance CorrectionInterpretation Normality test results under K-S test for Tmast for males and females are derived to0.000 which is below the set statistics of 0.05 therefore, it can be interpreted that data set is notnormally distributed (Anderson, Sweeney and Williams, 2014). Mann Whitney testDescriptive StatisticsNMeanStd. DeviationMinimumMaximumTotal Mastery43621.763.970828sex4391.58.49412RankssexNMean RankSum of RanksTotal MasteryMALES185233.5543206.00FEMALES251207.4152060.00Total436Test StatisticsaTotal MasteryMann-Whitney U20434.000Wilcoxon W52060.000Z-2.147Asymp. Sig. (2-tailed).032a. Grouping Variable: sex
End of preview
Want to access all the pages? Upload your documents or become a member.
Related Documents
Data Analysis in Research Paperlg...
|46
|7154
|101
SPSS practice projectlg...
|16
|3032
|59