Data Analysis in Research Paper
Added on 2023-04-07
46 Pages7154 Words101 Views
0RESEARCH PAPER
Data Analysis
Name of the student
Name of the university
Author note
Data Analysis
Name of the student
Name of the university
Author note

1RESEARCH PAPER
Chapter 4
Data Findings and Analysis
4.1 Introduction
This chapter in the research have conducted a quantitative analysis based on the
methods selected in the research. The survey questionnaire has been developed on a five
point Likert scale and is based on the Hackman and Oldham’s job characteristics model. This
model facilitated in understanding the factors influencing the job satisfaction of the
employees. The questionnaire consists of the five job characteristics to understand the
motivating factors at work in Guyana National Bureau of Standards (GNBS). A public
organization has been taken in the research which has facilitated in evaluating the job
characteristics and motivating factors for employees in the public sector. Moreover, in this
research, the data has been collected from 25 respondents which is relatively small so the
sampling error in the data is expected to high and results may deviate as it is difficult to
predict human behaviour.
4.2 Reliability Analysis
The reliability analysis of the collected data has been conducted using the Cronbach’s
Alpha test. The Cronbach’s Alpha test measures the internal consistency among the items in
the research and is a measure of scale reliability. It measures how closely related all the items
are as a group. It also states the questions used in the scale are one-dimensional in nature.
When the value of Cronbach’s Alpha is high, it means that the inter item correlation is high.
In general, a value of greater than 0.6 then it is acceptable. In this given research, the value of
Cronbach’s alpha is 0.963 which shows that there is high internal consistency between the
items and the scale reliability of the data is high. By referring to the appendix 1 in the
research, it can be seen that the item total statistics shows the value of alpha when one of the
2RESEARCH PAPER
item is deleted. In most of the cases, the value of alpha decreases, if one of the item is deleted
which shows that each item contributes to the scale reliability of the group of data. However,
in case of the second item which is a question on skill variety increases the value of alpha
when the item is deleted. This could mean that removing this variable will result in higher
reliability of the data but the inter item correlation shows a negative relationship with the
other questions. This is the reason that the value of alpha increases but this question is
significantly important in identifying the consistency in the data.
4.3 Demographic Data
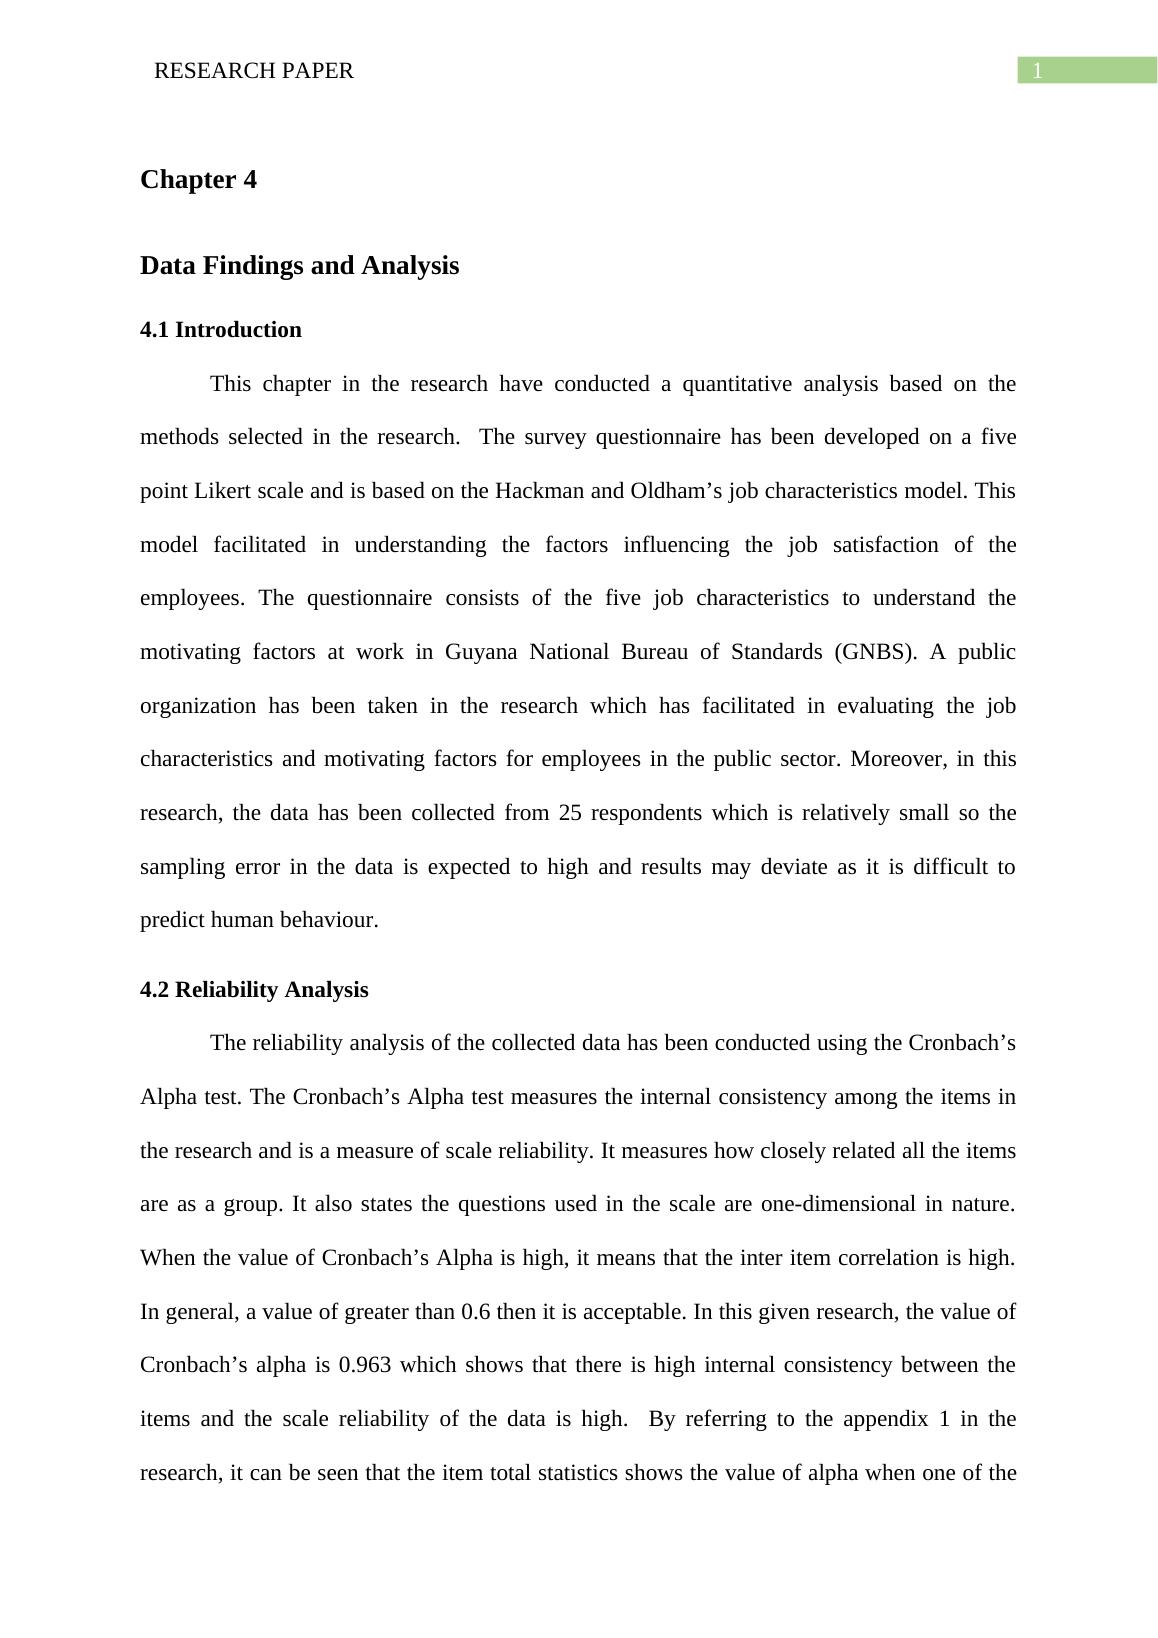
Graph 1: Age
Source: (As created by author)
Frequency Percent Valid Percent Cumulative Percent
Valid 25 - 35 24 48.0 48.0 48.0
36-45 18 36.0 36.0 84.0
item is deleted. In most of the cases, the value of alpha decreases, if one of the item is deleted
which shows that each item contributes to the scale reliability of the group of data. However,
in case of the second item which is a question on skill variety increases the value of alpha
when the item is deleted. This could mean that removing this variable will result in higher
reliability of the data but the inter item correlation shows a negative relationship with the
other questions. This is the reason that the value of alpha increases but this question is
significantly important in identifying the consistency in the data.
4.3 Demographic Data
Graph 1: Age
Source: (As created by author)
Frequency Percent Valid Percent Cumulative Percent
Valid 25 - 35 24 48.0 48.0 48.0
36-45 18 36.0 36.0 84.0
3RESEARCH PAPER
46-55 8 16.0 16.0 100.0
Total 50 100.0 100.0
Table 1: Age
Source: (As created by author)
This demographic questions determines the age group of the respondents taking part
in the survey. The results show that 48% of the respondents belong to the age group of 25-35,
36% of the respondents belong to the age group of 36-45 and the remaining respondents
belong to the age group of 46-55. This shows that there is a diversity in the age group of the
respondents and it is expected to obtain diverse answers as different age groups is effected to
have different elements contributing to their motivation.
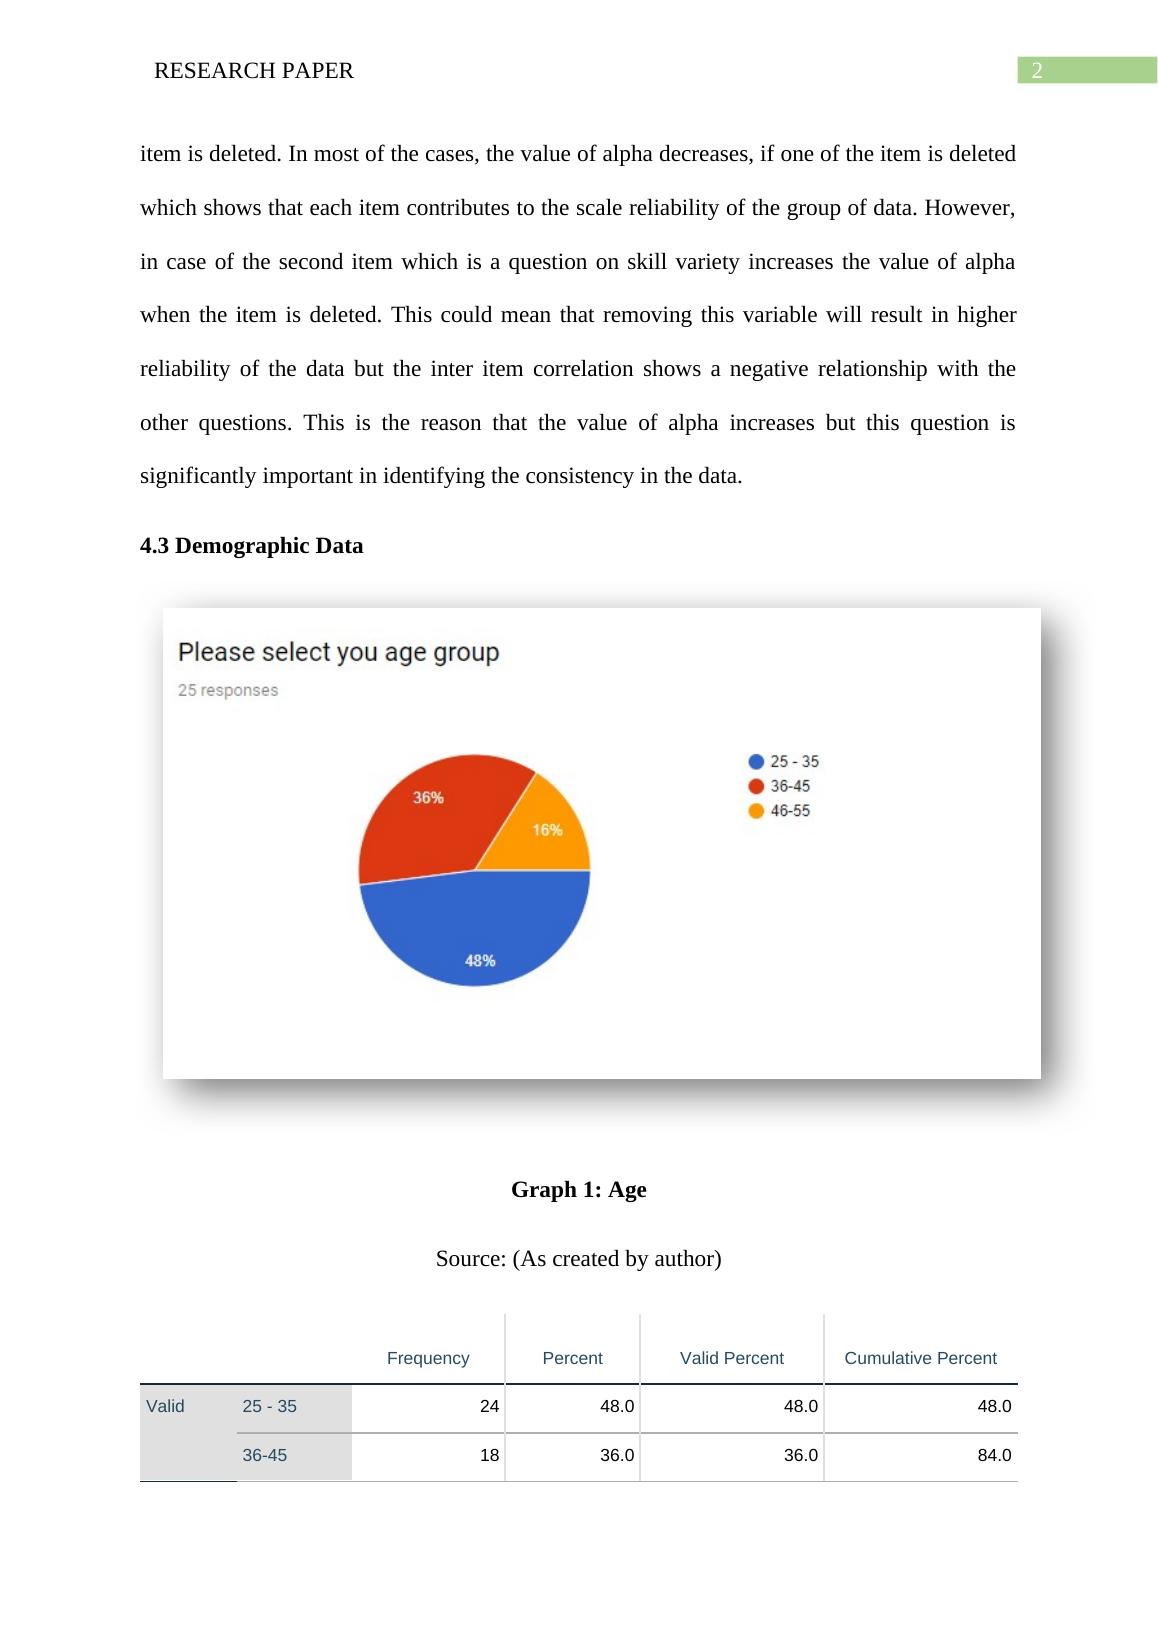
Graph 2: Tenure
Source: (As created by author)
46-55 8 16.0 16.0 100.0
Total 50 100.0 100.0
Table 1: Age
Source: (As created by author)
This demographic questions determines the age group of the respondents taking part
in the survey. The results show that 48% of the respondents belong to the age group of 25-35,
36% of the respondents belong to the age group of 36-45 and the remaining respondents
belong to the age group of 46-55. This shows that there is a diversity in the age group of the
respondents and it is expected to obtain diverse answers as different age groups is effected to
have different elements contributing to their motivation.
Graph 2: Tenure
Source: (As created by author)
4RESEARCH PAPER
Frequency Percent Valid Percent Cumulative Percent
Valid 0-5yrs 18 36.0 36.0 36.0
6 -10years 24 48.0 48.0 84.0
Over 10 years 8 16.0 16.0 100.0
Total 50 100.0 100.0
Table 2: Tenure
Source: (As created by author)
This questions aims to evaluate the tenure of the respondents in the survey. The
results show that 48% of the employees have been in the organization between 6-10 years,
36% of the respondents have been in the organization between 0-5 years and 16% of the
respondents have been over 10 years. This depicts in the sample population in the survey
which is expected to provide a reliable data.
5RESEARCH PAPER
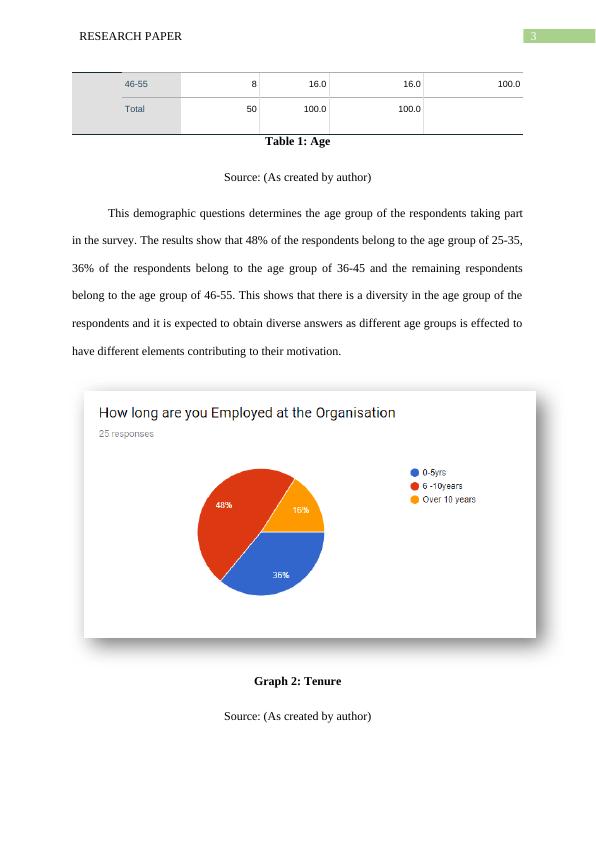
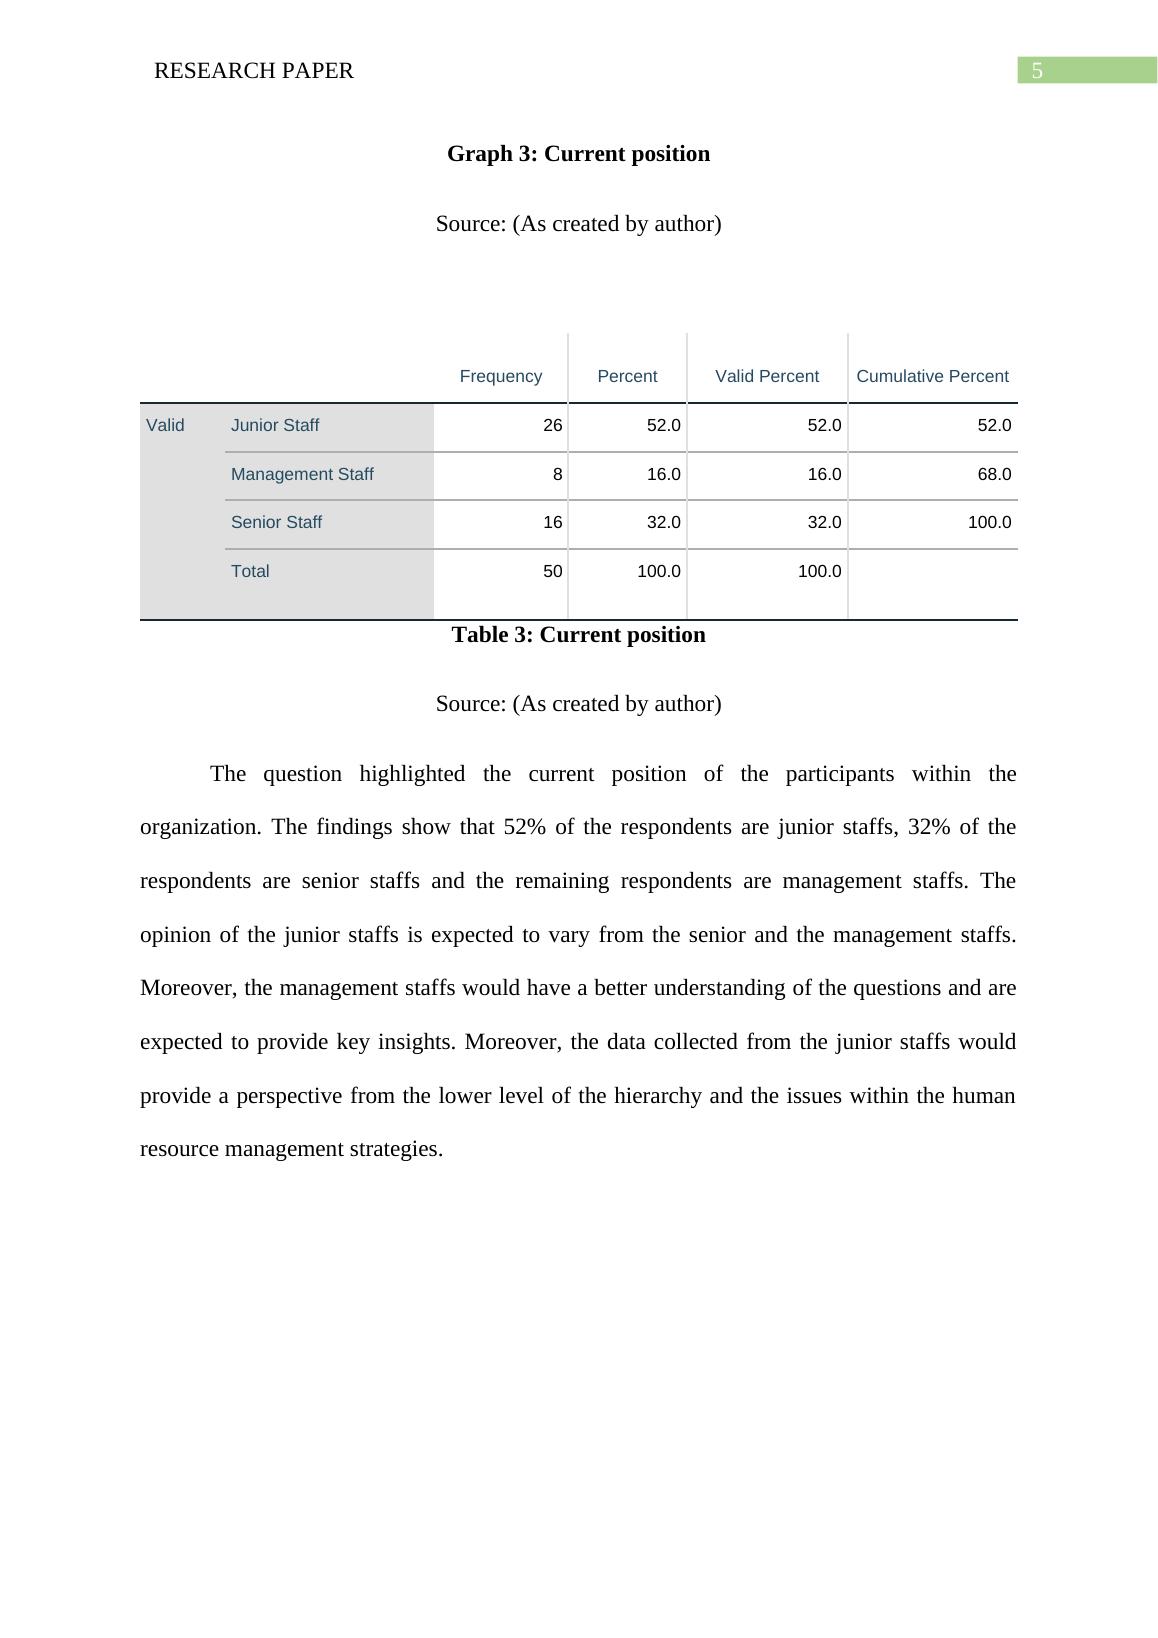
Graph 3: Current position
Source: (As created by author)
Frequency Percent Valid Percent Cumulative Percent
Valid Junior Staff 26 52.0 52.0 52.0
Management Staff 8 16.0 16.0 68.0
Senior Staff 16 32.0 32.0 100.0
Total 50 100.0 100.0
Table 3: Current position
Source: (As created by author)
The question highlighted the current position of the participants within the
organization. The findings show that 52% of the respondents are junior staffs, 32% of the
respondents are senior staffs and the remaining respondents are management staffs. The
opinion of the junior staffs is expected to vary from the senior and the management staffs.
Moreover, the management staffs would have a better understanding of the questions and are
expected to provide key insights. Moreover, the data collected from the junior staffs would
provide a perspective from the lower level of the hierarchy and the issues within the human
resource management strategies.
6RESEARCH PAPER
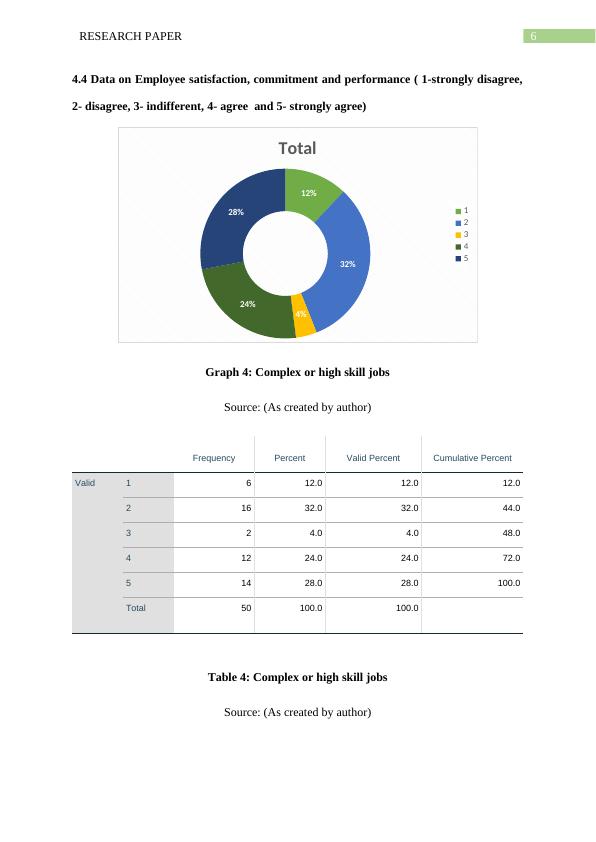
4.4 Data on Employee satisfaction, commitment and performance ( 1-strongly disagree,
2- disagree, 3- indifferent, 4- agree and 5- strongly agree)
12%
32%
4%
24%
28%
Total
1
2
3
4
5
Graph 4: Complex or high skill jobs
Source: (As created by author)
Frequency Percent Valid Percent Cumulative Percent
Valid 1 6 12.0 12.0 12.0
2 16 32.0 32.0 44.0
3 2 4.0 4.0 48.0
4 12 24.0 24.0 72.0
5 14 28.0 28.0 100.0
Total 50 100.0 100.0
Table 4: Complex or high skill jobs
Source: (As created by author)
7RESEARCH PAPER
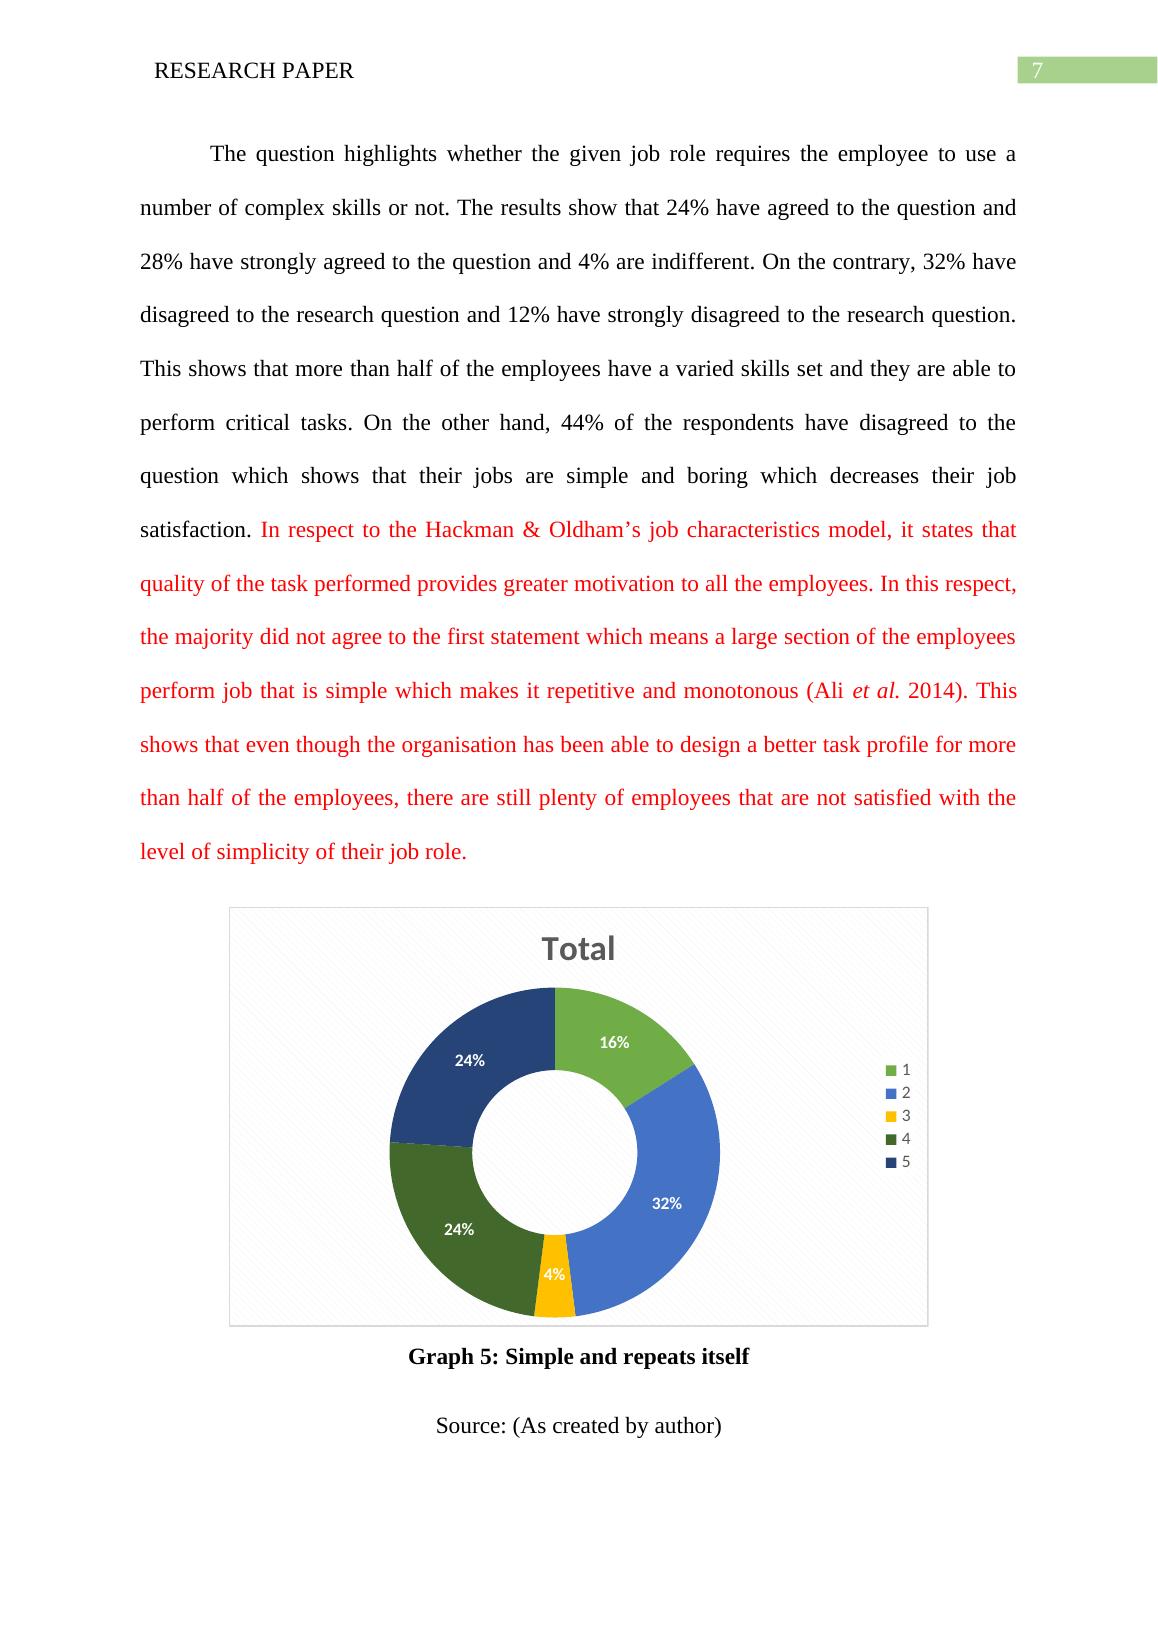
The question highlights whether the given job role requires the employee to use a
number of complex skills or not. The results show that 24% have agreed to the question and
28% have strongly agreed to the question and 4% are indifferent. On the contrary, 32% have
disagreed to the research question and 12% have strongly disagreed to the research question.
This shows that more than half of the employees have a varied skills set and they are able to
perform critical tasks. On the other hand, 44% of the respondents have disagreed to the
question which shows that their jobs are simple and boring which decreases their job
satisfaction. In respect to the Hackman & Oldham’s job characteristics model, it states that
quality of the task performed provides greater motivation to all the employees. In this respect,
the majority did not agree to the first statement which means a large section of the employees
perform job that is simple which makes it repetitive and monotonous (Ali et al. 2014). This
shows that even though the organisation has been able to design a better task profile for more
than half of the employees, there are still plenty of employees that are not satisfied with the
level of simplicity of their job role.
16%
32%
4%
24%
24%
Total
1
2
3
4
5
Graph 5: Simple and repeats itself
Source: (As created by author)
End of preview
Want to access all the pages? Upload your documents or become a member.
Related Documents
Quantitative Research Methods Table Reliability Statistics Tablelg...
|29
|1669
|137
24720 Applied Marketing Researchlg...
|26
|4312
|124
Data Analysis and Findingslg...
|37
|5360
|31
Data Analysislg...
|15
|3125
|425
Goal Orientation and Impulsive Scale Correlationlg...
|14
|2894
|86
Business Research Methodology and Data Collectionlg...
|21
|2807
|37