Accounting & Financial Management: Ratio Analysis of Two Banks
VerifiedAdded on 2020/05/04
|7
|1525
|84
Report
AI Summary
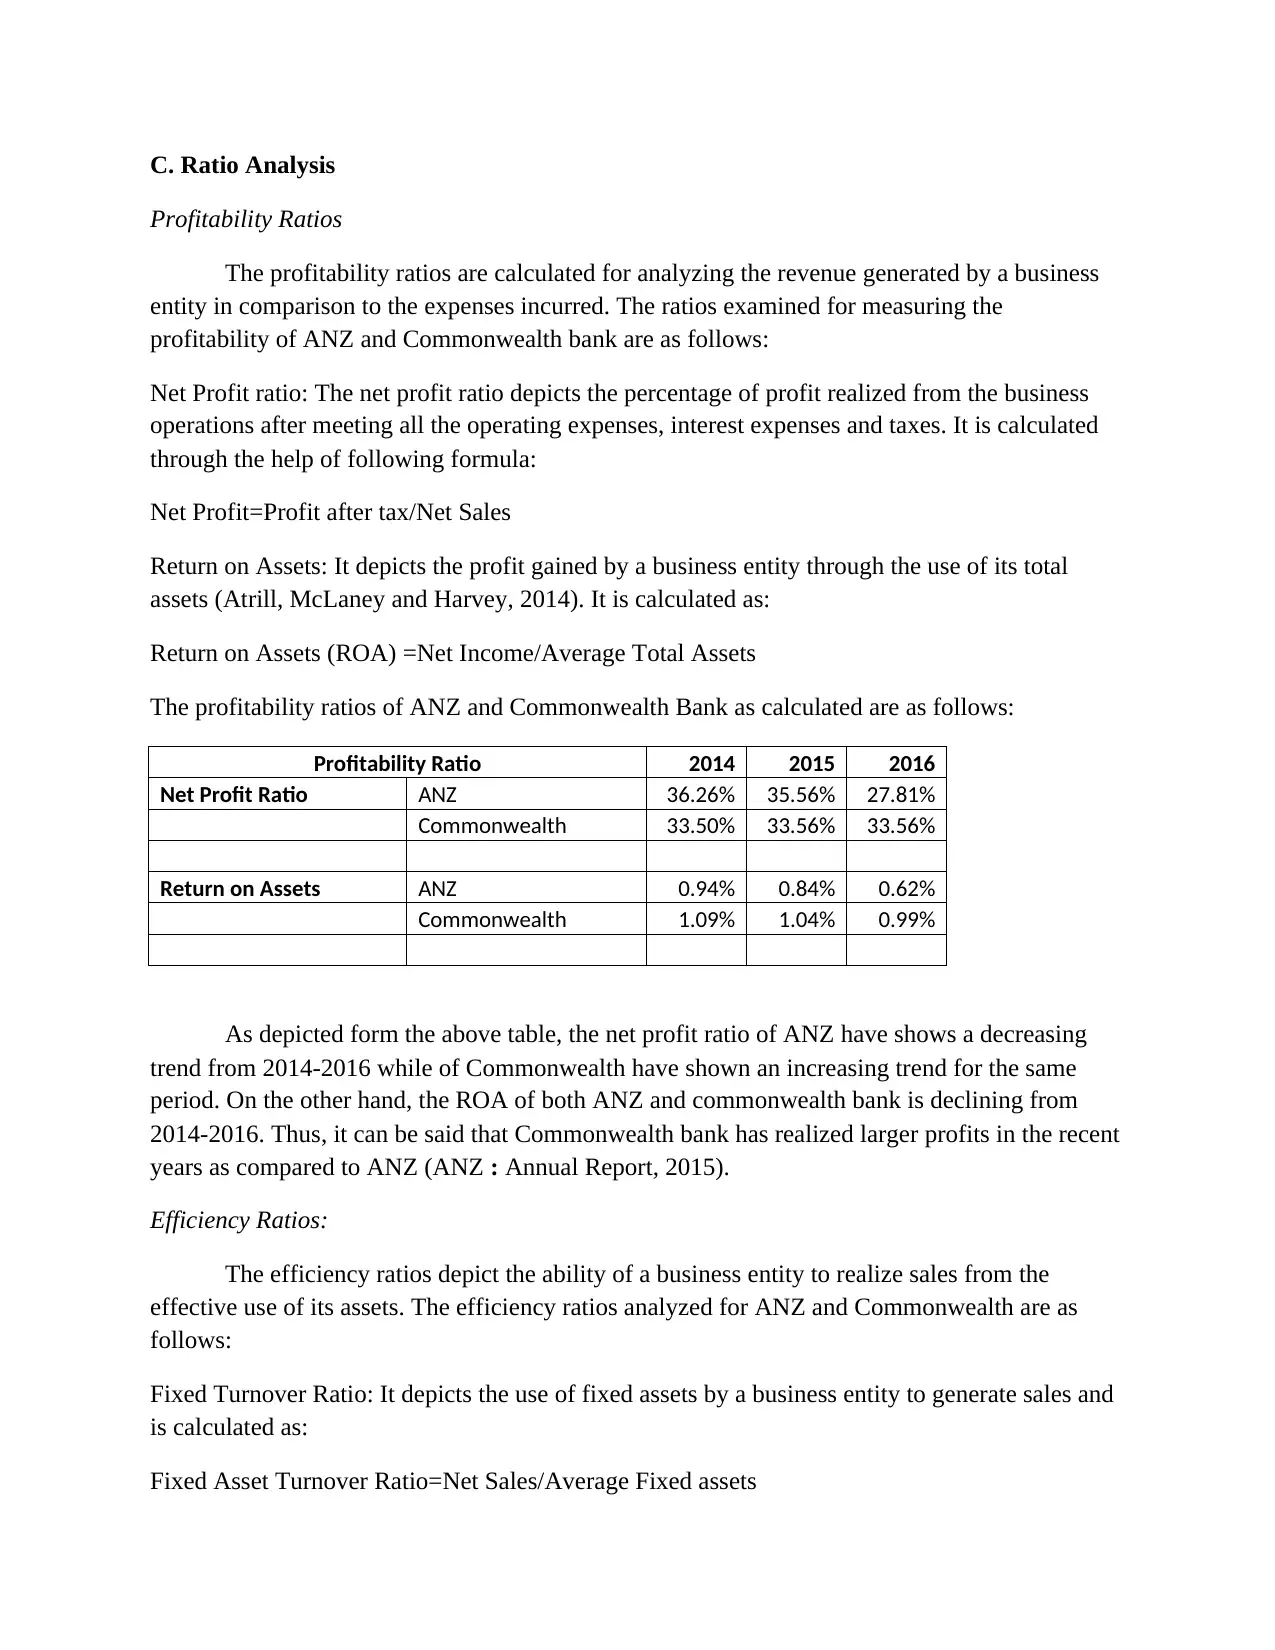
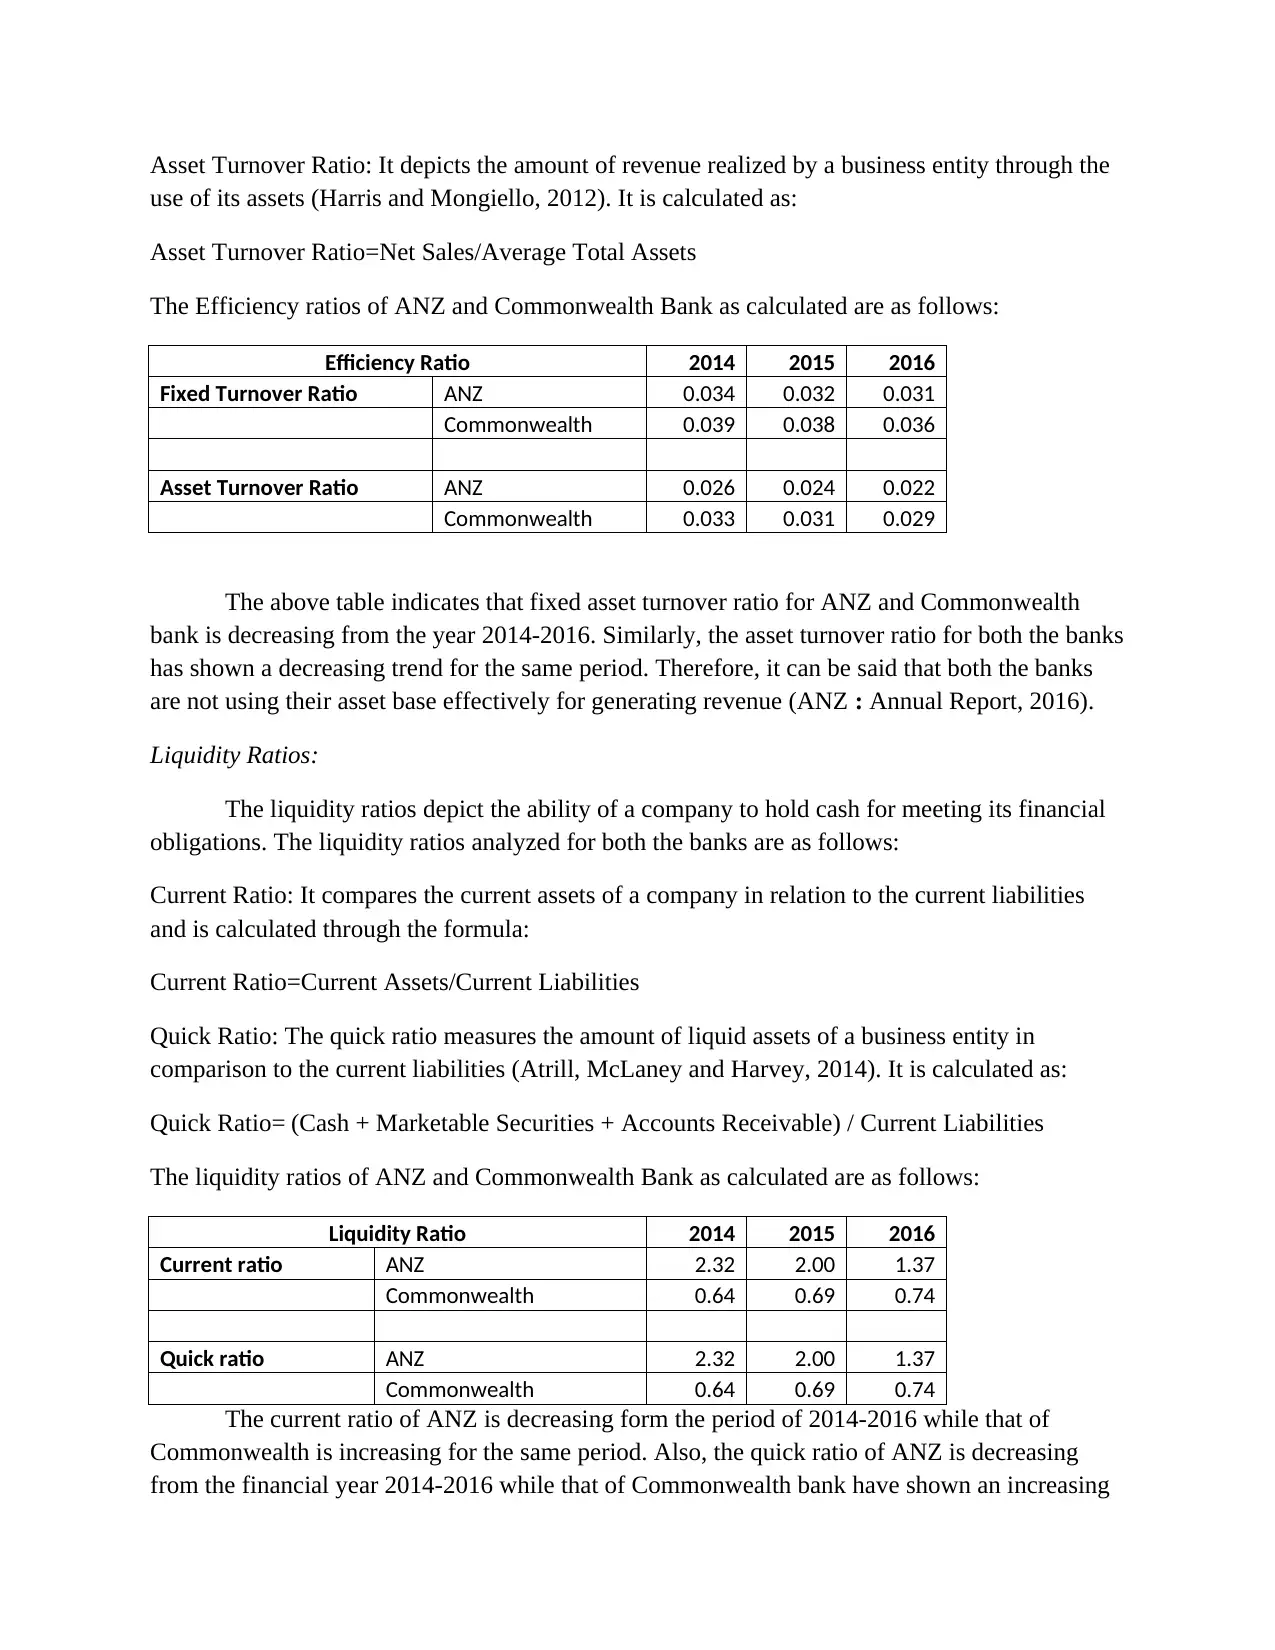
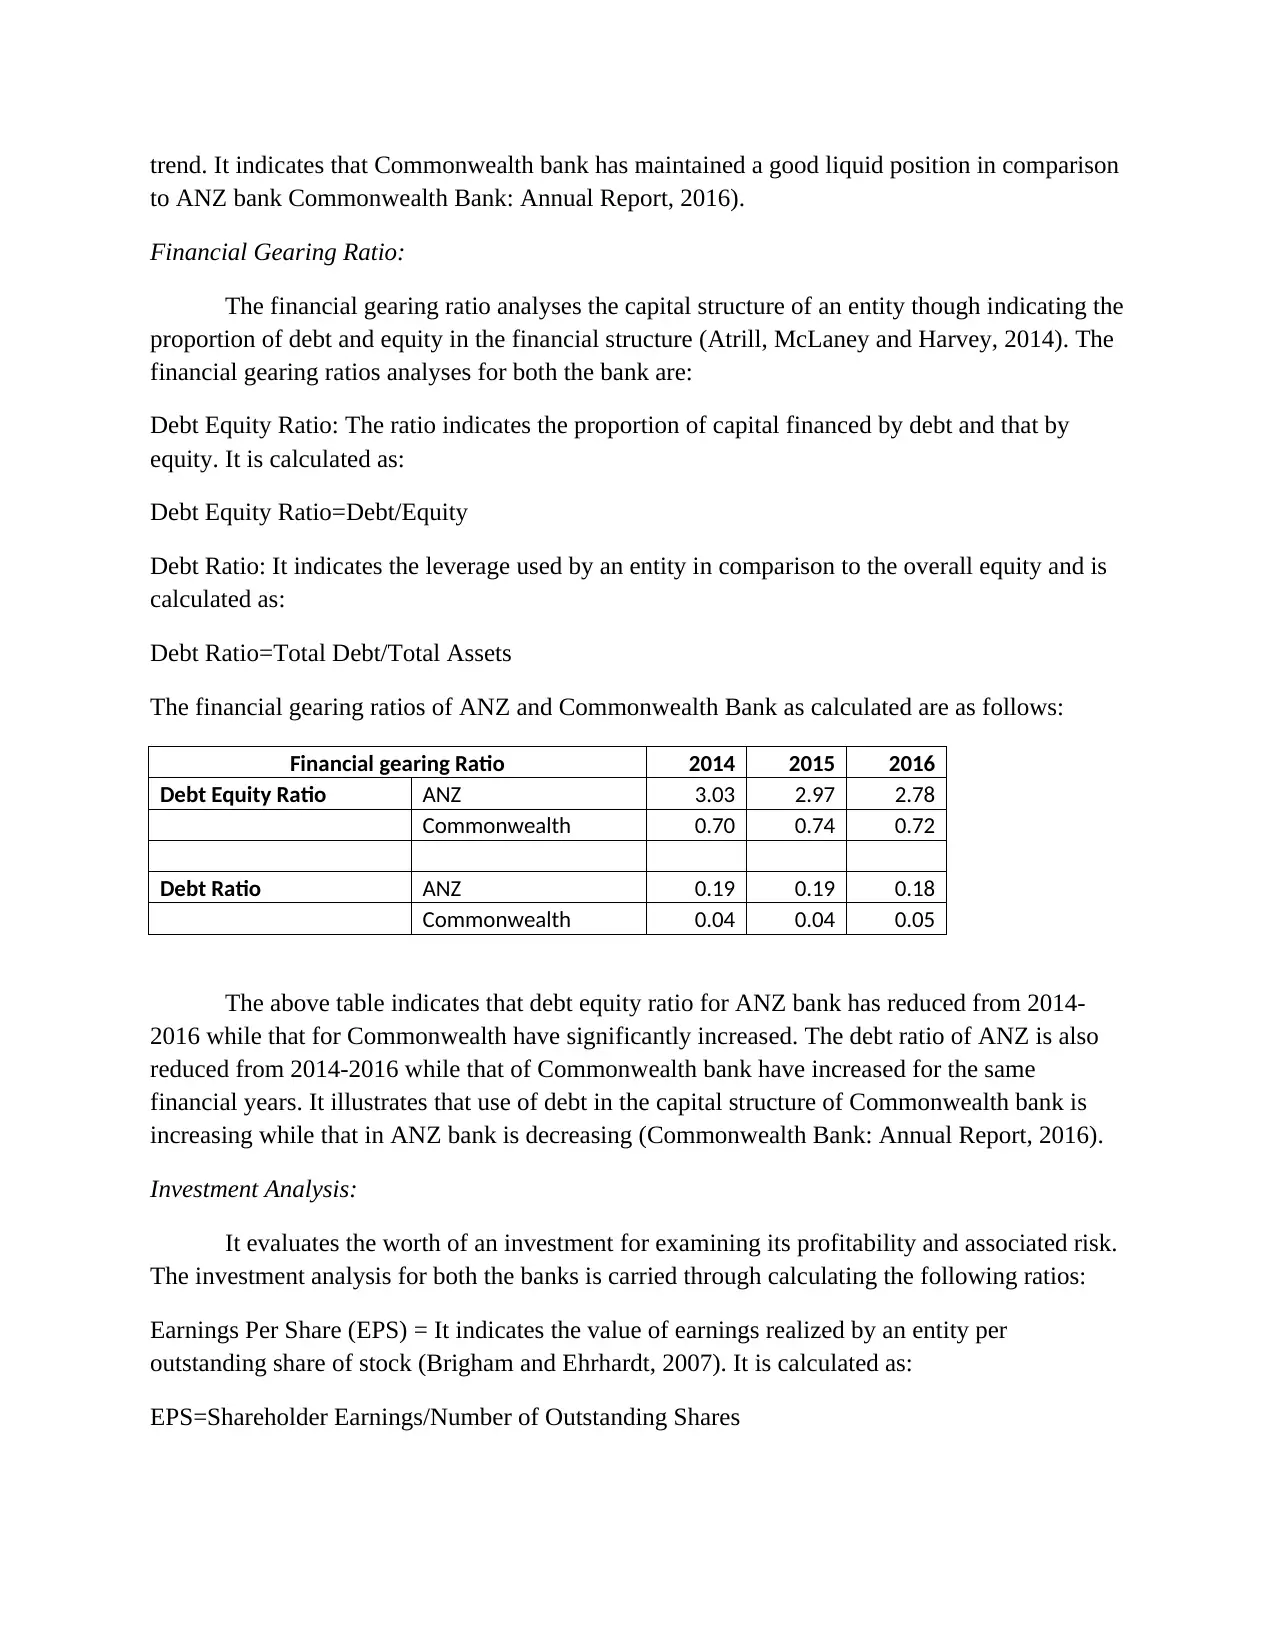
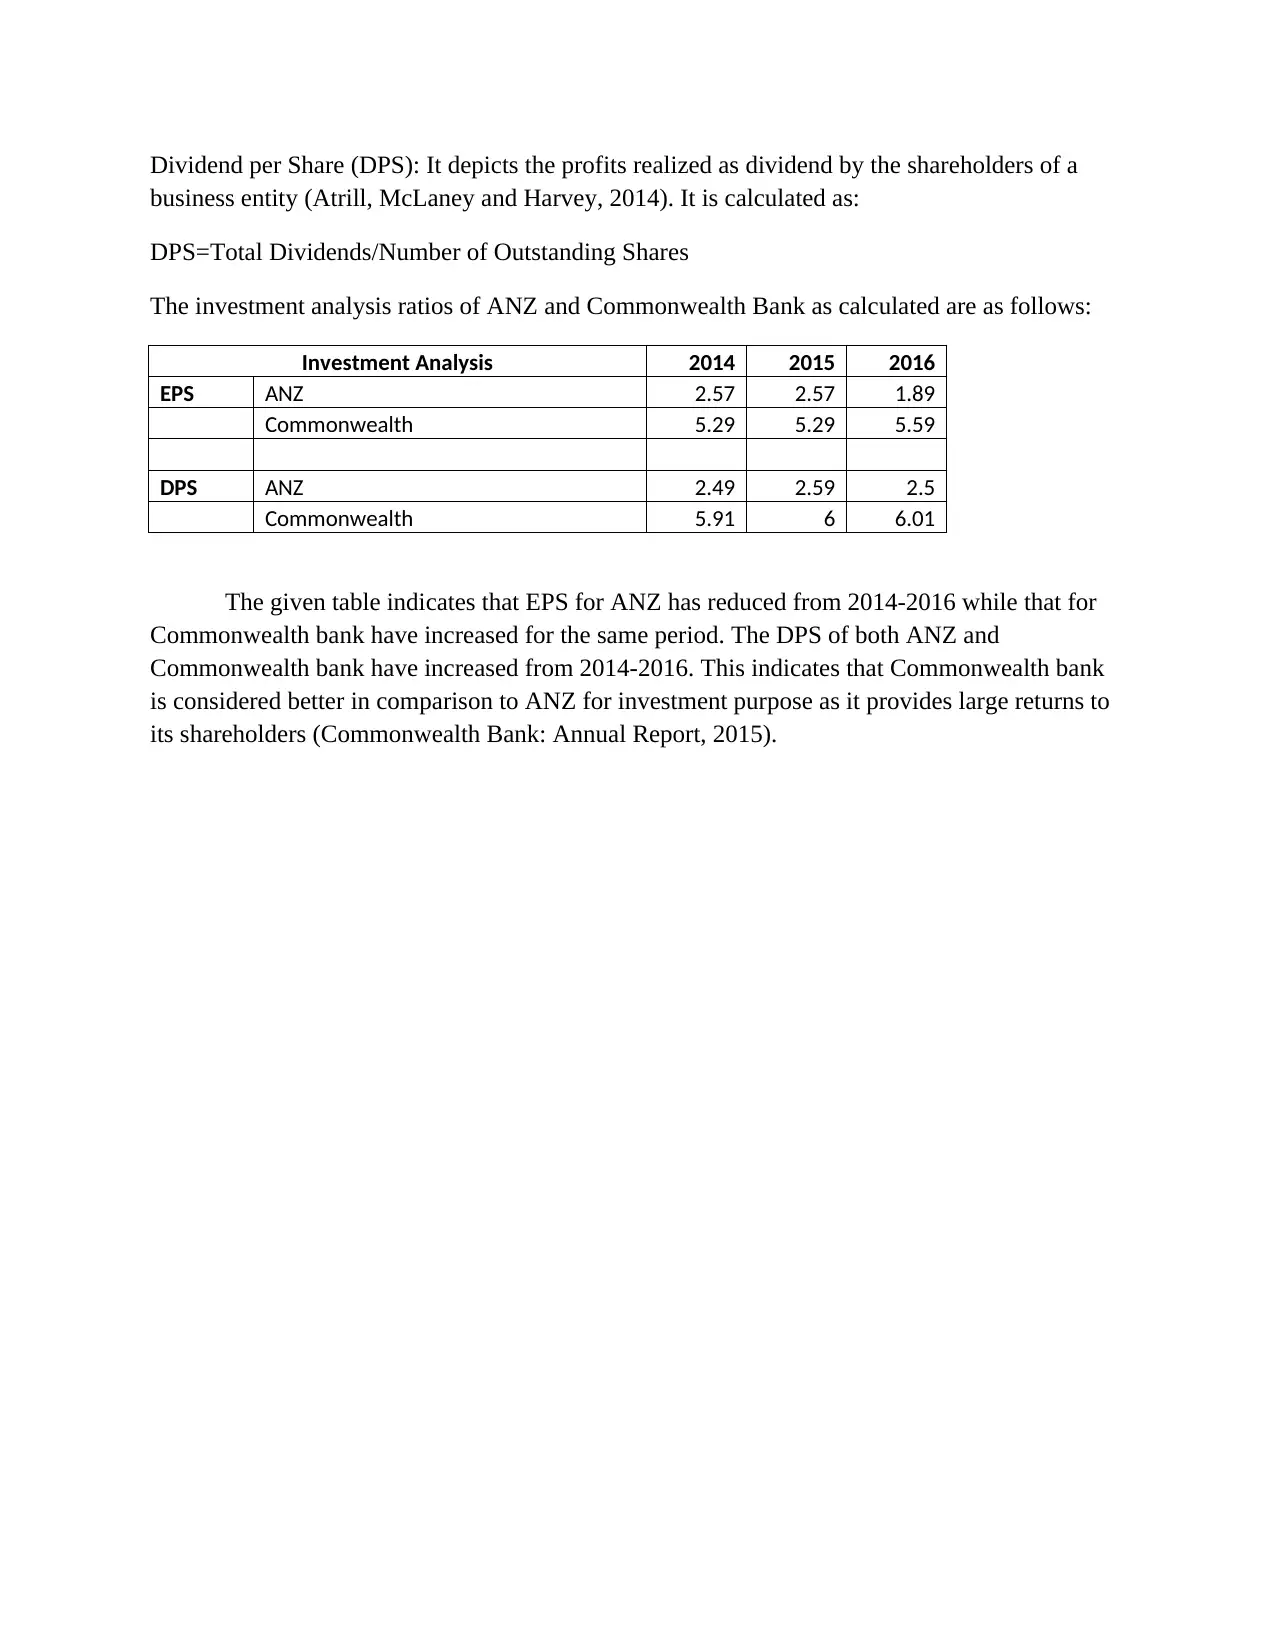
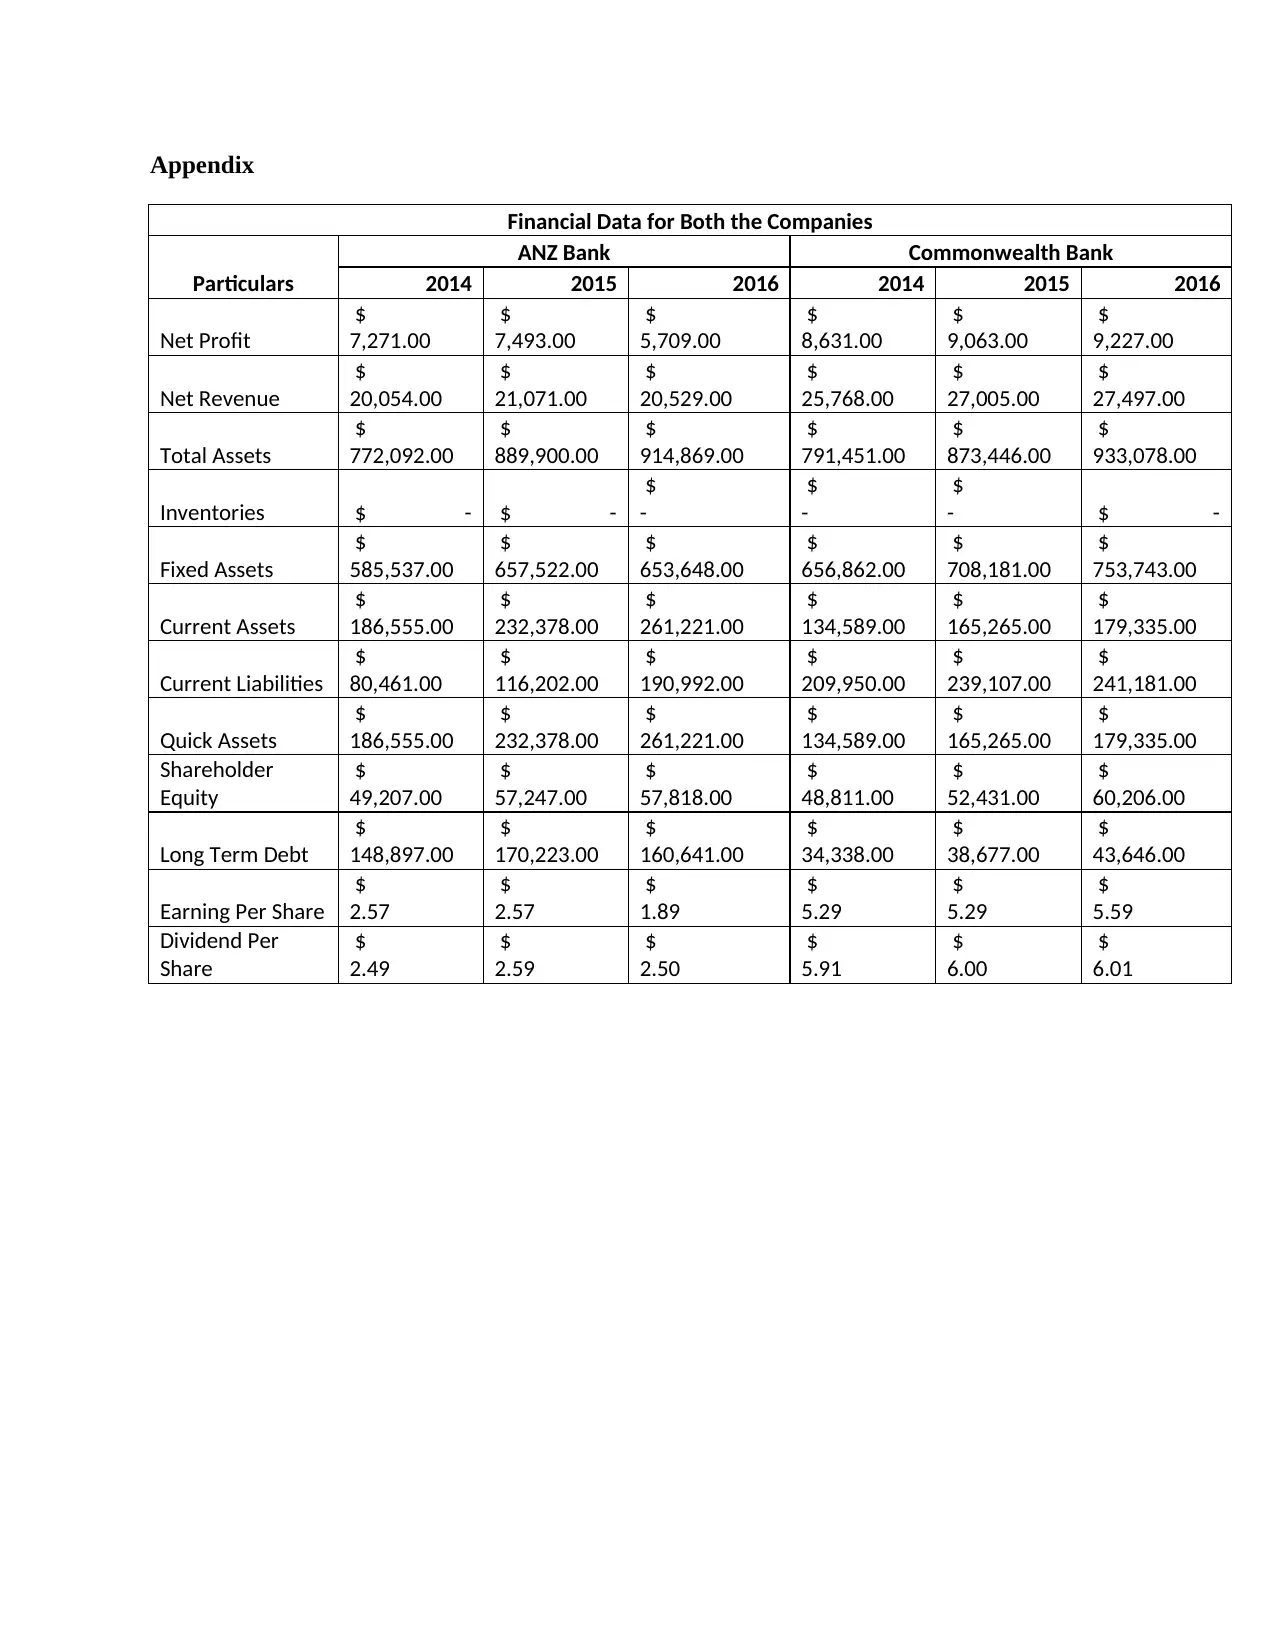
This report presents a detailed analysis of the financial performance of ANZ and Commonwealth Banks from 2014 to 2016 using various financial ratios. The analysis covers profitability ratios (Net Profit Ratio, Return on Assets), efficiency ratios (Fixed Asset Turnover Ratio, Asset Turnover Ratio), liquidity ratios (Current Ratio, Quick Ratio), financial gearing ratios (Debt Equity Ratio, Debt Ratio), and investment analysis ratios (Earnings Per Share, Dividend per Share). The report calculates and compares these ratios for both banks, providing insights into their financial health, efficiency in asset utilization, liquidity positions, capital structure, and investment attractiveness. The findings suggest that Commonwealth Bank generally demonstrated stronger financial performance during the analyzed period, particularly in profitability and investment returns, while ANZ Bank showed declining trends in several key ratios. The report concludes with a discussion of the implications of these findings for stakeholders, including investors and management. The report also includes the financial data used for the calculations along with the references used.

1 out of 7
Related Documents


Your All-in-One AI-Powered Toolkit for Academic Success.
+13062052269
info@desklib.com
Available 24*7 on WhatsApp / Email
![[object Object]](/_next/static/media/star-bottom.7253800d.svg)
Copyright © 2020–2025 A2Z Services. All Rights Reserved. Developed and managed by ZUCOL.