University Finance Report: Oil Search Limited Analysis
VerifiedAdded on 2020/05/28
|16
|3257
|80
Report
AI Summary
This report provides a comprehensive financial analysis of Oil Search Limited, a major oil and gas exploration company. It begins with a description of the company and its operational structure, followed by an examination of its ownership and governance. Key financial ratios, including Return on Assets (ROA), Return on Equity (ROE), and the debt ratio, are calculated and analyzed for the years 2013-2016, highlighting the relationship between ROE and ROA and the implications of the debt ratio. The report also analyzes stock price movements over a two-year period using data from the ASX, along with recent company announcements. Furthermore, it calculates the company's beta and assesses its suitability as a conservative investment. The Weighted Average Cost of Capital (WACC) is computed, along with an exploration of its implications for management evaluation. The report concludes with an analysis of the optimal capital structure and provides recommendations based on the financial data.
Running head: FINANCE FOR BUSINESS - MASTERS
Finance for business – Masters
Name of the student
Name of the university
Author note
Finance for business – Masters
Name of the student
Name of the university
Author note
Paraphrase This Document
Need a fresh take? Get an instant paraphrase of this document with our AI Paraphraser
1FINANCE FOR BUSINESS - MASTERS
Table of Contents
1. Description of company......................................................................................................2
2. Structure of ownership governance....................................................................................2
3. Key ratios............................................................................................................................3
4. Information derived from the website of ASX...................................................................5
5. Recent announcements.......................................................................................................8
6. Stock field...........................................................................................................................9
7. Weighted average cost of capital........................................................................................9
8. Debt ratio..........................................................................................................................11
9. Dividend policy.................................................................................................................12
10. Recommendation...........................................................................................................12
Reference..................................................................................................................................14
2FINANCE FOR BUSINESS - MASTERS
1. Description of company
Oil Search Limited, the biggest gas and oil exploration companies was incorporated in
the Papua New Guinea and operates under the oilfields of Papua New Guinea (PNG). The
company was established in the year 1929. Under PNG, the company holds more than 98%
of assets and it holds extensive exploration and appraisal portfolio. The company has clear
strategy for driving the future growth. Further, the company is pursuing the opportunities for
developing the additional LNG for providing trainings in PNG (Oilsearch 2017). The
company is involved for liquefying the natural gas production and the developments of it
through the interest in LNG PNG projects that is operated by PNG Limited. The company has
three main products; these are – gas, oil and liquefied natural gas (LNG). The company
operates 3 units for the business that involves PNG gas and oil, LNG PNG products and
Middle East and North America (MENA)
2. Structure of ownership governance
i. Substantial ownership
More than 20% shareholding – no shareholders are there in the company who is
holding more than 20% of shares.
More than 5% shareholding – International Petroleum Invt. Co. PJSC (Investment
Management) is holding 12.9% shares in the company and Npcp Investment Ltd is
holding 9.80% shares in Oil Search Limited.
ii. Name of key personnel
Chairman - Mr RJ Lee
Board members
Mr PR Botten – Managing director
Mr G Aopi – Executive director
⊘ This is a preview!⊘
Do you want full access?
Subscribe today to unlock all pages.
Trusted by 1+ million students worldwide
3FINANCE FOR BUSINESS - MASTERS
Sir KG Constantinou – Non-Executive director
Dr EJ Doyle – Non-Executive director
Ms FE Harris – Non –executive Director
Dr AJ Kantsler – Non-Executive director
Mr B Philemon – Non-Executive Director
Mr KW Spence – Non-Executive Director
Dr ZE Switkowski – Non-Executive Director
Mr MP Togolo – Non-Executive Ditector
CEO – Mr PR Botten
More than 20% shareholding – as none of the above mentioned key personnel are
holding more than 5% or more than 20% shares in the company they do not fall under
the category of substantial shareholders.
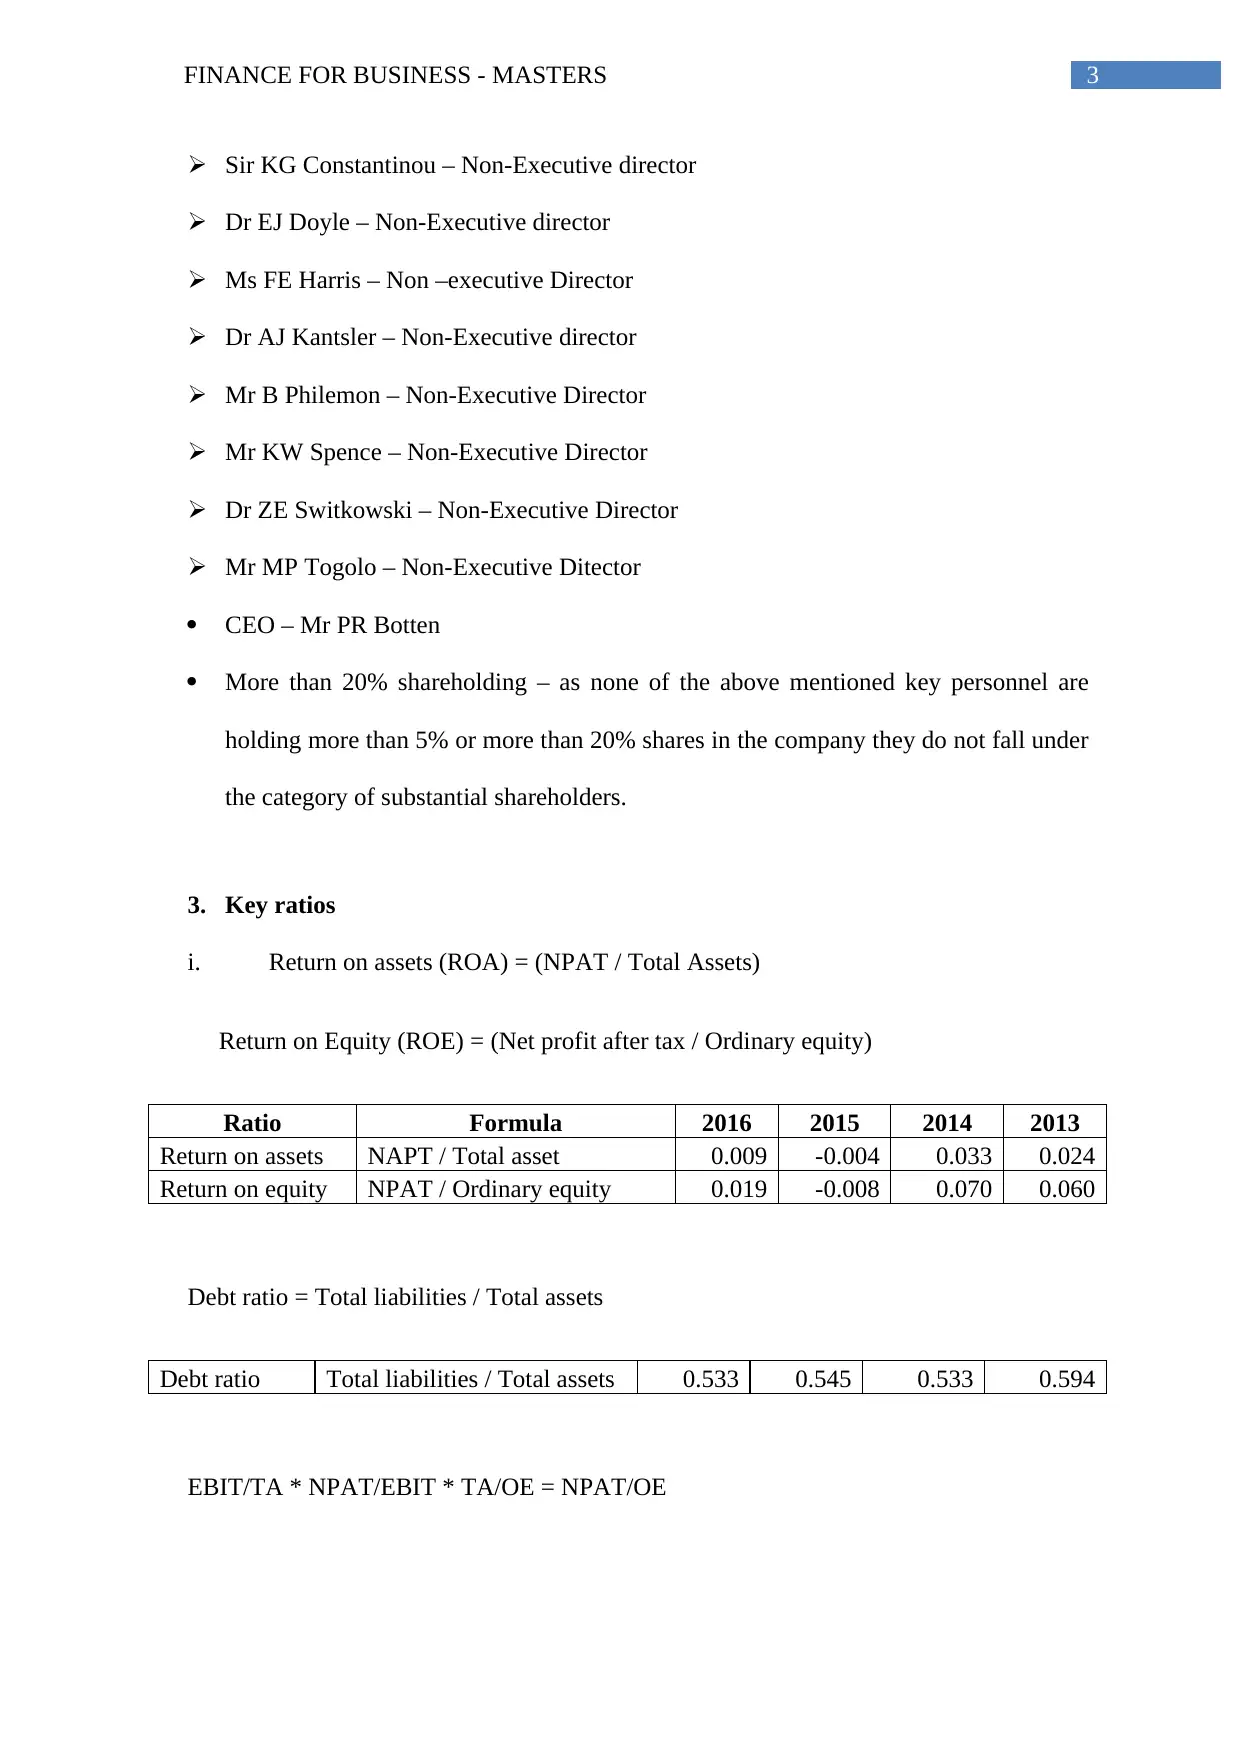
3. Key ratios
i. Return on assets (ROA) = (NPAT / Total Assets)
Return on Equity (ROE) = (Net profit after tax / Ordinary equity)
Ratio Formula 2016 2015 2014 2013
Return on assets NAPT / Total asset 0.009 -0.004 0.033 0.024
Return on equity NPAT / Ordinary equity 0.019 -0.008 0.070 0.060
Debt ratio = Total liabilities / Total assets
Debt ratio Total liabilities / Total assets 0.533 0.545 0.533 0.594
EBIT/TA * NPAT/EBIT * TA/OE = NPAT/OE
Sir KG Constantinou – Non-Executive director
Dr EJ Doyle – Non-Executive director
Ms FE Harris – Non –executive Director
Dr AJ Kantsler – Non-Executive director
Mr B Philemon – Non-Executive Director
Mr KW Spence – Non-Executive Director
Dr ZE Switkowski – Non-Executive Director
Mr MP Togolo – Non-Executive Ditector
CEO – Mr PR Botten
More than 20% shareholding – as none of the above mentioned key personnel are
holding more than 5% or more than 20% shares in the company they do not fall under
the category of substantial shareholders.
3. Key ratios
i. Return on assets (ROA) = (NPAT / Total Assets)
Return on Equity (ROE) = (Net profit after tax / Ordinary equity)
Ratio Formula 2016 2015 2014 2013
Return on assets NAPT / Total asset 0.009 -0.004 0.033 0.024
Return on equity NPAT / Ordinary equity 0.019 -0.008 0.070 0.060
Debt ratio = Total liabilities / Total assets
Debt ratio Total liabilities / Total assets 0.533 0.545 0.533 0.594
EBIT/TA * NPAT/EBIT * TA/OE = NPAT/OE
Paraphrase This Document
Need a fresh take? Get an instant paraphrase of this document with our AI Paraphraser
4FINANCE FOR BUSINESS - MASTERS
EBIT/TA * NPAT/EBIT * TA/OE = 381,031/10,126,129 * 89,795/381,031 *
10,126,129/47,25,316 = 0.019
NPAT/OE = 89,795/4725316 = 0.019
From the above calculation it can be proved that EBIT/TA * NPAT/EBIT * TA/OE =
NPAT/OE
ii. Phenomenon of TA/OE
The phenomenon of TA/OE represents the total assets of the company as compared to
it’s to its owner’s equity or ordinary equity. It stats the exposure of the company towards the
risk of insolvency and measures the shareholder’s risk exposures as compared to the
company’s total assets. If the company’s total assets reduce, it will increase the return on
assets whereas if the total assets of the company go up, it will reduce the return on assets of
the company (Naser et al. 2013). The value and importance of the total asset to equity ratio
depends on the industry, present economic status, company’s sales and assets and various
other factors. Though there is no ideal value for the ratio and it is used for comparing the
business with its peers. However, high ratio indicates that the company is highly leveraged.
Further, the reason behind the high asset equity ratio may be that the borrowed capital is
more as compared to the capital cost (Akeem et al. 2014). Further. Very high ratio may lead
the company to the unsustainable level as additional debt increases the cost of interest which
in turn may deteriorate the financial status of the company. On the other hand, low asset-
equity ratio indicates that firm’s position is strong and requires no further debt or the
company is over conservative and missing the business opportunities.
iii. Reasons why ROE is greater than ROA
5FINANCE FOR BUSINESS - MASTERS
If the debt cost is lower as compared to ROA, then the company will earn on the debt
and ROE will increase. Profit earned from debt as well as from additional equity will be more
as compared to profit earned from equity only. If it is assumed that the ROA is greater than
the interest rate, it will state a loss on debt. Therefore, as it can be seen from the above table
that the ROE of the company are more than ROA, it can be stated that it is earning on its
debt.
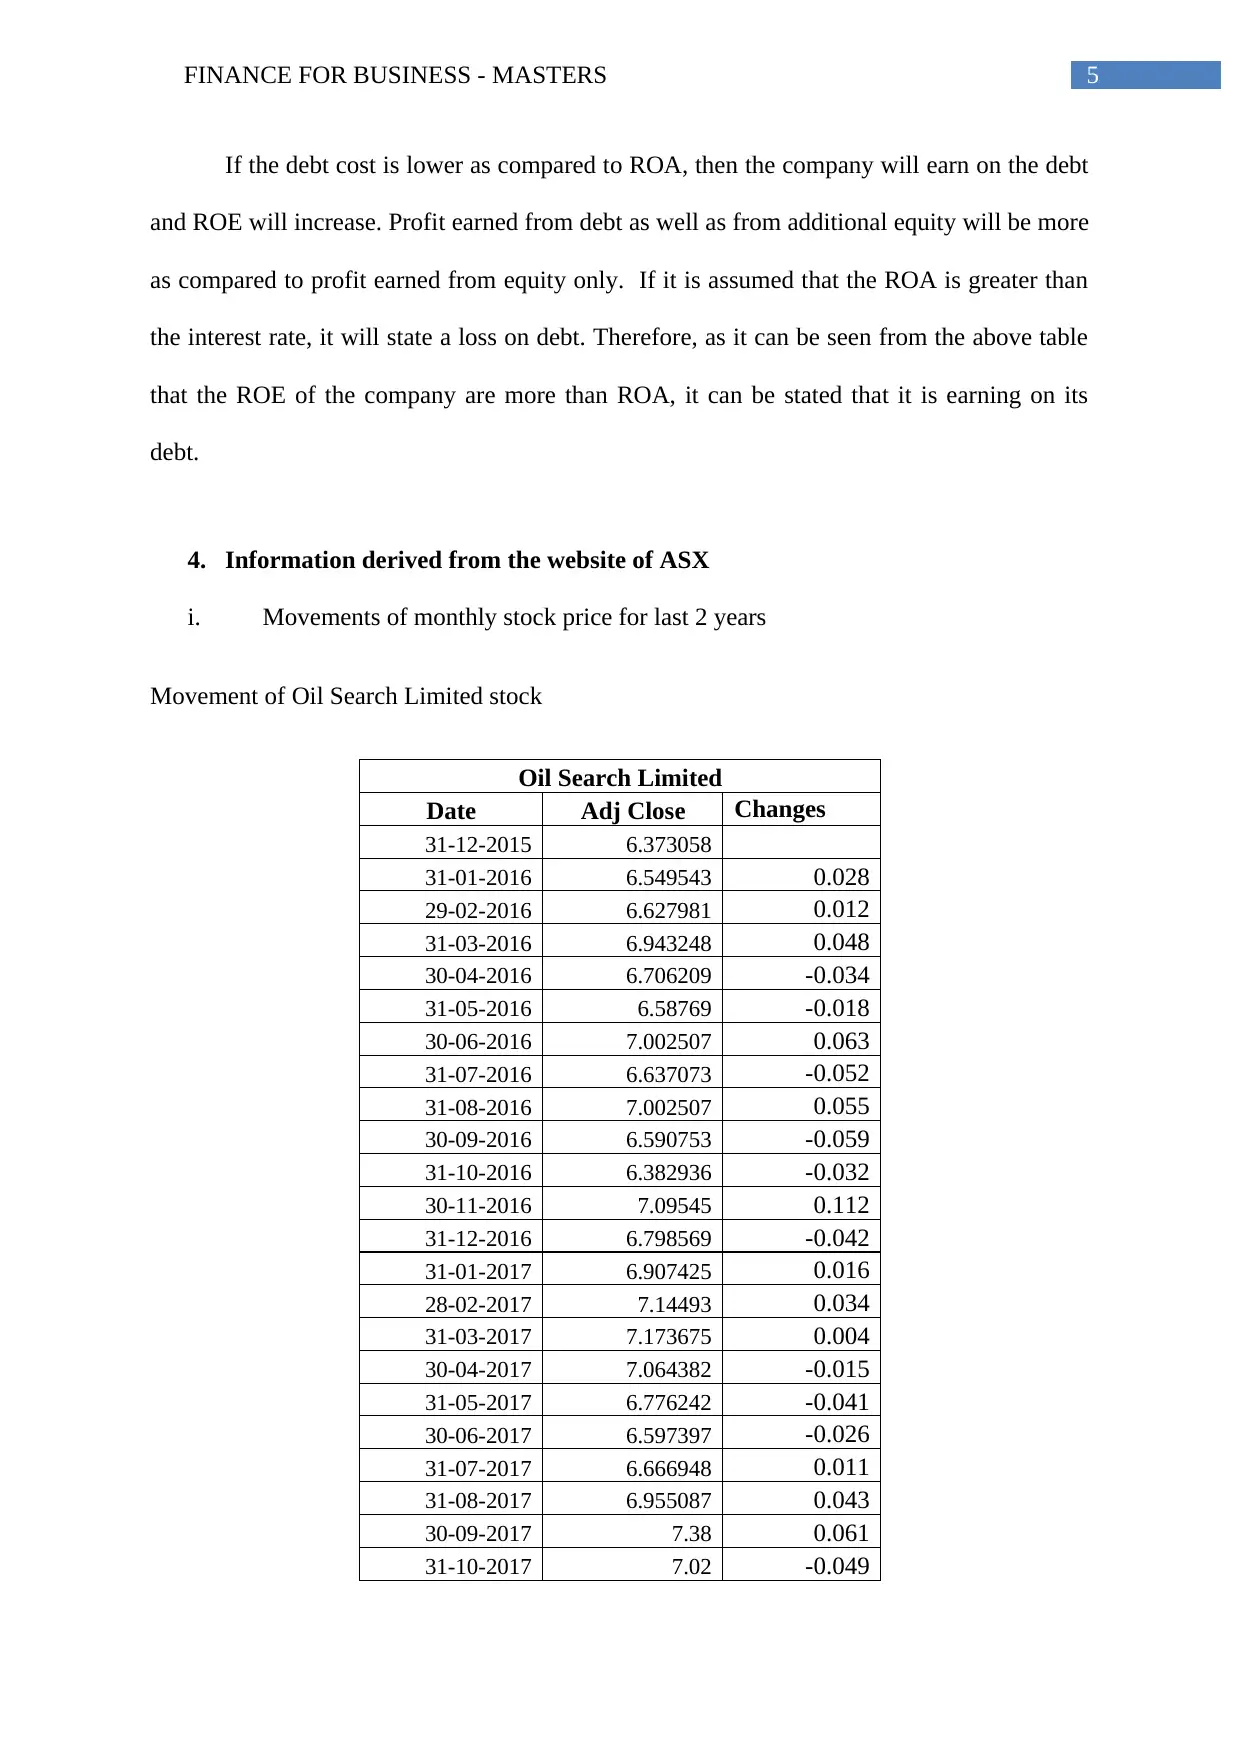
4. Information derived from the website of ASX
i. Movements of monthly stock price for last 2 years
Movement of Oil Search Limited stock
Oil Search Limited
Date Adj Close Changes
31-12-2015 6.373058
31-01-2016 6.549543 0.028
29-02-2016 6.627981 0.012
31-03-2016 6.943248 0.048
30-04-2016 6.706209 -0.034
31-05-2016 6.58769 -0.018
30-06-2016 7.002507 0.063
31-07-2016 6.637073 -0.052
31-08-2016 7.002507 0.055
30-09-2016 6.590753 -0.059
31-10-2016 6.382936 -0.032
30-11-2016 7.09545 0.112
31-12-2016 6.798569 -0.042
31-01-2017 6.907425 0.016
28-02-2017 7.14493 0.034
31-03-2017 7.173675 0.004
30-04-2017 7.064382 -0.015
31-05-2017 6.776242 -0.041
30-06-2017 6.597397 -0.026
31-07-2017 6.666948 0.011
31-08-2017 6.955087 0.043
30-09-2017 7.38 0.061
31-10-2017 7.02 -0.049
If the debt cost is lower as compared to ROA, then the company will earn on the debt
and ROE will increase. Profit earned from debt as well as from additional equity will be more
as compared to profit earned from equity only. If it is assumed that the ROA is greater than
the interest rate, it will state a loss on debt. Therefore, as it can be seen from the above table
that the ROE of the company are more than ROA, it can be stated that it is earning on its
debt.
4. Information derived from the website of ASX
i. Movements of monthly stock price for last 2 years
Movement of Oil Search Limited stock
Oil Search Limited
Date Adj Close Changes
31-12-2015 6.373058
31-01-2016 6.549543 0.028
29-02-2016 6.627981 0.012
31-03-2016 6.943248 0.048
30-04-2016 6.706209 -0.034
31-05-2016 6.58769 -0.018
30-06-2016 7.002507 0.063
31-07-2016 6.637073 -0.052
31-08-2016 7.002507 0.055
30-09-2016 6.590753 -0.059
31-10-2016 6.382936 -0.032
30-11-2016 7.09545 0.112
31-12-2016 6.798569 -0.042
31-01-2017 6.907425 0.016
28-02-2017 7.14493 0.034
31-03-2017 7.173675 0.004
30-04-2017 7.064382 -0.015
31-05-2017 6.776242 -0.041
30-06-2017 6.597397 -0.026
31-07-2017 6.666948 0.011
31-08-2017 6.955087 0.043
30-09-2017 7.38 0.061
31-10-2017 7.02 -0.049
⊘ This is a preview!⊘
Do you want full access?
Subscribe today to unlock all pages.
Trusted by 1+ million students worldwide
6FINANCE FOR BUSINESS - MASTERS
30-11-2017 7.79 0.110
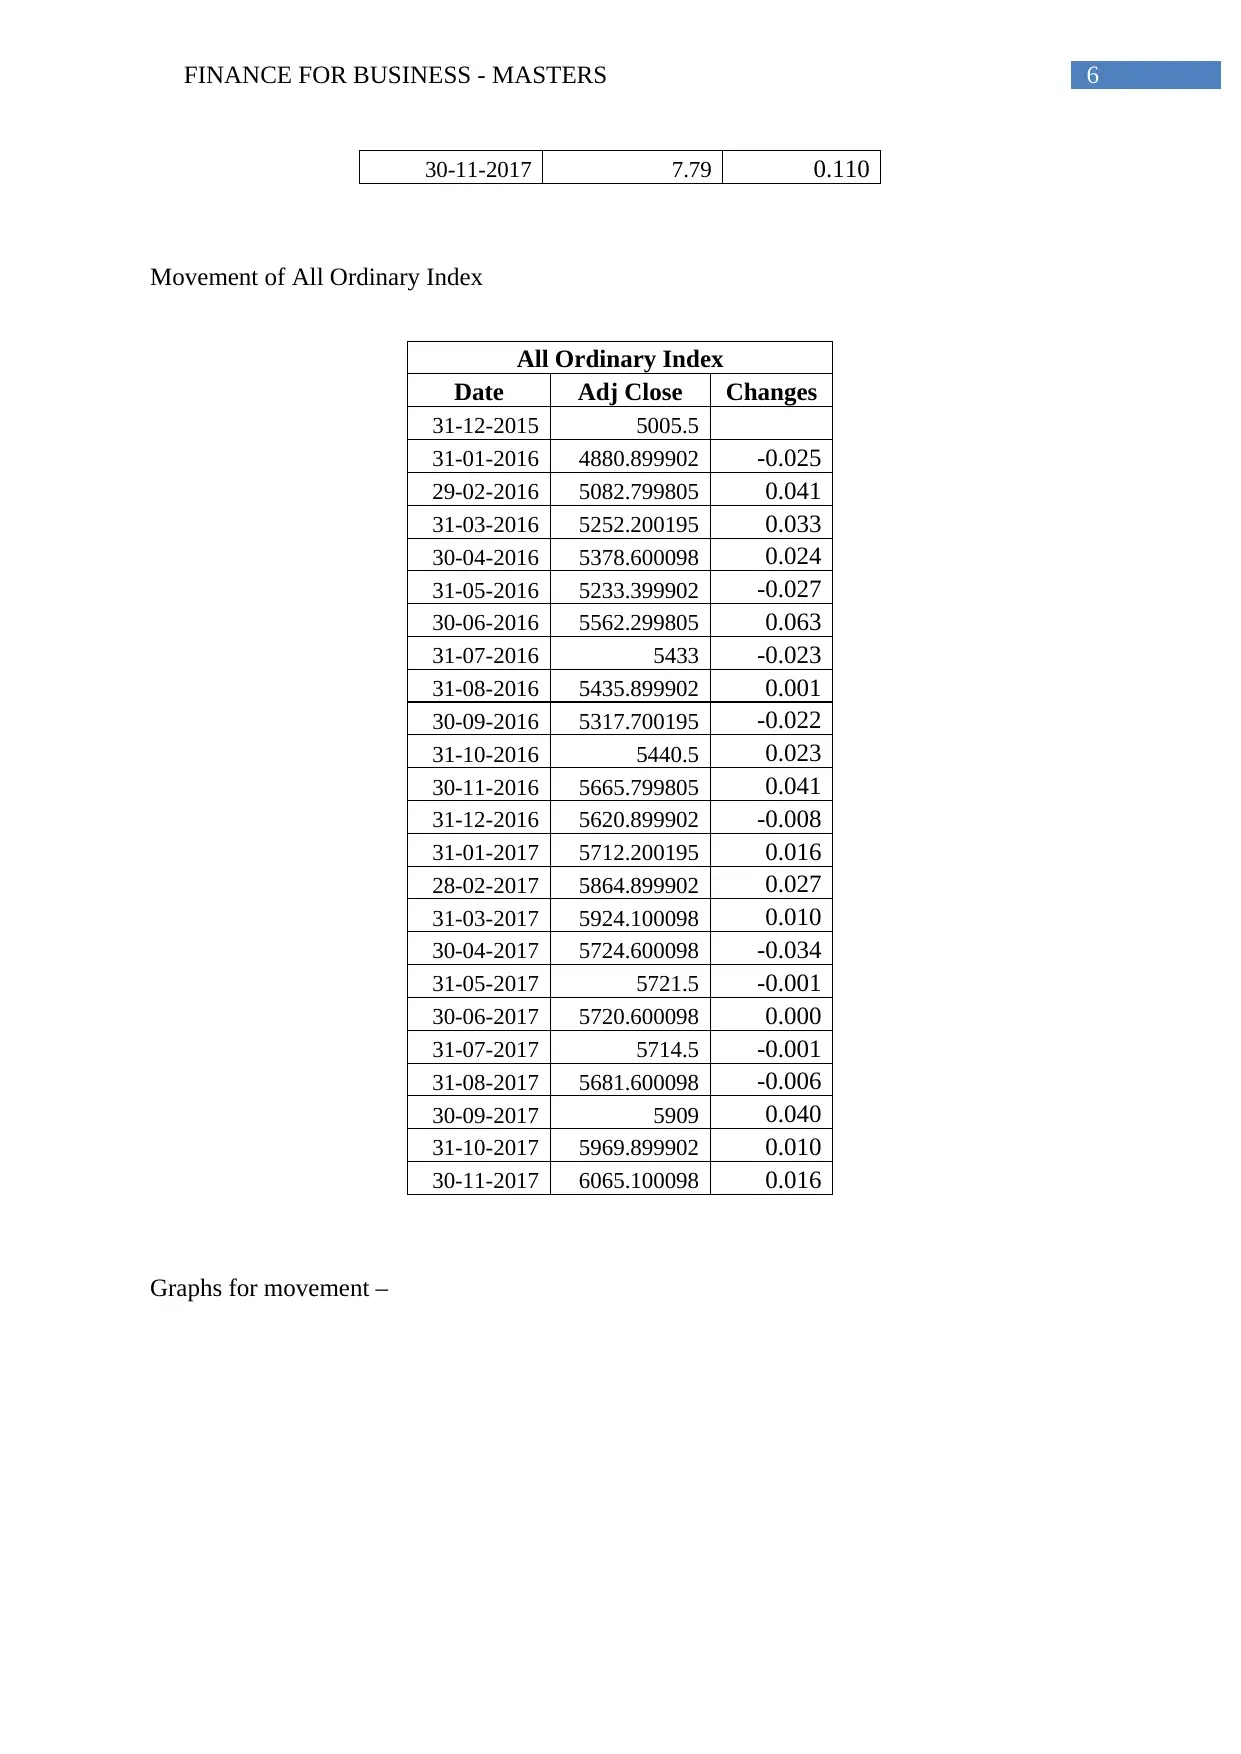
Movement of All Ordinary Index
All Ordinary Index
Date Adj Close Changes
31-12-2015 5005.5
31-01-2016 4880.899902 -0.025
29-02-2016 5082.799805 0.041
31-03-2016 5252.200195 0.033
30-04-2016 5378.600098 0.024
31-05-2016 5233.399902 -0.027
30-06-2016 5562.299805 0.063
31-07-2016 5433 -0.023
31-08-2016 5435.899902 0.001
30-09-2016 5317.700195 -0.022
31-10-2016 5440.5 0.023
30-11-2016 5665.799805 0.041
31-12-2016 5620.899902 -0.008
31-01-2017 5712.200195 0.016
28-02-2017 5864.899902 0.027
31-03-2017 5924.100098 0.010
30-04-2017 5724.600098 -0.034
31-05-2017 5721.5 -0.001
30-06-2017 5720.600098 0.000
31-07-2017 5714.5 -0.001
31-08-2017 5681.600098 -0.006
30-09-2017 5909 0.040
31-10-2017 5969.899902 0.010
30-11-2017 6065.100098 0.016
Graphs for movement –
30-11-2017 7.79 0.110
Movement of All Ordinary Index
All Ordinary Index
Date Adj Close Changes
31-12-2015 5005.5
31-01-2016 4880.899902 -0.025
29-02-2016 5082.799805 0.041
31-03-2016 5252.200195 0.033
30-04-2016 5378.600098 0.024
31-05-2016 5233.399902 -0.027
30-06-2016 5562.299805 0.063
31-07-2016 5433 -0.023
31-08-2016 5435.899902 0.001
30-09-2016 5317.700195 -0.022
31-10-2016 5440.5 0.023
30-11-2016 5665.799805 0.041
31-12-2016 5620.899902 -0.008
31-01-2017 5712.200195 0.016
28-02-2017 5864.899902 0.027
31-03-2017 5924.100098 0.010
30-04-2017 5724.600098 -0.034
31-05-2017 5721.5 -0.001
30-06-2017 5720.600098 0.000
31-07-2017 5714.5 -0.001
31-08-2017 5681.600098 -0.006
30-09-2017 5909 0.040
31-10-2017 5969.899902 0.010
30-11-2017 6065.100098 0.016
Graphs for movement –
Paraphrase This Document
Need a fresh take? Get an instant paraphrase of this document with our AI Paraphraser
7FINANCE FOR BUSINESS - MASTERS
01/12/2015
01/02/2016
01/04/2016
01/06/2016
01/08/2016
01/10/2016
01/12/2016
01/02/2017
01/04/2017
01/06/2017
01/08/2017
01/10/2017
0
1
2
3
4
5
6
7
8
9
Oil Search Limited
Adj Close
01/12/2015
01/02/2016
01/04/2016
01/06/2016
01/08/2016
01/10/2016
01/12/2016
01/02/2017
01/04/2017
01/06/2017
01/08/2017
01/10/2017
0
1000
2000
3000
4000
5000
6000
7000
All Ordinary Index
Adj Close
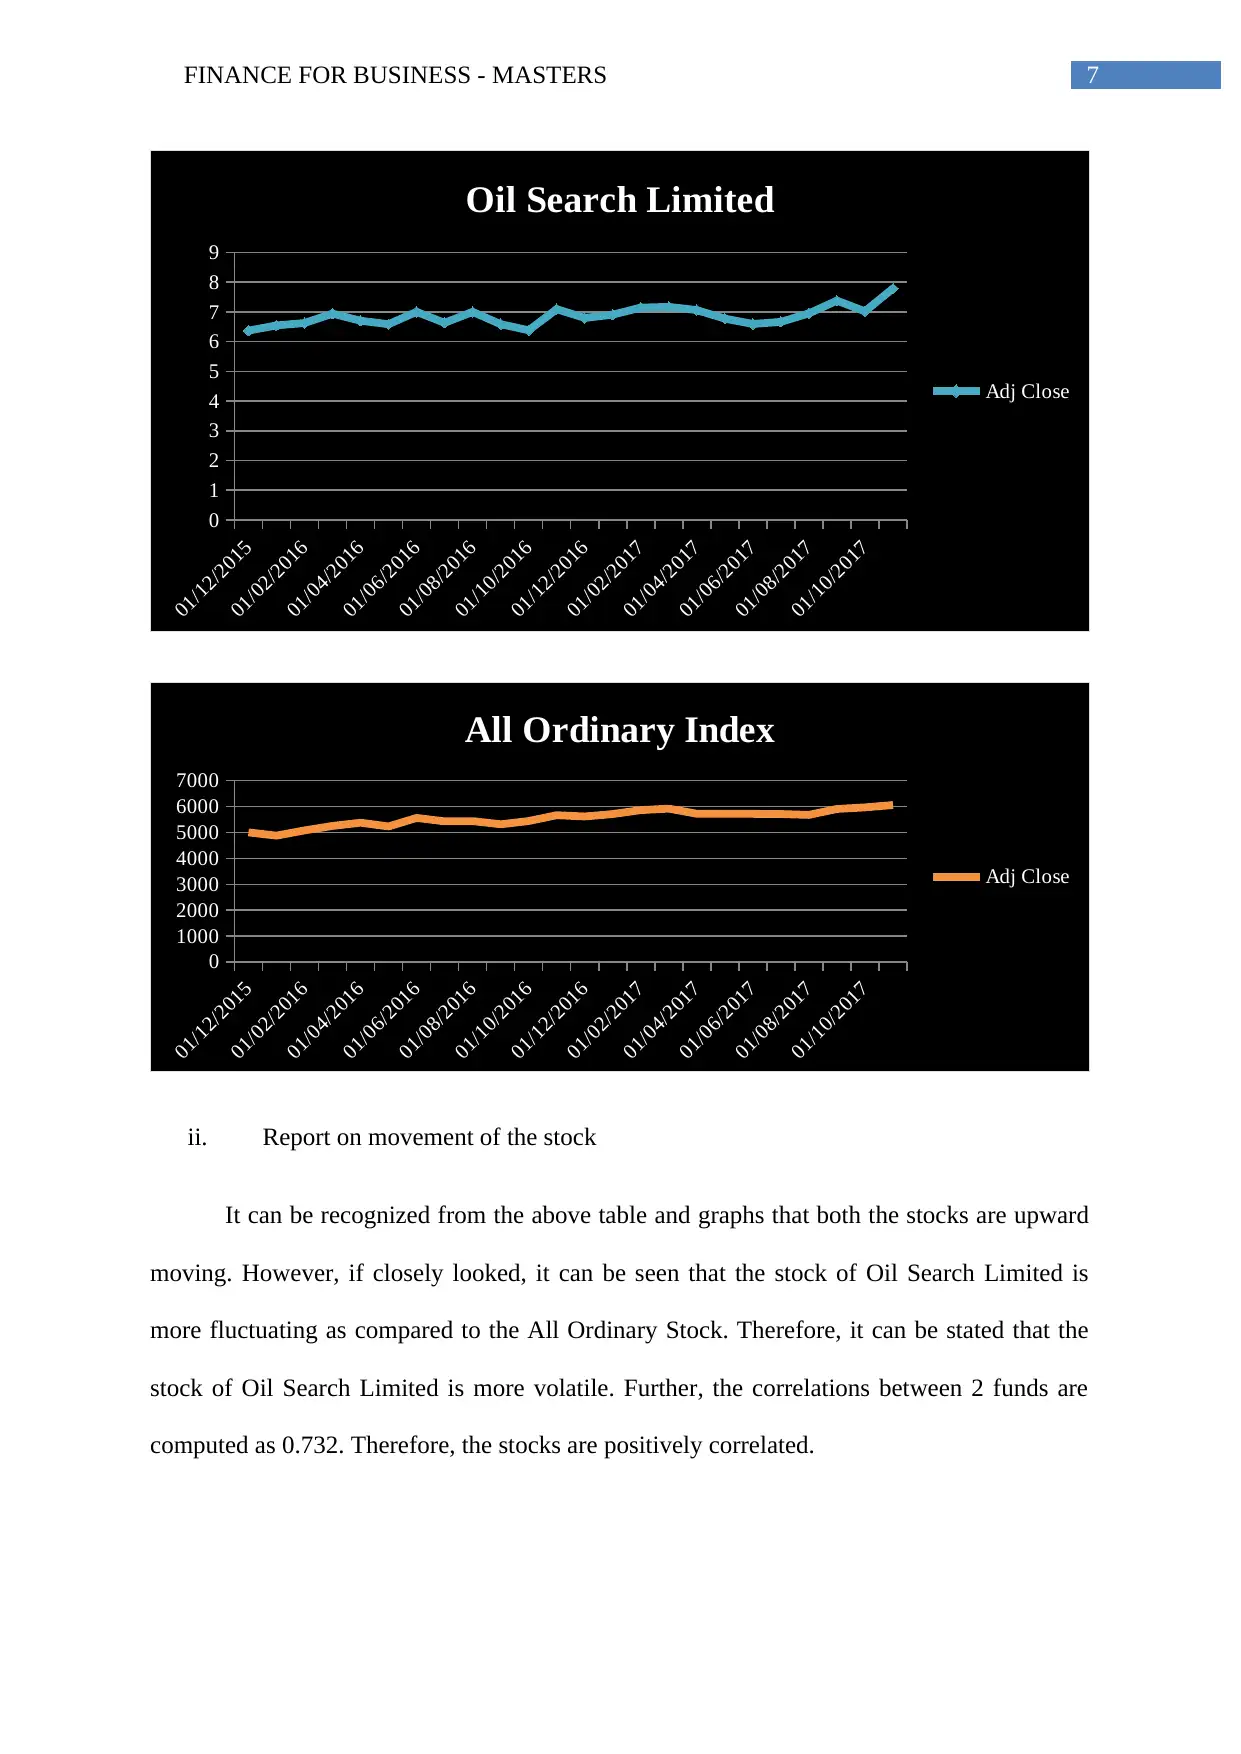
ii. Report on movement of the stock
It can be recognized from the above table and graphs that both the stocks are upward
moving. However, if closely looked, it can be seen that the stock of Oil Search Limited is
more fluctuating as compared to the All Ordinary Stock. Therefore, it can be stated that the
stock of Oil Search Limited is more volatile. Further, the correlations between 2 funds are
computed as 0.732. Therefore, the stocks are positively correlated.
01/12/2015
01/02/2016
01/04/2016
01/06/2016
01/08/2016
01/10/2016
01/12/2016
01/02/2017
01/04/2017
01/06/2017
01/08/2017
01/10/2017
0
1
2
3
4
5
6
7
8
9
Oil Search Limited
Adj Close
01/12/2015
01/02/2016
01/04/2016
01/06/2016
01/08/2016
01/10/2016
01/12/2016
01/02/2017
01/04/2017
01/06/2017
01/08/2017
01/10/2017
0
1000
2000
3000
4000
5000
6000
7000
All Ordinary Index
Adj Close
ii. Report on movement of the stock
It can be recognized from the above table and graphs that both the stocks are upward
moving. However, if closely looked, it can be seen that the stock of Oil Search Limited is
more fluctuating as compared to the All Ordinary Stock. Therefore, it can be stated that the
stock of Oil Search Limited is more volatile. Further, the correlations between 2 funds are
computed as 0.732. Therefore, the stocks are positively correlated.
8FINANCE FOR BUSINESS - MASTERS
5. Recent announcements
On 1st November 2017, the company announced that it has acquired the interest in
world-class Tier 1 oil assets under Alaskan North Slope with material potential of
growth. The acquisition was 8 months of the comprehensive due diligence and it was
very important comprehensive due diligence for the company.
On 24th August 2017 the company served notice regarding change in the substantial
interest with regard to shareholding, under section 671B. For the purpose of notice the
outstanding share balance of 15,23,631,192, shares were used for calculating the
holding percentage.
On 14th June 2017 the company successfully tested the production of Muruk 1ST3 to
south west of Muruk 1 gas recovery. The drilling programme of Muruk successfully
discovered the potential significant new gas field. The data generated from Muruk
well and the 3 sidetracks will be analysed for assessing the potential resources for gas.
On 3rd January 2017, the director of Oil Search Limited Mr Peter Botten changed his
shareholding on account of the ordinary restricted shares. The consideration paid for
each share was A$ 7.17. Prior to change, the number of shareholdings were 23,68,039
ordinary shares. After changing the holding, the number of securities held by the
director was 15,94,082 ordinary shares.
On 21st November 2016 the company successfully help the TB patients to complete
their treatment along with Kikori Hospital. The oil search foundation is continuing
their support to the hospital with the ongoing food supplementation and is also
working with the local group of women for providing food at lower cost for the
patients.
⊘ This is a preview!⊘
Do you want full access?
Subscribe today to unlock all pages.
Trusted by 1+ million students worldwide
9FINANCE FOR BUSINESS - MASTERS
6. Stock field
i. Calculated beta for the company is 0.69
ii. Risk free rate = Rf = 4%, market risk premium = Rm = 6%
Therefore, required rate of return for the company’s share =
R = Rf + β ( Rm – Rf )
R = 4% + 0.69* (6% – 4%) = 5.38% (Zabarankin, Pavlikov and Uryasev 2014)
iii. Conservative investment
Conservative investment is the investment strategy that preserves the value of
investment portfolio through investing at securities associated with lower risks. Lower risks
here mean the investment with fixed money market securities and fixed income (Halili, Saleh
and Zeitun 2015). The fund with lower beta, higher return and regular dividend paying may be
considered as conservative investment. From the above analysis it can be found that the beta
of the company is 0.69 which can be considered as low and the ROE of the company is more
than its ROA (Renneboog and Szilagyi 2015). Further, it can be found from the annual report
of the company that the company is regular in paying dividend to the shareholders and it paid
3.5 US cents dividend per share during the year 2016. Therefore, the company Oil Search
Limited is considered as a conservative investment.
7. Weighted average cost of capital
i. Calculation of WACC
For computation of WACC the company’s capital cost under each category of the
capital is weighted proportionately. All the sources of capital that includes the preferred
stock, common stock, bonds and other non-current debts are taken into consideration for
Paraphrase This Document
Need a fresh take? Get an instant paraphrase of this document with our AI Paraphraser
10FINANCE FOR BUSINESS - MASTERS
calculation of WACC. With the increase of rate of return on the equity and beta the WACC
of the company goes up (Ajanthan 2013). However, the increase in WACC denotes the
reduction in valuation and increase in the risk. The WACC is calculates as follows –
WACC = E/V * Re +D/V * Rd * (1-Tc), Where,
E/V = Percentage of equity in capital structure
D/V = Percentage of debt in capital structure
Re = Cost of equity = 5.38%
Rd = Rate of debt = 4.85%
Tc = corporate tax rate
As per the given information in the annual report –
Amount in $'000
Amount of Debt 4012278.00
Amount of Equity 3147340.00
Total 7159618.00
Percentage of debt 56%
Percentage of equity 44%
Therefore, WACC = 56*5.38% + 44*4.85% (1-0.515)
= 3.018 + 1.03499
= 3.16899% or 3.17%.
ii. Implication of Higher WACC on management’s evaluation
The (WACC) weighted average cost of the capital is the rate which the company
expects for paying on average to all the security holders for financing the assets. It is the
11FINANCE FOR BUSINESS - MASTERS
company’s cost of capital (Zabarankin, Pavlikov and Uryasev 2014). Further, the WACC of
the company is influenced by the external market and not by the management. It shows the
cost of firm for using the money to the projects that are intended for generating growth.
Whether the money is arranged through debt or through equity it comes in exchange of cost.
Higher WACC denotes that the company is associated with more risk. Therefore, if the
company has higher WACC, the management will try to arrange the fund through cheaper
sources (Baños-Caballero, García-Teruel and Martínez-Solano 2014). In such cases, it is the
indication that the company is losing its value and possibilities are there that more efficient
projects are there for investing.
8. Debt ratio
i. Optimal capital structure
Debt ratio Total liabilities / Total assets Year 2016 - 0.533 Year 2015 - 0.545
The optimal capital structure is the optimum debt to equity ratio that can maximise the
value of a company. For any company it is the one that provides the balance among the range
of debt to equity and can minimizes the company’s capital cost (Albul, Jaffee and Tchistyi
2015). Theoretically, the debt finance is regarded as having low cost capital as compared to
equity as the debts are tax deductible. However, with the increase of debt the risk of the
company also increases. Generally, the debt ratio of 50% is considered as optimal capital
structure as the company has a balance among its liabilities and assets (He and
Krishnamurthy 2013). It can be seen from the above table that for both 2015 as well as 2016
the debt ratio of the company is more or less same and it is moving around 50%.
ii. Gearing ratio
⊘ This is a preview!⊘
Do you want full access?
Subscribe today to unlock all pages.
Trusted by 1+ million students worldwide
1 out of 16
Related Documents


Your All-in-One AI-Powered Toolkit for Academic Success.
+13062052269
info@desklib.com
Available 24*7 on WhatsApp / Email
![[object Object]](/_next/static/media/star-bottom.7253800d.svg)
Unlock your academic potential
Copyright © 2020–2025 A2Z Services. All Rights Reserved. Developed and managed by ZUCOL.