Report On Ratio Analysis & Performance Analysis
21 Pages5368 Words111 Views
Added on 2020-02-03
Report On Ratio Analysis & Performance Analysis
Added on 2020-02-03
ShareRelated Documents
FINANCIAL MANAGEMENT ANDCONTROL

TABLE OF CONTENTSINTRODUCTION...........................................................................................................................3Part A...............................................................................................................................................31 Ratio analysis............................................................................................................................32 Limitation of ratio analysis.....................................................................................................13Part B.............................................................................................................................................141 Investment appraisal method and interpretation of results.....................................................142 Benefits and limitations of the project evaluation methods....................................................183 Sources of finance...................................................................................................................19CONCLUSION..............................................................................................................................20REFERENCES..............................................................................................................................21
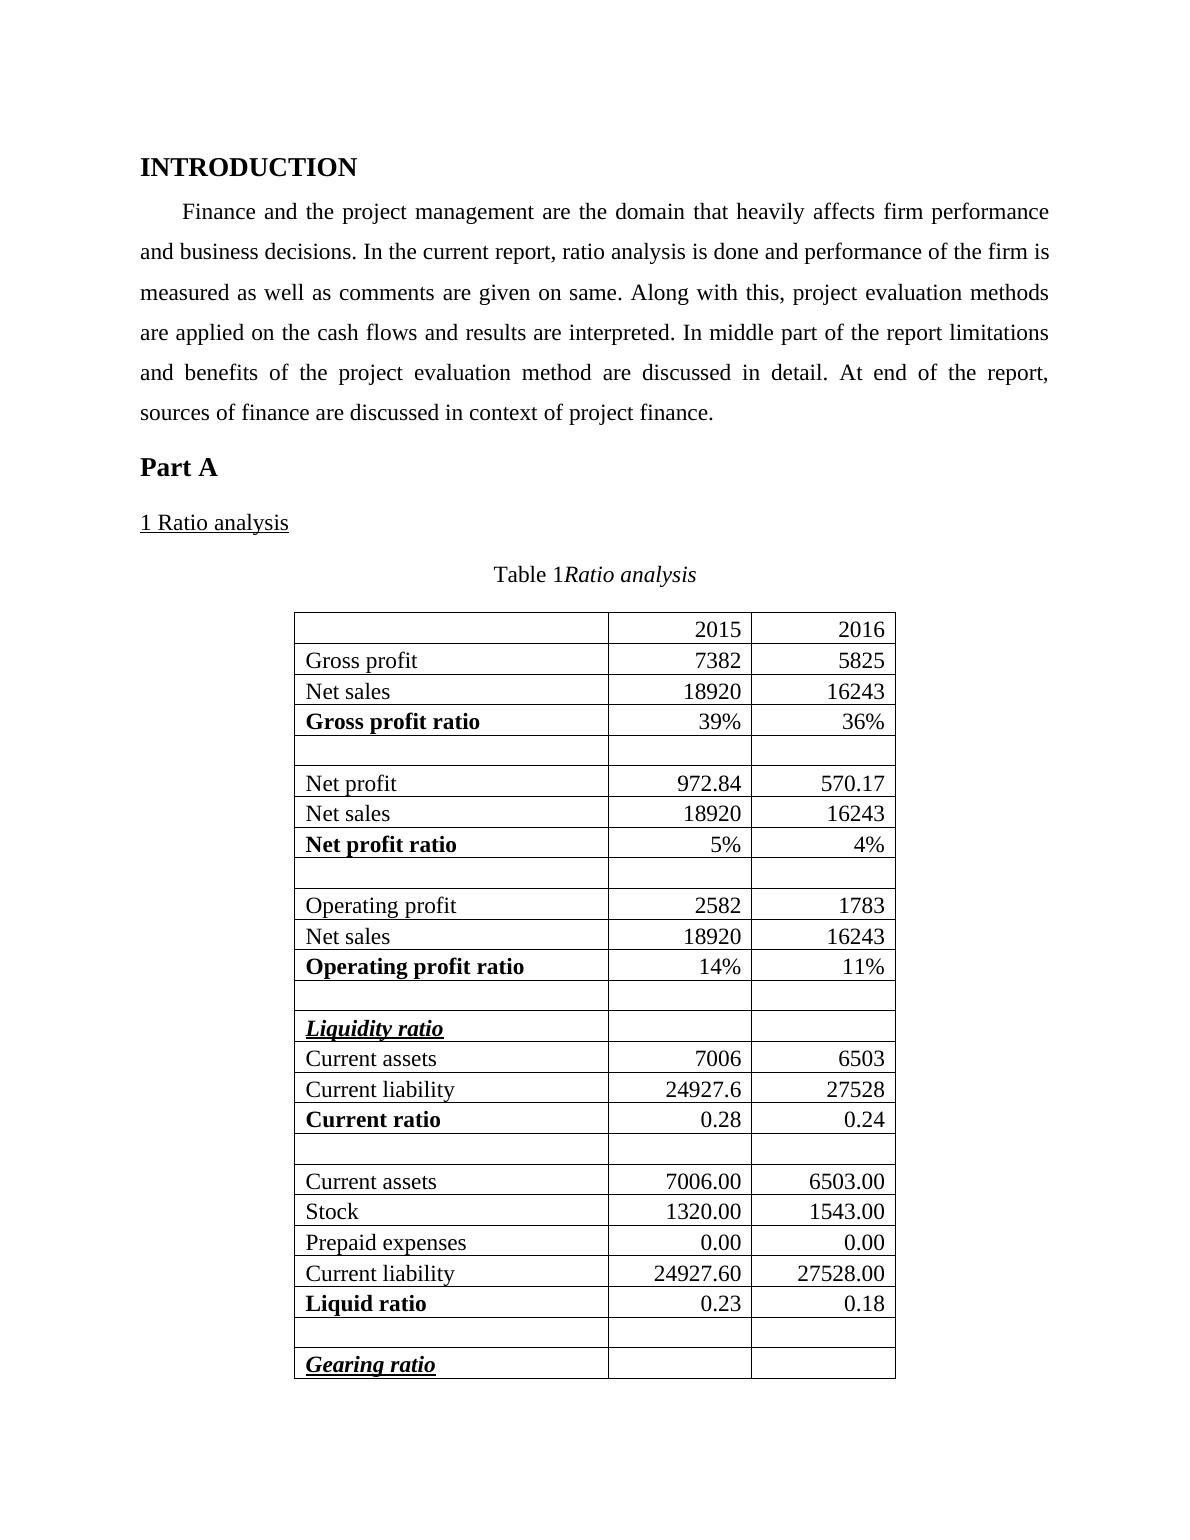
INTRODUCTIONFinance and the project management are the domain that heavily affects firm performanceand business decisions. In the current report, ratio analysis is done and performance of the firm ismeasured as well as comments are given on same. Along with this, project evaluation methodsare applied on the cash flows and results are interpreted. In middle part of the report limitationsand benefits of the project evaluation method are discussed in detail. At end of the report,sources of finance are discussed in context of project finance.Part A1 Ratio analysisTable 1Ratio analysis20152016Gross profit73825825Net sales1892016243Gross profit ratio39%36%Net profit972.84570.17Net sales1892016243Net profit ratio5%4%Operating profit25821783Net sales1892016243Operating profit ratio14%11%Liquidity ratioCurrent assets70066503Current liability24927.627528Current ratio0.280.24Current assets7006.006503.00Stock1320.001543.00Prepaid expenses0.000.00Current liability24927.6027528.00Liquid ratio0.230.18Gearing ratio
Debt21303578Equity19635.1620108Debt equity ratio0.1084788720.177939129EBIT25821783Interest1130932Interest coverage ratio2.281.91Asset utilization ratioNet sales1892016243Fixed assets20331.625726Fixed asset turnover ratio0.930.63Investor ratioNet profit972.84570.17Shares outstanding1241012410EPS0.080.05Net profit972.84570.17Shareholder equity19635.1620108ROE0.050.03Defining ratios Gross profit ratio: Cost is the factor which heavily affects the firm performance to alarge extent in terms of profitability in business. It is important to identify the extent towhich the firm has strong control on its expenses. Further, this is measured by usinggross profit ratio (Brealey and et.al., 2012). If gross profit increases in comparison to theprevious year then it is assumed that good performance is given by the firm in terms ofcost control.Net profit ratio: Net profit ratio is used to measure the overall profitability of businessfirm. Firm capability to control on indirect expenses is measured by using net profit ratio.This is the reason due to which net profit ratio is used by most business firms.Operating profit ratio: Gross and net profit ratio operating ratio is one of the mostimportant ratio. This is the ratio which reflects the performance of firm in terms controlthat it have on the operating expenses. It can be said that profitability ratio is important tothe managers.
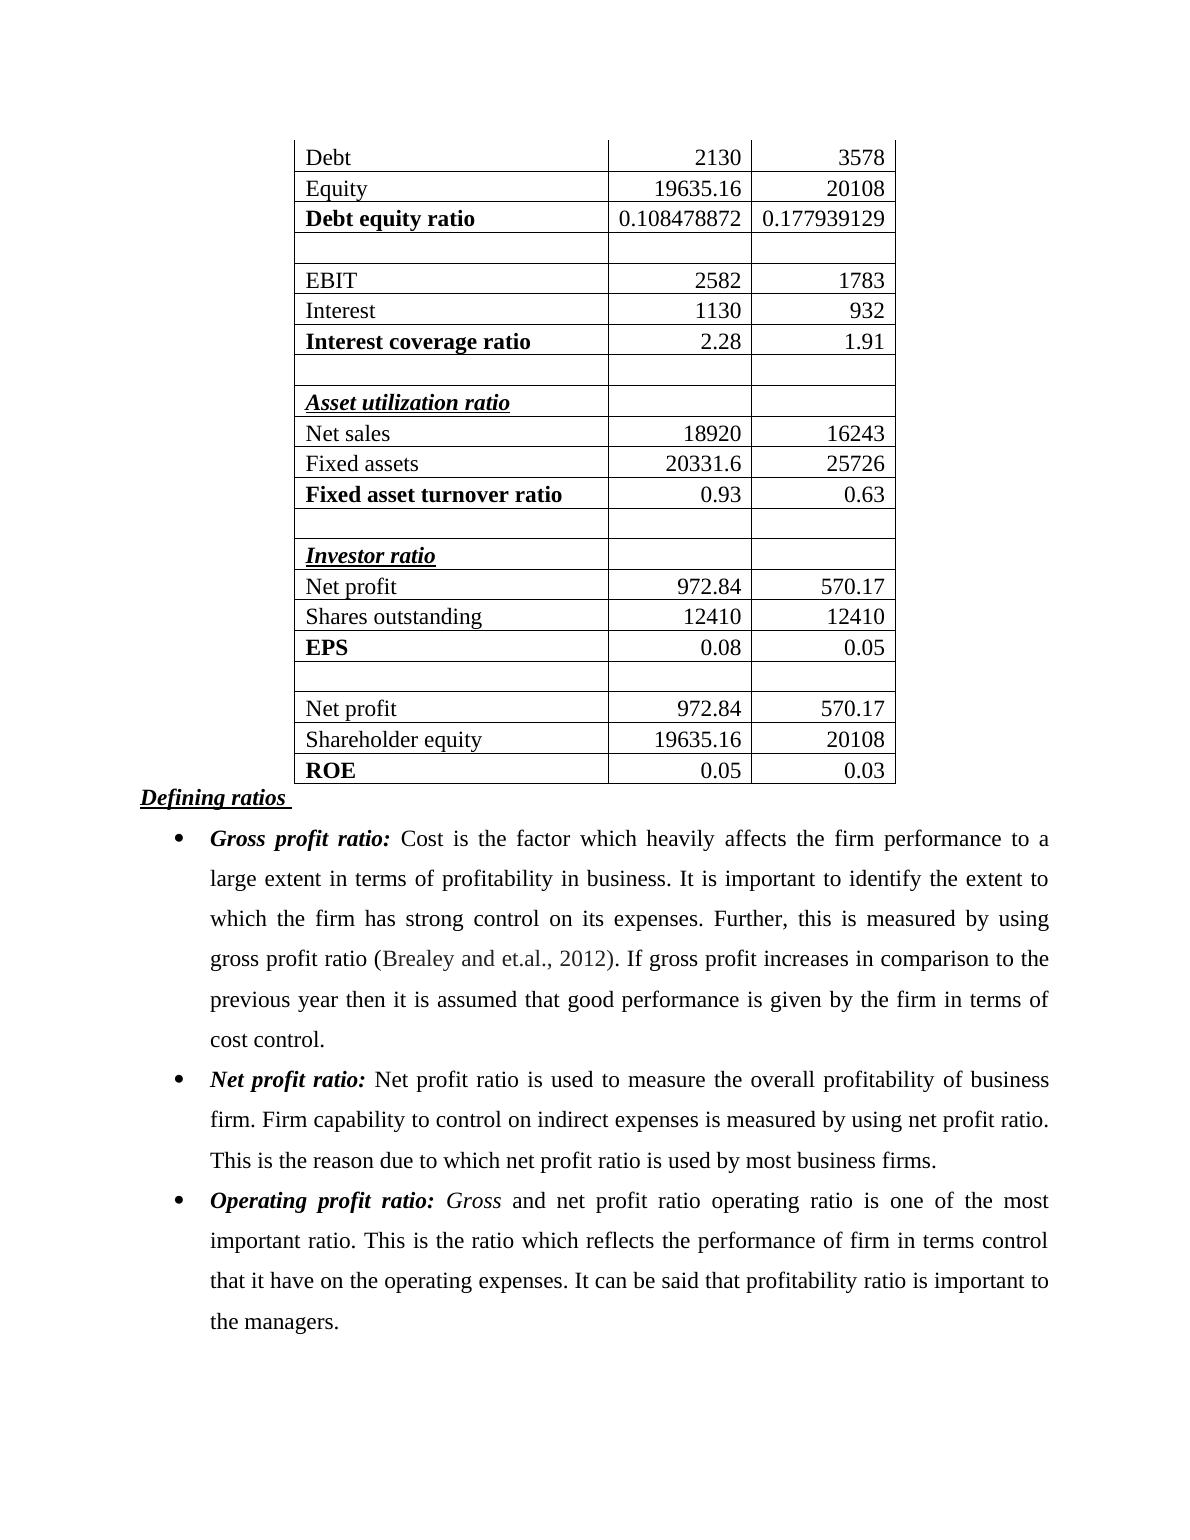
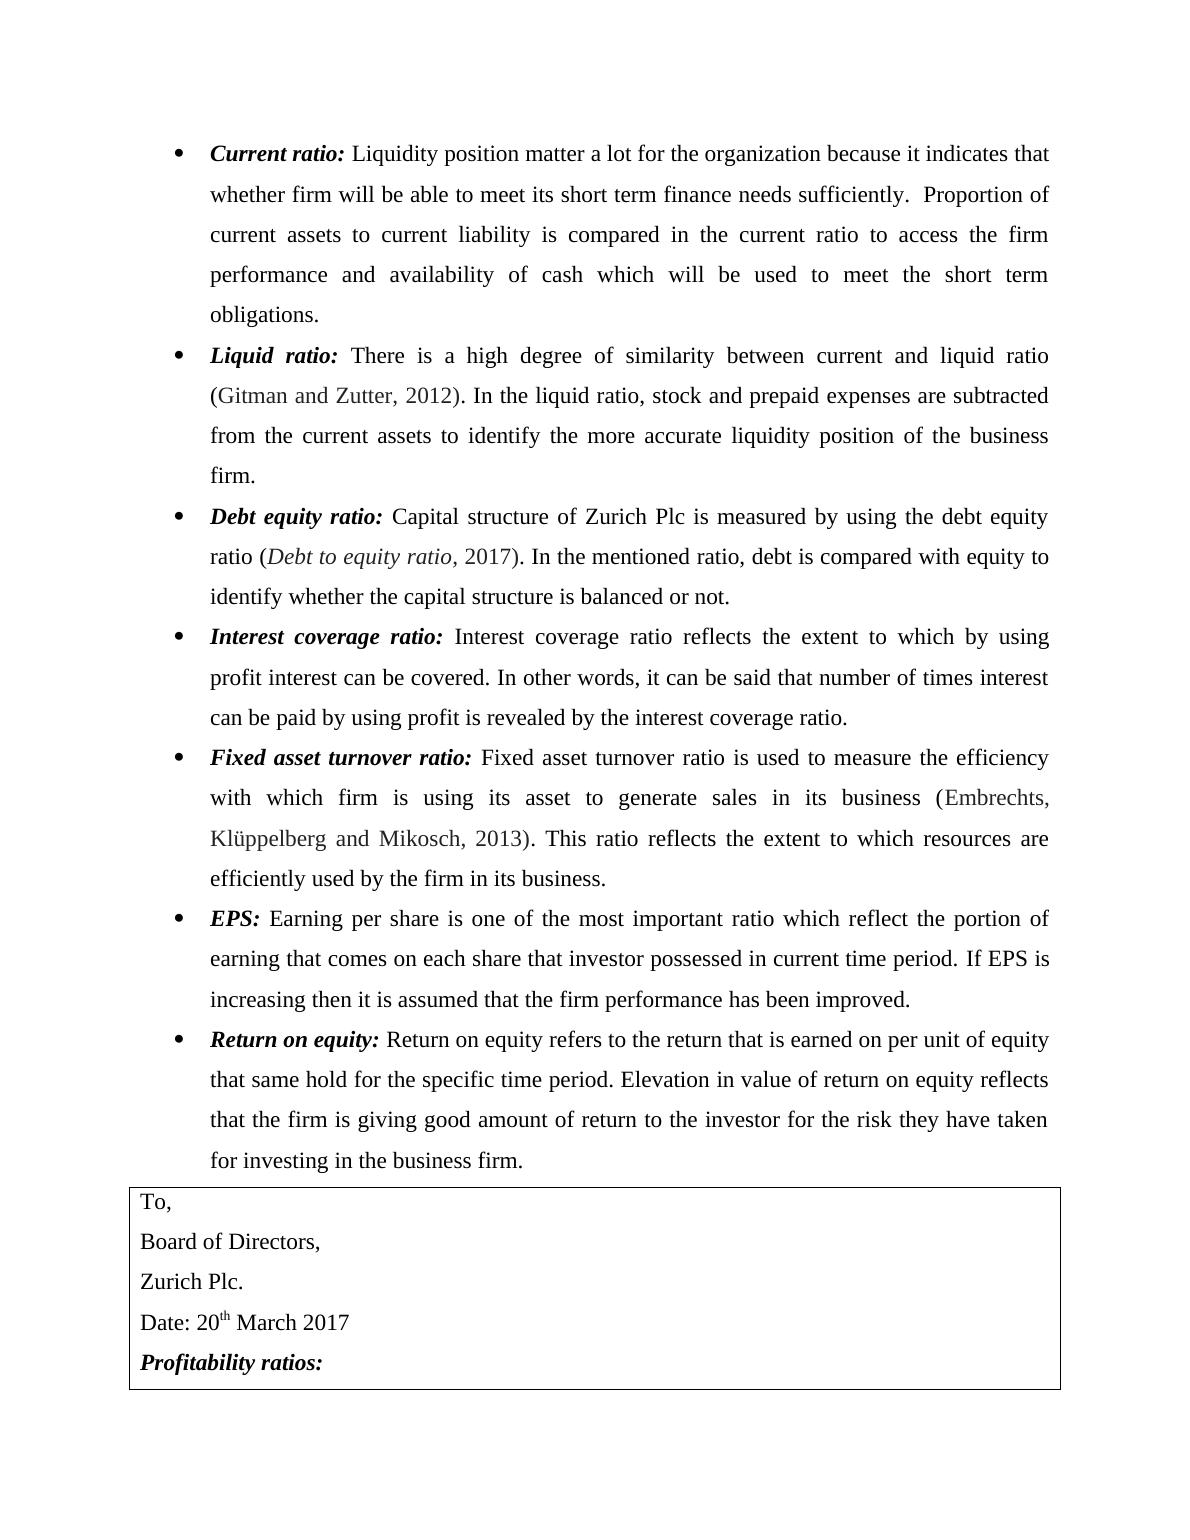
Current ratio: Liquidity position matter a lot for the organization because it indicates thatwhether firm will be able to meet its short term finance needs sufficiently. Proportion ofcurrent assets to current liability is compared in the current ratio to access the firmperformance and availability of cash which will be used to meet the short termobligations.Liquid ratio: There is a high degree of similarity between current and liquid ratio(Gitman and Zutter, 2012). In the liquid ratio, stock and prepaid expenses are subtractedfrom the current assets to identify the more accurate liquidity position of the businessfirm.Debt equity ratio: Capital structure of Zurich Plc is measured by using the debt equityratio (Debt to equity ratio, 2017). In the mentioned ratio, debt is compared with equity toidentify whether the capital structure is balanced or not.Interest coverage ratio: Interest coverage ratio reflects the extent to which by usingprofit interest can be covered. In other words, it can be said that number of times interestcan be paid by using profit is revealed by the interest coverage ratio. Fixed asset turnover ratio: Fixed asset turnover ratio is used to measure the efficiencywith which firm is using its asset to generate sales in its business (Embrechts,Klüppelberg and Mikosch, 2013). This ratio reflects the extent to which resources areefficiently used by the firm in its business.EPS: Earning per share is one of the most important ratio which reflect the portion ofearning that comes on each share that investor possessed in current time period.If EPS isincreasing then it is assumed that the firm performance has been improved.Return on equity: Return on equity refers to the return that is earned on per unit of equitythat same hold for the specific time period. Elevation in value of return on equity reflectsthat the firm is giving good amount of return to the investor for the risk they have takenfor investing in the business firm.To,Board of Directors,Zurich Plc.Date: 20th March 2017Profitability ratios:
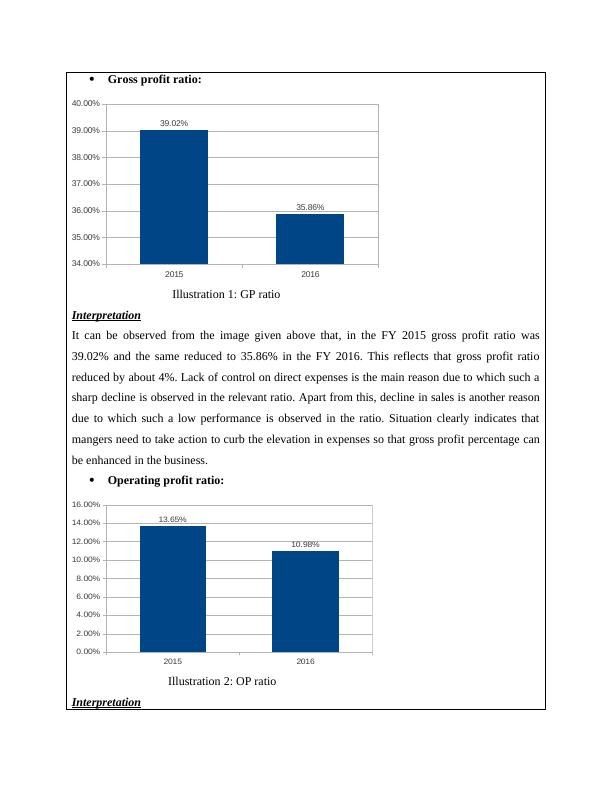
Gross profit ratio:2015201634.00%35.00%36.00%37.00%38.00%39.00%40.00%39.02%35.86%Illustration 1: GP ratioInterpretationIt can be observed from the image given above that, in the FY 2015 gross profit ratio was39.02% and the same reduced to 35.86% in the FY 2016. This reflects that gross profit ratioreduced by about 4%. Lack of control on direct expenses is the main reason due to which such asharp decline is observed in the relevant ratio. Apart from this, decline in sales is another reasondue to which such a low performance is observed in the ratio. Situation clearly indicates thatmangers need to take action to curb the elevation in expenses so that gross profit percentage canbe enhanced in the business. Operating profit ratio:201520160.00%2.00%4.00%6.00%8.00%10.00%12.00%14.00%16.00%13.65%10.98%Illustration 2: OP ratioInterpretation
End of preview
Want to access all the pages? Upload your documents or become a member.
Related Documents
Ratio Analysis of Tesco Company - Reportlg...
|10
|3272
|292
Performance Management Assignment - Analysis of Profitability, Liquidity and Efficiency Ratioslg...
|10
|2736
|394
Report- Zurich Plc|Financial Performance Analysis|Financial Managementlg...
|27
|5277
|77
GAA6000 - Advanced Performance Managementlg...
|10
|2702
|66
Financial Management and Analysislg...
|16
|3639
|23
Assignment || Financial Analysislg...
|10
|1382
|28