Financial Analysis of Royal Dutch Shell & Tesco
VerifiedAdded on 2020/06/05
|14
|2463
|68
AI Summary
This assignment presents a comparative financial analysis of two prominent companies, Royal Dutch Shell and Tesco. It examines their fluctuating market values, particularly focusing on share price changes over a specific period. The report delves into industry trends, comparing the companies' performance against the FTSE 100 benchmark to determine investment attractiveness. The ultimate objective is to assess which company, based on its share price stability and market value trends, presents a more favorable investment opportunity for stakeholders.
Contribute Materials
Your contribution can guide someone’s learning journey. Share your
documents today.

STOCK MARKET REPORT
Secure Best Marks with AI Grader
Need help grading? Try our AI Grader for instant feedback on your assignments.
TABLE OF CONTENTS
INTRODUCTION...........................................................................................................................1
Share value of Royal Dutchshell plc. Vs. FTSE 100 price indexes:......................................1
Comparison between share values of Tesco and FTSE 100 pricing indexes:........................3
Share price values of Royal Dutchshell with compared to FTSE 100...................................6
Share price value of Tesco in comparison with FTSE 100....................................................8
CONCLUSION..............................................................................................................................11
REFERENCES..............................................................................................................................12
INTRODUCTION
In order to analyse the stock market value of the respected shares, there has been
consideration of share value of Royal Dutchshell and Tesco plc. Therefore, these shares will be
compared with FTSE 100's pricing index. However, it will be helpful to determine the rise and
fall in the market value of these industries. Thus, it will be beneficial for investors in investment
decisions.
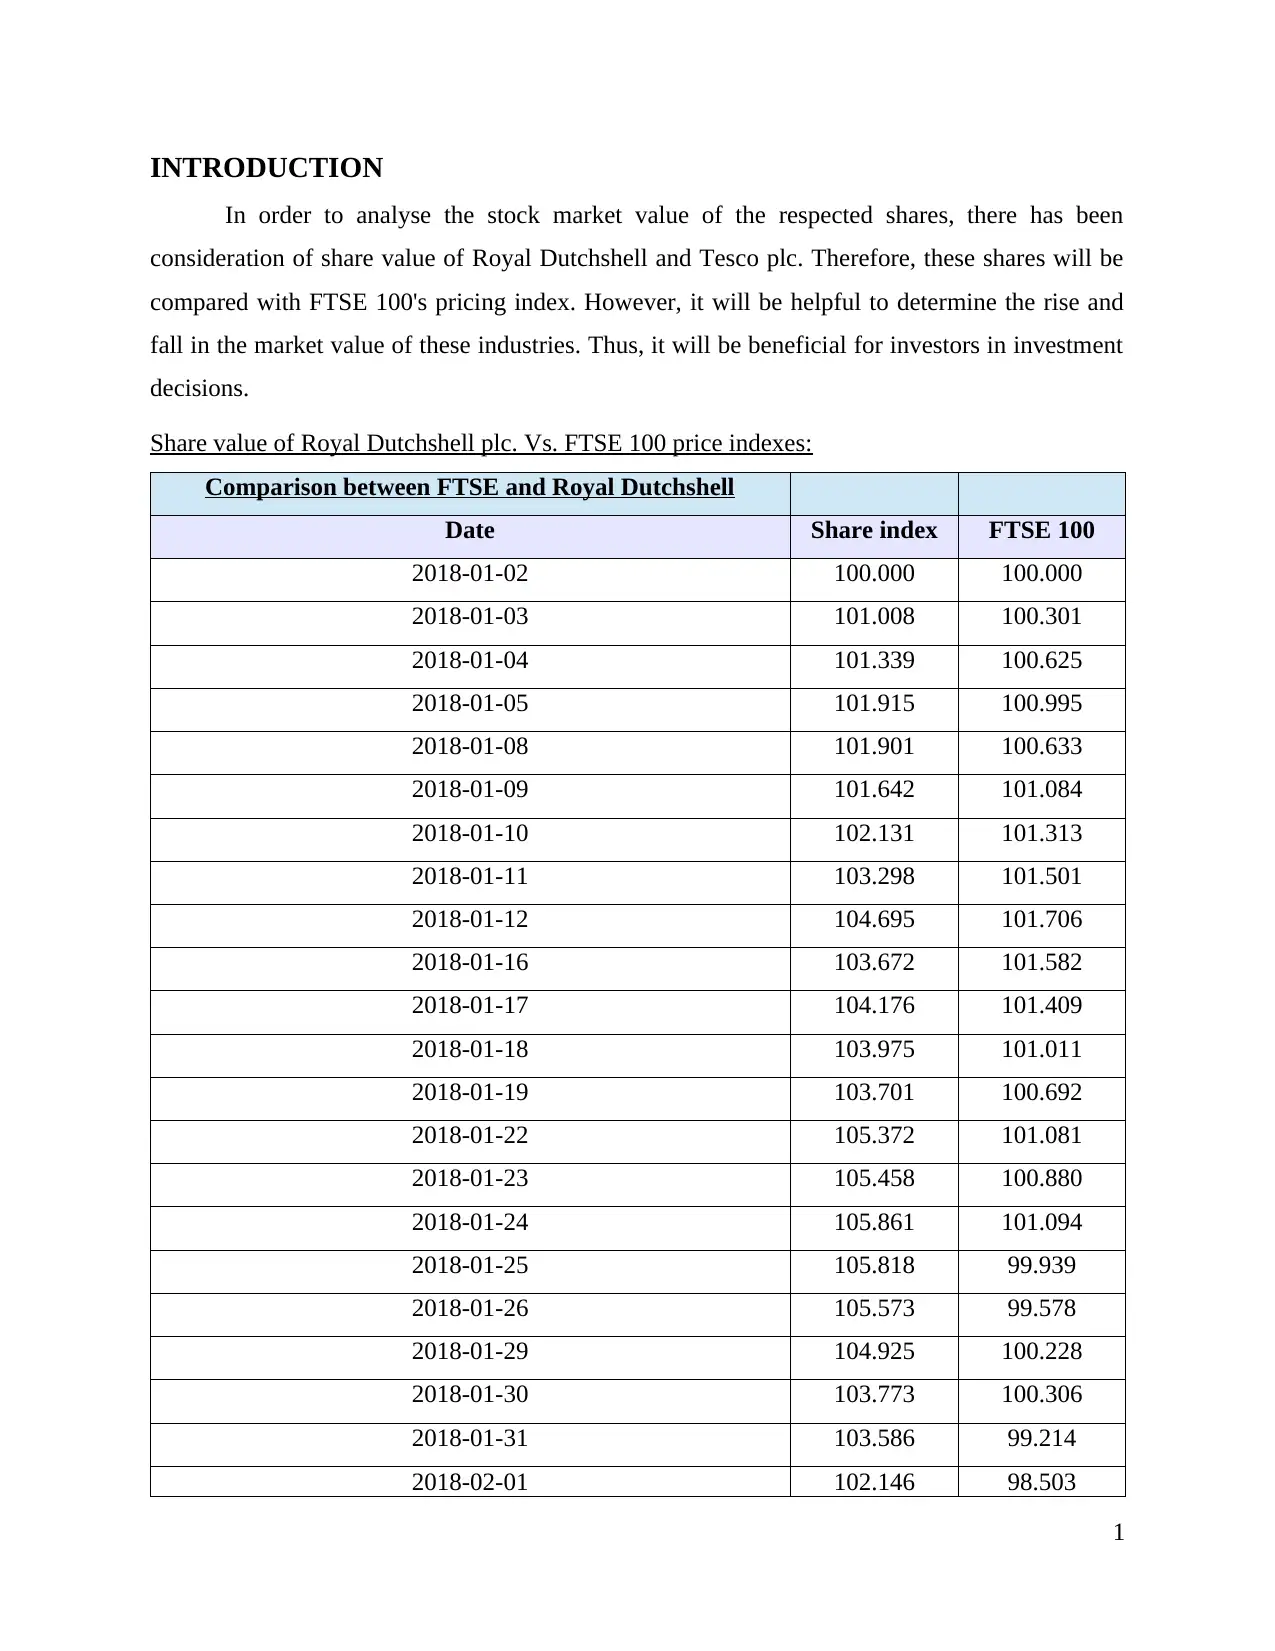
Share value of Royal Dutchshell plc. Vs. FTSE 100 price indexes:
Comparison between FTSE and Royal Dutchshell
Date Share index FTSE 100
2018-01-02 100.000 100.000
2018-01-03 101.008 100.301
2018-01-04 101.339 100.625
2018-01-05 101.915 100.995
2018-01-08 101.901 100.633
2018-01-09 101.642 101.084
2018-01-10 102.131 101.313
2018-01-11 103.298 101.501
2018-01-12 104.695 101.706
2018-01-16 103.672 101.582
2018-01-17 104.176 101.409
2018-01-18 103.975 101.011
2018-01-19 103.701 100.692
2018-01-22 105.372 101.081
2018-01-23 105.458 100.880
2018-01-24 105.861 101.094
2018-01-25 105.818 99.939
2018-01-26 105.573 99.578
2018-01-29 104.925 100.228
2018-01-30 103.773 100.306
2018-01-31 103.586 99.214
2018-02-01 102.146 98.503
1
In order to analyse the stock market value of the respected shares, there has been
consideration of share value of Royal Dutchshell and Tesco plc. Therefore, these shares will be
compared with FTSE 100's pricing index. However, it will be helpful to determine the rise and
fall in the market value of these industries. Thus, it will be beneficial for investors in investment
decisions.
Share value of Royal Dutchshell plc. Vs. FTSE 100 price indexes:
Comparison between FTSE and Royal Dutchshell
Date Share index FTSE 100
2018-01-02 100.000 100.000
2018-01-03 101.008 100.301
2018-01-04 101.339 100.625
2018-01-05 101.915 100.995
2018-01-08 101.901 100.633
2018-01-09 101.642 101.084
2018-01-10 102.131 101.313
2018-01-11 103.298 101.501
2018-01-12 104.695 101.706
2018-01-16 103.672 101.582
2018-01-17 104.176 101.409
2018-01-18 103.975 101.011
2018-01-19 103.701 100.692
2018-01-22 105.372 101.081
2018-01-23 105.458 100.880
2018-01-24 105.861 101.094
2018-01-25 105.818 99.939
2018-01-26 105.573 99.578
2018-01-29 104.925 100.228
2018-01-30 103.773 100.306
2018-01-31 103.586 99.214
2018-02-01 102.146 98.503
1
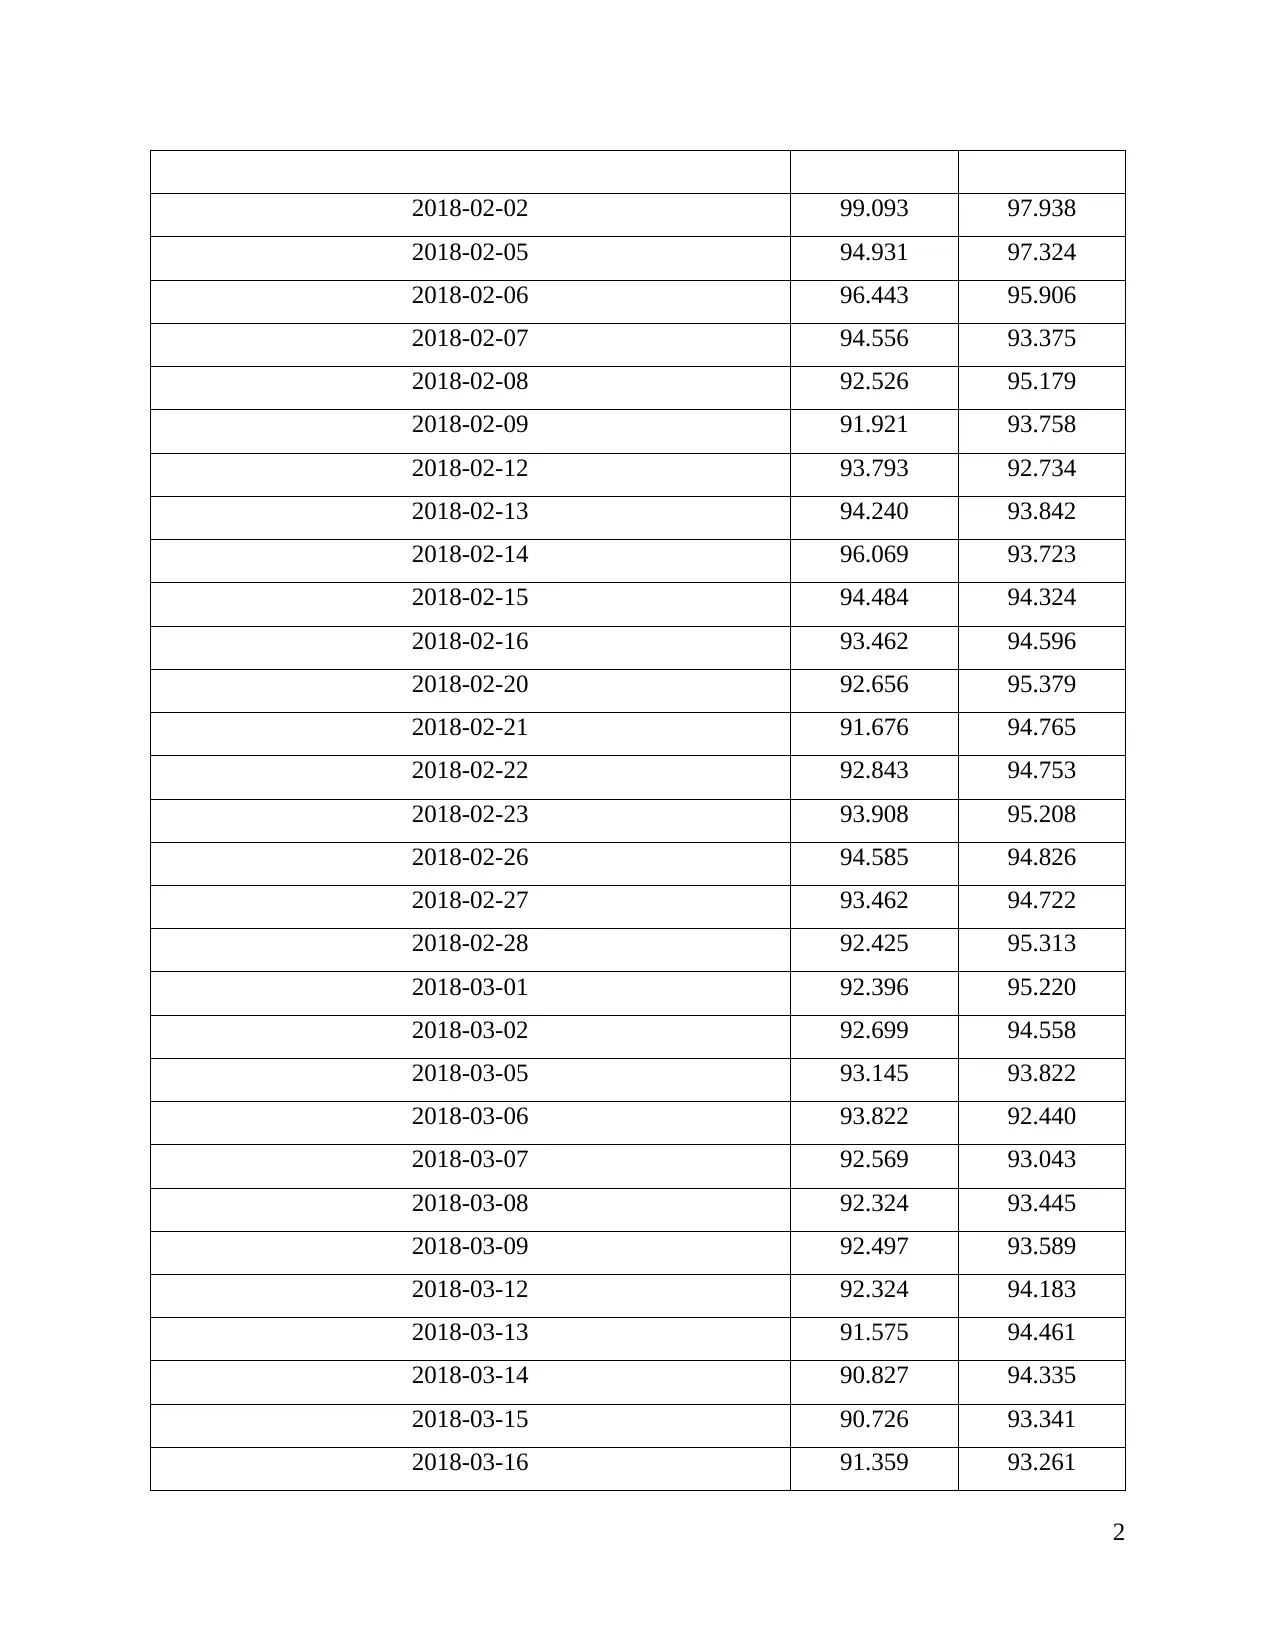
2018-02-02 99.093 97.938
2018-02-05 94.931 97.324
2018-02-06 96.443 95.906
2018-02-07 94.556 93.375
2018-02-08 92.526 95.179
2018-02-09 91.921 93.758
2018-02-12 93.793 92.734
2018-02-13 94.240 93.842
2018-02-14 96.069 93.723
2018-02-15 94.484 94.324
2018-02-16 93.462 94.596
2018-02-20 92.656 95.379
2018-02-21 91.676 94.765
2018-02-22 92.843 94.753
2018-02-23 93.908 95.208
2018-02-26 94.585 94.826
2018-02-27 93.462 94.722
2018-02-28 92.425 95.313
2018-03-01 92.396 95.220
2018-03-02 92.699 94.558
2018-03-05 93.145 93.822
2018-03-06 93.822 92.440
2018-03-07 92.569 93.043
2018-03-08 92.324 93.445
2018-03-09 92.497 93.589
2018-03-12 92.324 94.183
2018-03-13 91.575 94.461
2018-03-14 90.827 94.335
2018-03-15 90.726 93.341
2018-03-16 91.359 93.261
2
Secure Best Marks with AI Grader
Need help grading? Try our AI Grader for instant feedback on your assignments.
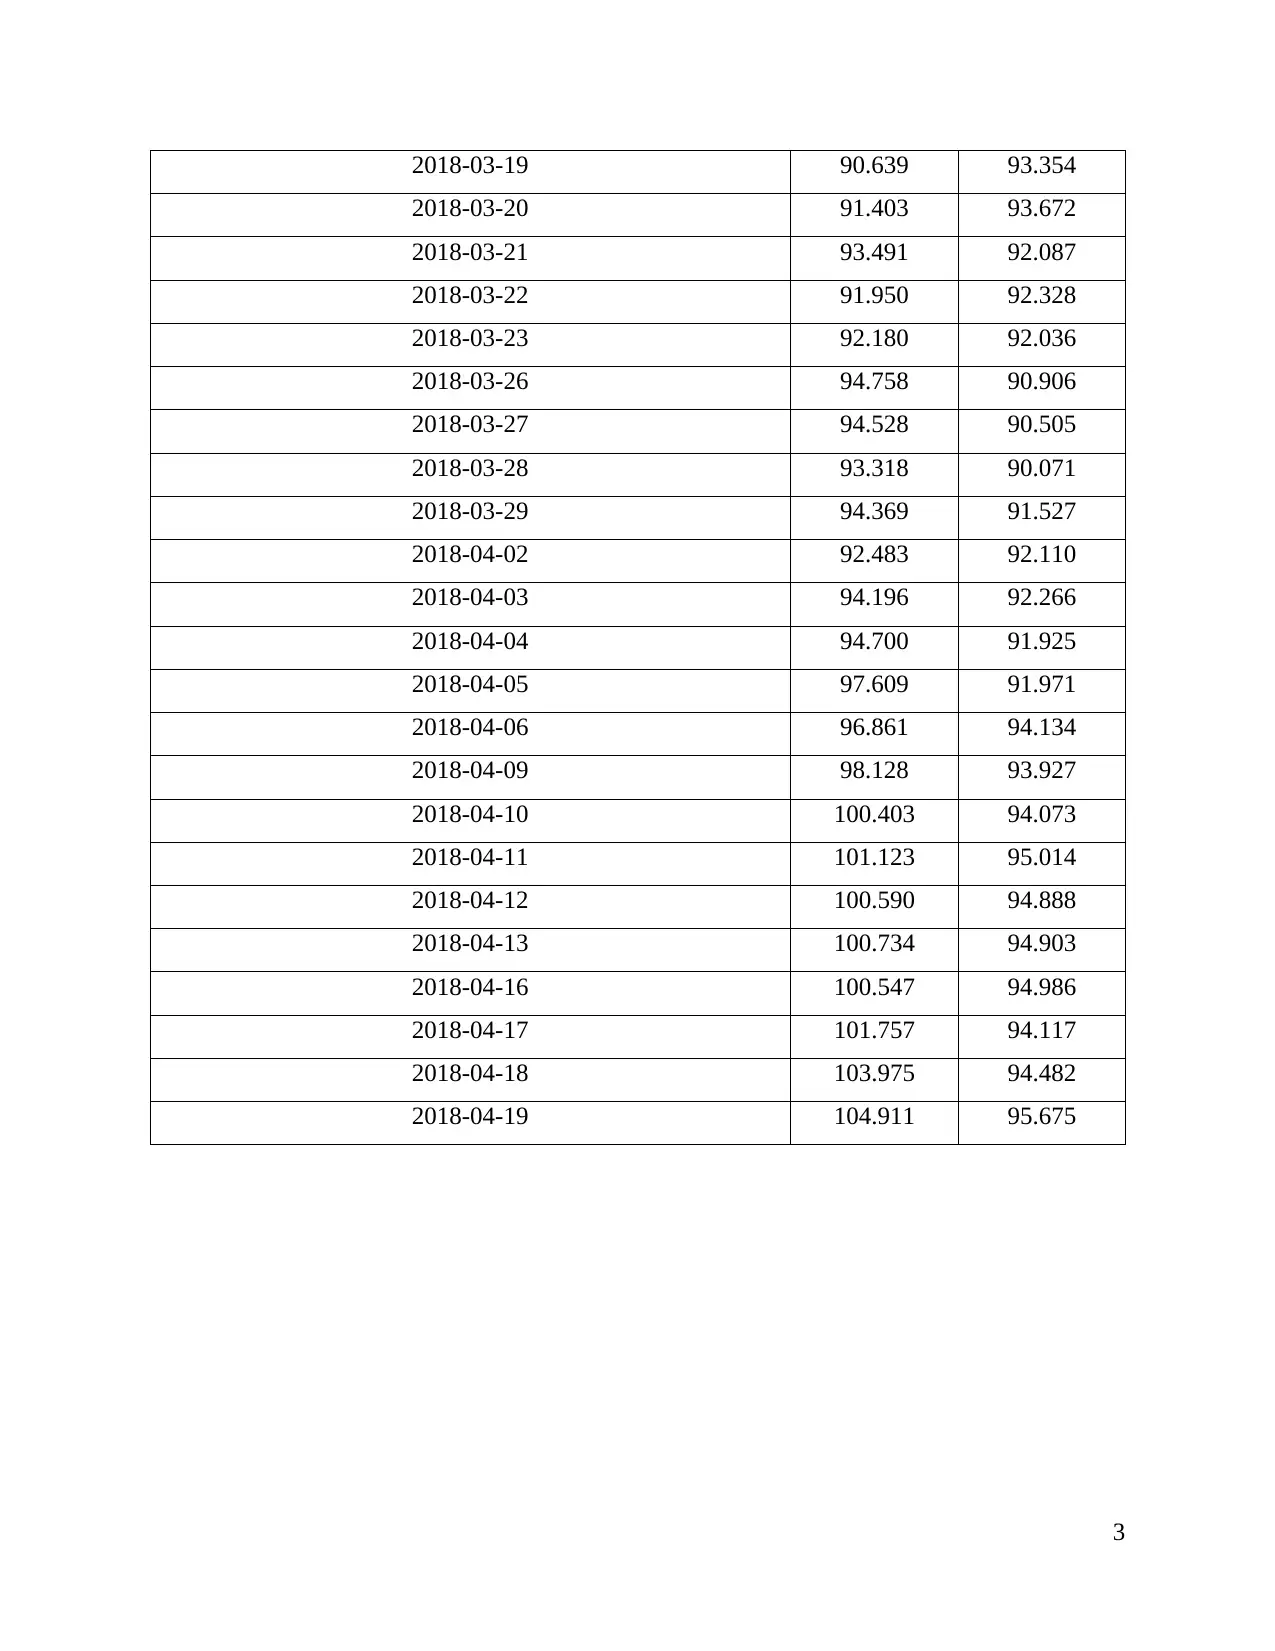
2018-03-19 90.639 93.354
2018-03-20 91.403 93.672
2018-03-21 93.491 92.087
2018-03-22 91.950 92.328
2018-03-23 92.180 92.036
2018-03-26 94.758 90.906
2018-03-27 94.528 90.505
2018-03-28 93.318 90.071
2018-03-29 94.369 91.527
2018-04-02 92.483 92.110
2018-04-03 94.196 92.266
2018-04-04 94.700 91.925
2018-04-05 97.609 91.971
2018-04-06 96.861 94.134
2018-04-09 98.128 93.927
2018-04-10 100.403 94.073
2018-04-11 101.123 95.014
2018-04-12 100.590 94.888
2018-04-13 100.734 94.903
2018-04-16 100.547 94.986
2018-04-17 101.757 94.117
2018-04-18 103.975 94.482
2018-04-19 104.911 95.675
3
0 10 20 30 40 50 60 70 80
80
85
90
95
100
105
110
Share index
FTSE 100
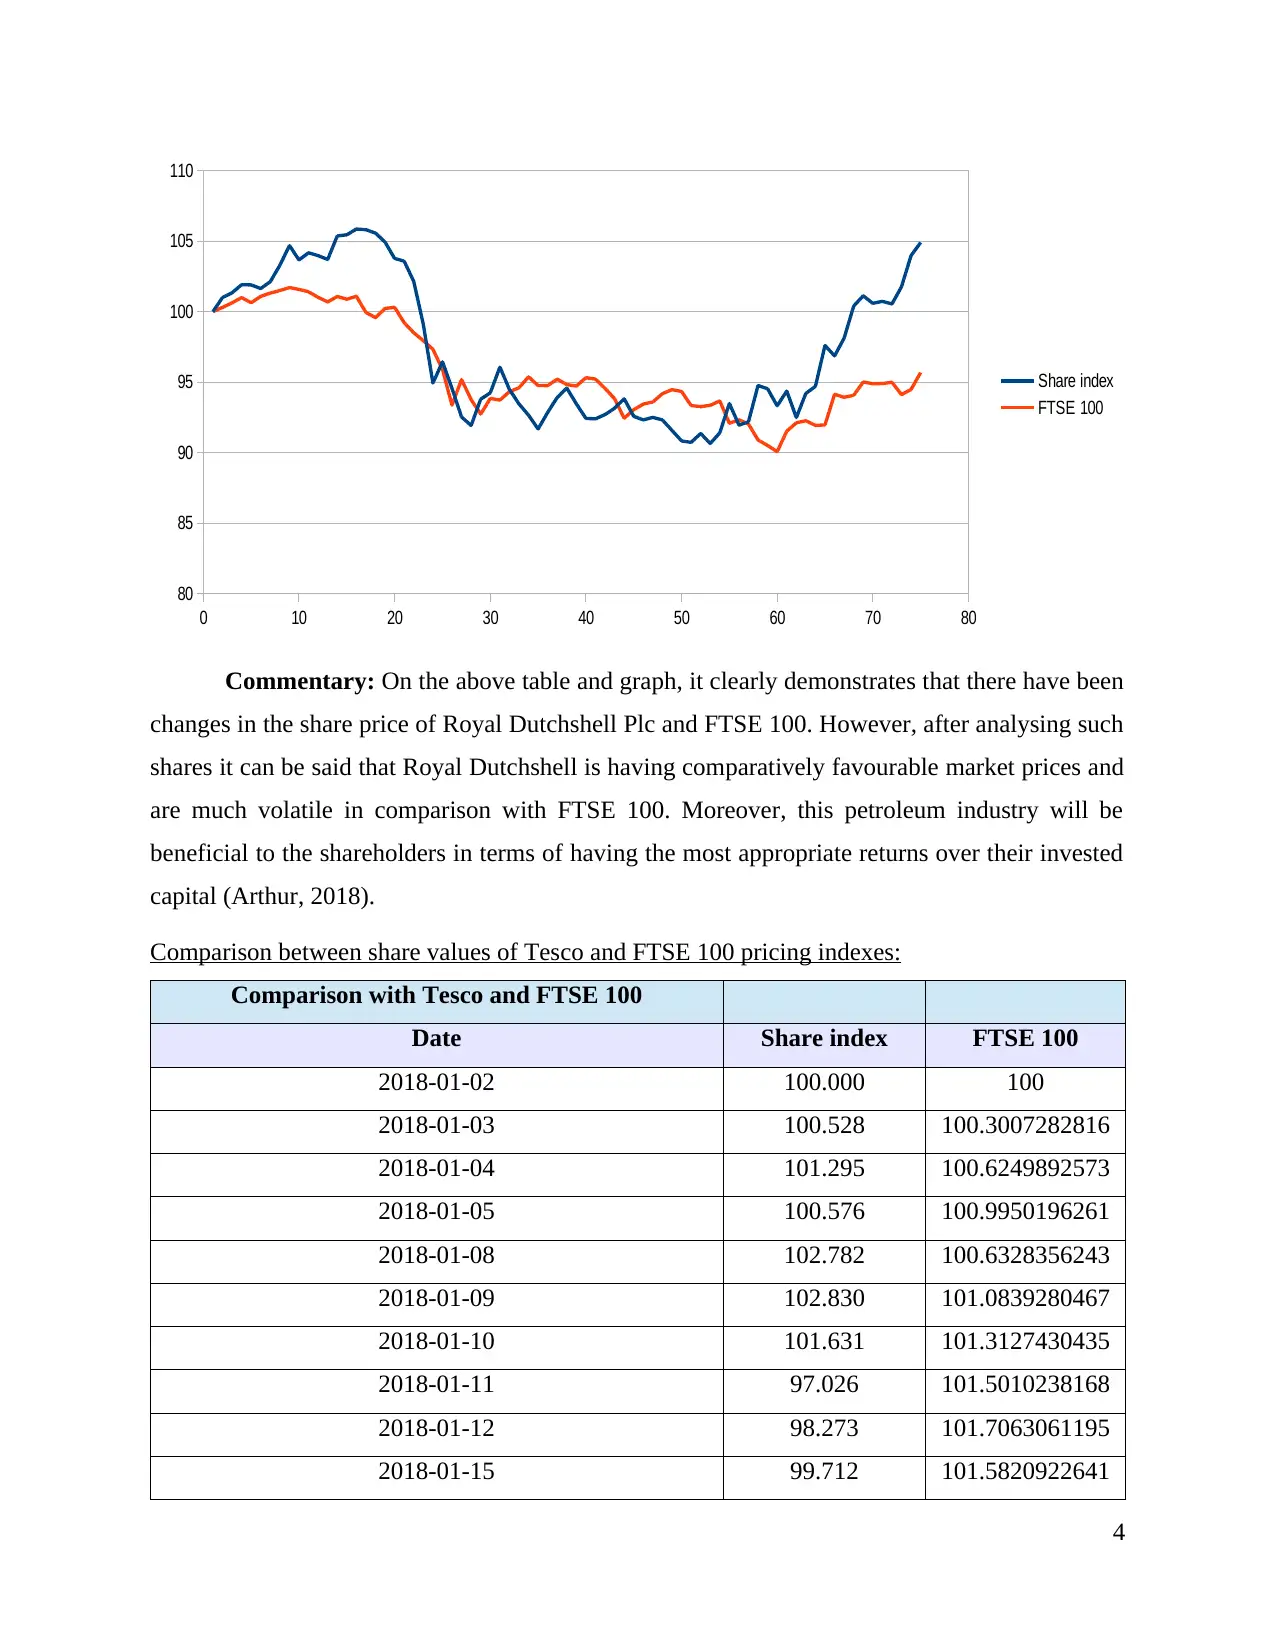
Commentary: On the above table and graph, it clearly demonstrates that there have been
changes in the share price of Royal Dutchshell Plc and FTSE 100. However, after analysing such
shares it can be said that Royal Dutchshell is having comparatively favourable market prices and
are much volatile in comparison with FTSE 100. Moreover, this petroleum industry will be
beneficial to the shareholders in terms of having the most appropriate returns over their invested
capital (Arthur, 2018).
Comparison between share values of Tesco and FTSE 100 pricing indexes:
Comparison with Tesco and FTSE 100
Date Share index FTSE 100
2018-01-02 100.000 100
2018-01-03 100.528 100.3007282816
2018-01-04 101.295 100.6249892573
2018-01-05 100.576 100.9950196261
2018-01-08 102.782 100.6328356243
2018-01-09 102.830 101.0839280467
2018-01-10 101.631 101.3127430435
2018-01-11 97.026 101.5010238168
2018-01-12 98.273 101.7063061195
2018-01-15 99.712 101.5820922641
4
80
85
90
95
100
105
110
Share index
FTSE 100
Commentary: On the above table and graph, it clearly demonstrates that there have been
changes in the share price of Royal Dutchshell Plc and FTSE 100. However, after analysing such
shares it can be said that Royal Dutchshell is having comparatively favourable market prices and
are much volatile in comparison with FTSE 100. Moreover, this petroleum industry will be
beneficial to the shareholders in terms of having the most appropriate returns over their invested
capital (Arthur, 2018).
Comparison between share values of Tesco and FTSE 100 pricing indexes:
Comparison with Tesco and FTSE 100
Date Share index FTSE 100
2018-01-02 100.000 100
2018-01-03 100.528 100.3007282816
2018-01-04 101.295 100.6249892573
2018-01-05 100.576 100.9950196261
2018-01-08 102.782 100.6328356243
2018-01-09 102.830 101.0839280467
2018-01-10 101.631 101.3127430435
2018-01-11 97.026 101.5010238168
2018-01-12 98.273 101.7063061195
2018-01-15 99.712 101.5820922641
4
2018-01-16 101.583 101.409497818
2018-01-17 101.679 101.0107059663
2018-01-18 100.576 100.6916737663
2018-01-19 99.664 101.0813104685
2018-01-22 99.281 100.8799545395
2018-01-23 100.528 101.0943856112
2018-01-24 100.192 99.9385442667
2018-01-25 100.576 99.5776690605
2018-01-26 101.439 100.2275062012
2018-01-29 101.103 100.3059570573
2018-01-30 100.432 99.2141826437
2018-01-31 100.240 98.5028961633
2018-02-01 98.945 97.9380474369
2018-02-02 96.978 97.323515731
2018-02-05 95.324 95.906171546
2018-02-06 95.875 93.3748226421
2018-02-07 97.122 95.1791923317
2018-02-08 97.074 93.7579281536
2018-02-09 95.588 92.7341406509
2018-02-12 96.691 93.8416077985
2018-02-13 97.410 93.7226227187
2018-02-14 96.978 94.3240792819
2018-02-15 97.698 94.5960397
2018-02-16 98.129 95.3792458457
2018-02-19 98.801 94.7647141399
2018-02-20 99.041 94.7529414121
2018-02-21 99.424 95.2079602084
2018-02-22 98.945 94.8261634794
2018-02-23 98.513 94.721562338
2018-02-26 98.801 95.3125613498
2018-02-27 99.329 95.2197265554
5
Paraphrase This Document
Need a fresh take? Get an instant paraphrase of this document with our AI Paraphraser
2018-02-28 101.103 94.5581230545
2018-03-01 100.048 93.8219950845
2018-03-02 96.882 92.4399499406
2018-03-05 97.842 93.0427152995
2018-03-06 101.199 93.4454271443
2018-03-07 101.343 93.5892537138
2018-03-08 100.671 94.1828702907
2018-03-09 102.014 94.4613682801
2018-03-12 101.583 94.3345368464
2018-03-13 101.199 93.3408260029
2018-03-14 100.863 93.2610727318
2018-03-15 102.638 93.3539011456
2018-03-16 100.624 93.6716309437
2018-03-19 99.089 92.0869210883
2018-03-20 99.233 92.3275024453
2018-03-21 98.705 92.0359293132
2018-03-22 97.170 90.9062382672
2018-03-23 97.314 90.5048288242
2018-03-26 97.218 90.0707379183
2018-03-27 98.561 91.5273075444
2018-03-28 98.609 92.1104601761
2018-03-29 98.753 92.2660531057
2018-04-03 97.602 91.9247906005
2018-04-04 96.307 91.9705535998
2018-04-05 97.314 94.1344897131
2018-04-06 98.177 93.9265962259
2018-04-09 98.609 94.0730339929
2018-04-10 100.863 95.0144442657
2018-04-11 108.106 94.8876192127
2018-04-12 111.847 94.9033055529
2018-04-13 112.038 94.9856827828
6
2018-04-16 112.086 94.1174945773
2018-04-17 113.141 94.4822897897
2018-04-18 114.772 95.674738971
2018-04-19 114.964 95.8264118943
0 10 20 30 40 50 60 70 80
0
20
40
60
80
100
120
140
Share index
FTSE 100
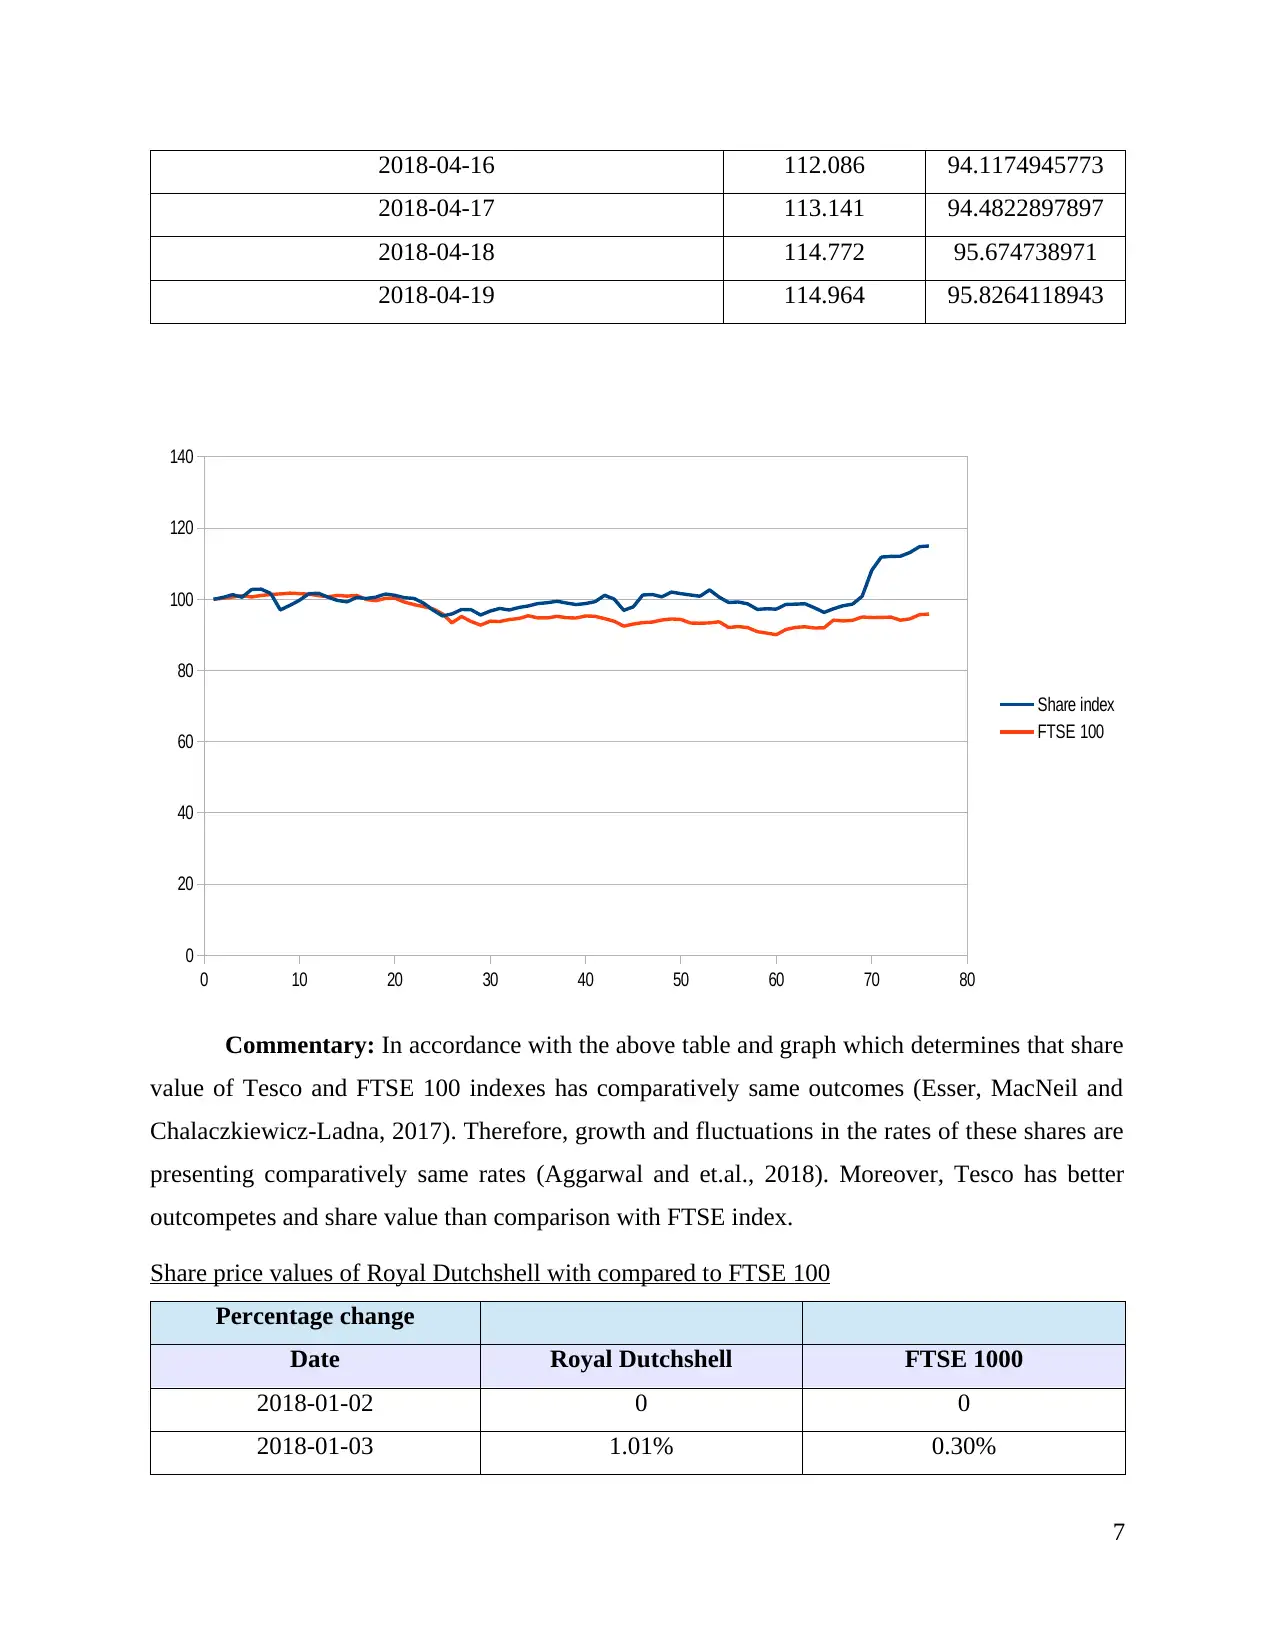
Commentary: In accordance with the above table and graph which determines that share
value of Tesco and FTSE 100 indexes has comparatively same outcomes (Esser, MacNeil and
Chalaczkiewicz-Ladna, 2017). Therefore, growth and fluctuations in the rates of these shares are
presenting comparatively same rates (Aggarwal and et.al., 2018). Moreover, Tesco has better
outcompetes and share value than comparison with FTSE index.
Share price values of Royal Dutchshell with compared to FTSE 100
Percentage change
Date Royal Dutchshell FTSE 1000
2018-01-02 0 0
2018-01-03 1.01% 0.30%
7
2018-04-17 113.141 94.4822897897
2018-04-18 114.772 95.674738971
2018-04-19 114.964 95.8264118943
0 10 20 30 40 50 60 70 80
0
20
40
60
80
100
120
140
Share index
FTSE 100
Commentary: In accordance with the above table and graph which determines that share
value of Tesco and FTSE 100 indexes has comparatively same outcomes (Esser, MacNeil and
Chalaczkiewicz-Ladna, 2017). Therefore, growth and fluctuations in the rates of these shares are
presenting comparatively same rates (Aggarwal and et.al., 2018). Moreover, Tesco has better
outcompetes and share value than comparison with FTSE index.
Share price values of Royal Dutchshell with compared to FTSE 100
Percentage change
Date Royal Dutchshell FTSE 1000
2018-01-02 0 0
2018-01-03 1.01% 0.30%
7
2018-01-04 0.33% 0.32%
2018-01-05 0.57% 0.37%
2018-01-08 -0.01% -0.36%
2018-01-09 -0.25% 0.45%
2018-01-10 0.48% 0.23%
2018-01-11 1.14% 0.19%
2018-01-12 1.35% 0.20%
2018-01-16 -0.98% -0.12%
2018-01-17 0.49% -0.17%
2018-01-18 -0.19% -0.39%
2018-01-19 -0.26% -0.32%
2018-01-22 1.61% 0.39%
2018-01-23 0.08% -0.20%
2018-01-24 0.38% 0.21%
2018-01-25 -0.04% -1.14%
2018-01-26 -0.23% -0.36%
2018-01-29 -0.61% 0.65%
2018-01-30 -1.10% 0.08%
2018-01-31 -0.18% -1.09%
2018-02-01 -1.39% -0.72%
2018-02-02 -2.99% -0.57%
2018-02-05 -4.20% -0.63%
2018-02-06 1.59% -1.46%
2018-02-07 -1.96% -2.64%
2018-02-08 -2.15% 1.93%
2018-02-09 -0.65% -1.49%
2018-02-12 2.04% -1.09%
2018-02-13 0.48% 1.19%
2018-02-14 1.94% -0.13%
2018-02-15 -1.65% 0.64%
2018-02-16 -1.08% 0.29%
8
Secure Best Marks with AI Grader
Need help grading? Try our AI Grader for instant feedback on your assignments.
2018-02-20 -0.86% 0.83%
2018-02-21 -1.06% -0.64%
2018-02-22 1.27% -0.01%
2018-02-23 1.15% 0.48%
2018-02-26 0.72% -0.40%
2018-02-27 -1.19% -0.11%
2018-02-28 -1.11% 0.62%
2018-03-01 -0.03% -0.10%
2018-03-02 0.33% -0.69%
2018-03-05 0.48% -0.78%
2018-03-06 0.73% -1.47%
2018-03-07 -1.34% 0.65%
2018-03-08 -0.26% 0.43%
2018-03-09 0.19% 0.15%
2018-03-12 -0.19% 0.63%
2018-03-13 -0.81% 0.30%
2018-03-14 -0.82% -0.13%
2018-03-15 -0.11% -1.05%
2018-03-16 0.70% -0.09%
2018-03-19 -0.79% 0.10%
2018-03-20 0.84% 0.34%
2018-03-21 2.28% -1.69%
2018-03-22 -1.65% 0.26%
2018-03-23 0.25% -0.32%
2018-03-26 2.80% -1.23%
2018-03-27 -0.24% -0.44%
2018-03-28 -1.28% -0.48%
2018-03-29 1.13% 1.62%
2018-04-02 -2.00% 0.64%
2018-04-03 1.85% 0.17%
2018-04-04 0.54% -0.37%
9
2018-04-05 3.07% 0.05%
2018-04-06 -0.77% 2.35%
2018-04-09 1.31% -0.22%
2018-04-10 2.32% 0.16%
2018-04-11 0.72% 1.00%
2018-04-12 -0.53% -0.13%
2018-04-13 0.14% 0.02%
2018-04-16 -0.19% 0.09%
2018-04-17 1.20% -0.91%
2018-04-18 2.18% 0.39%
2018-04-19 0.90% 1.26%
0 10 20 30 40 50 60 70 80
-0.05
-0.04
-0.03
-0.02
-0.01
0
0.01
0.02
0.03
0.04
Royal Dutchshell
FTSE 1000
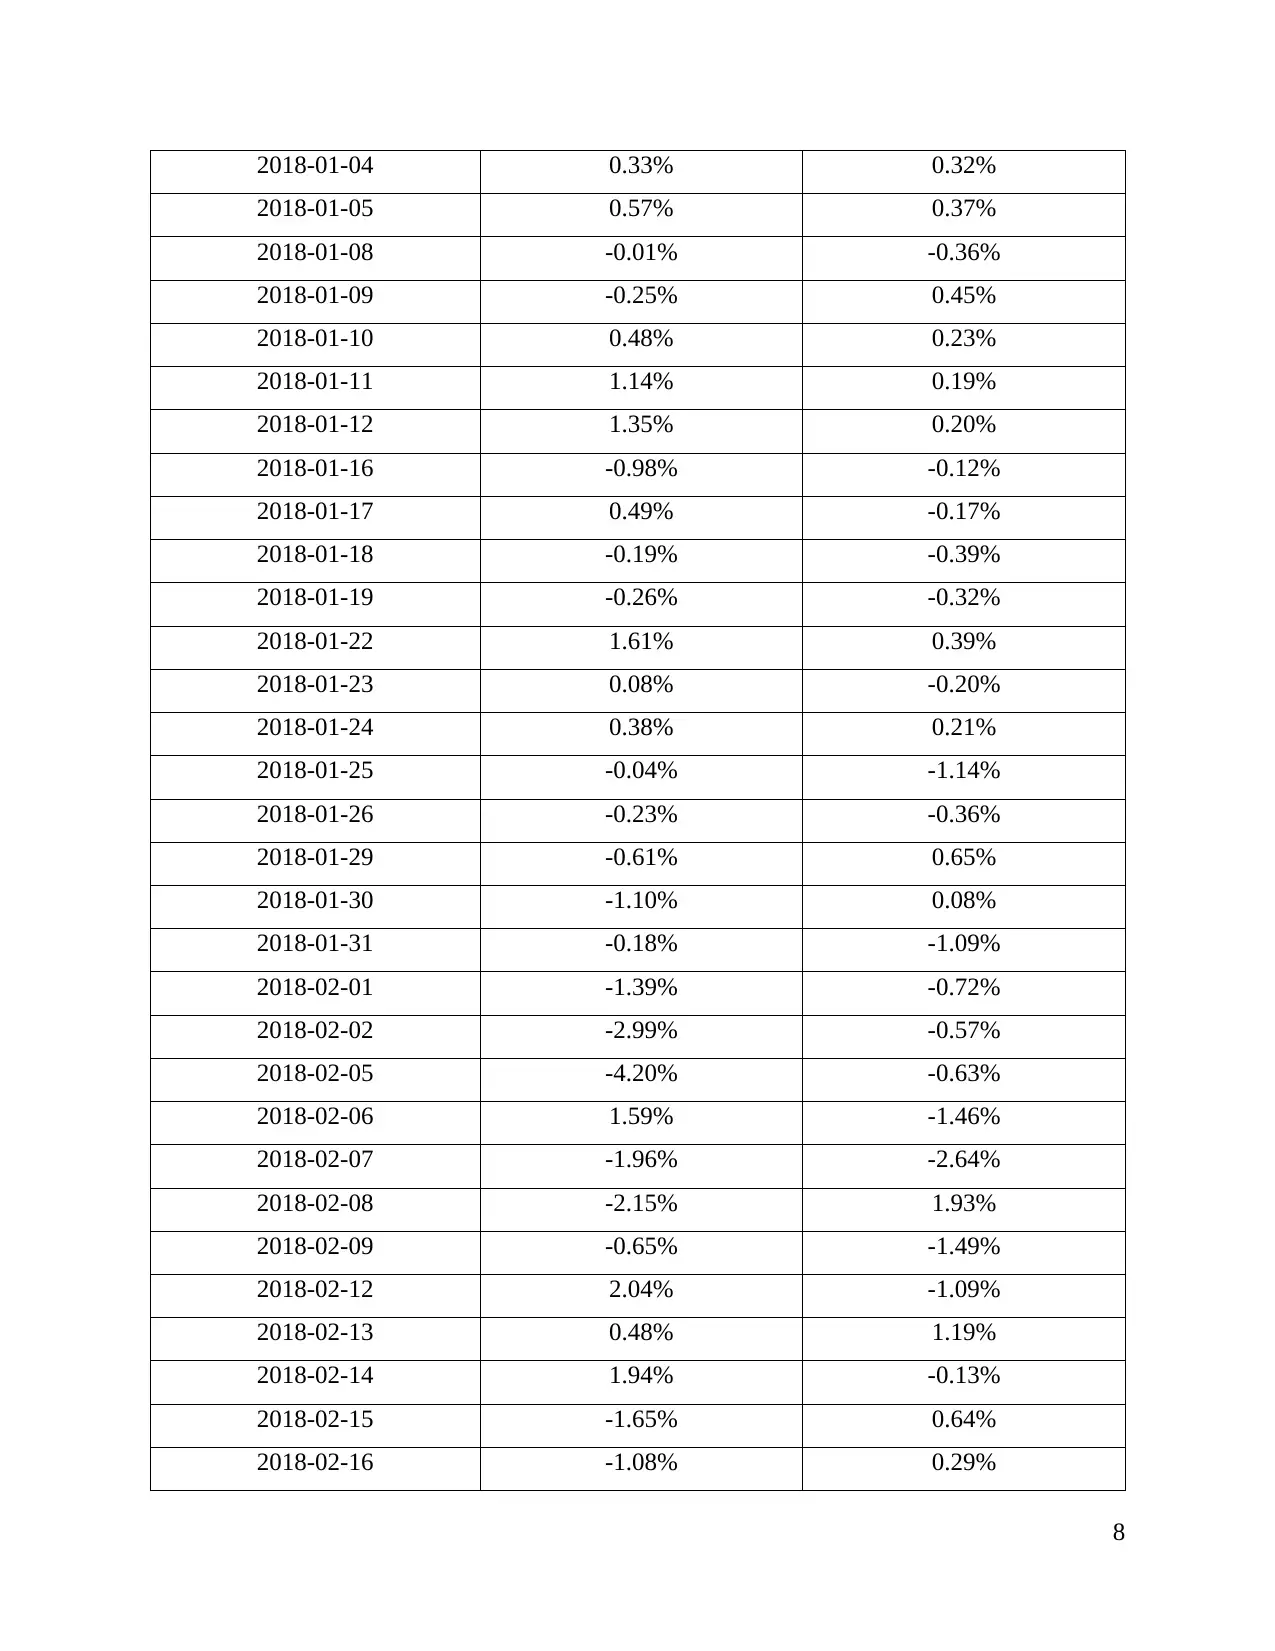
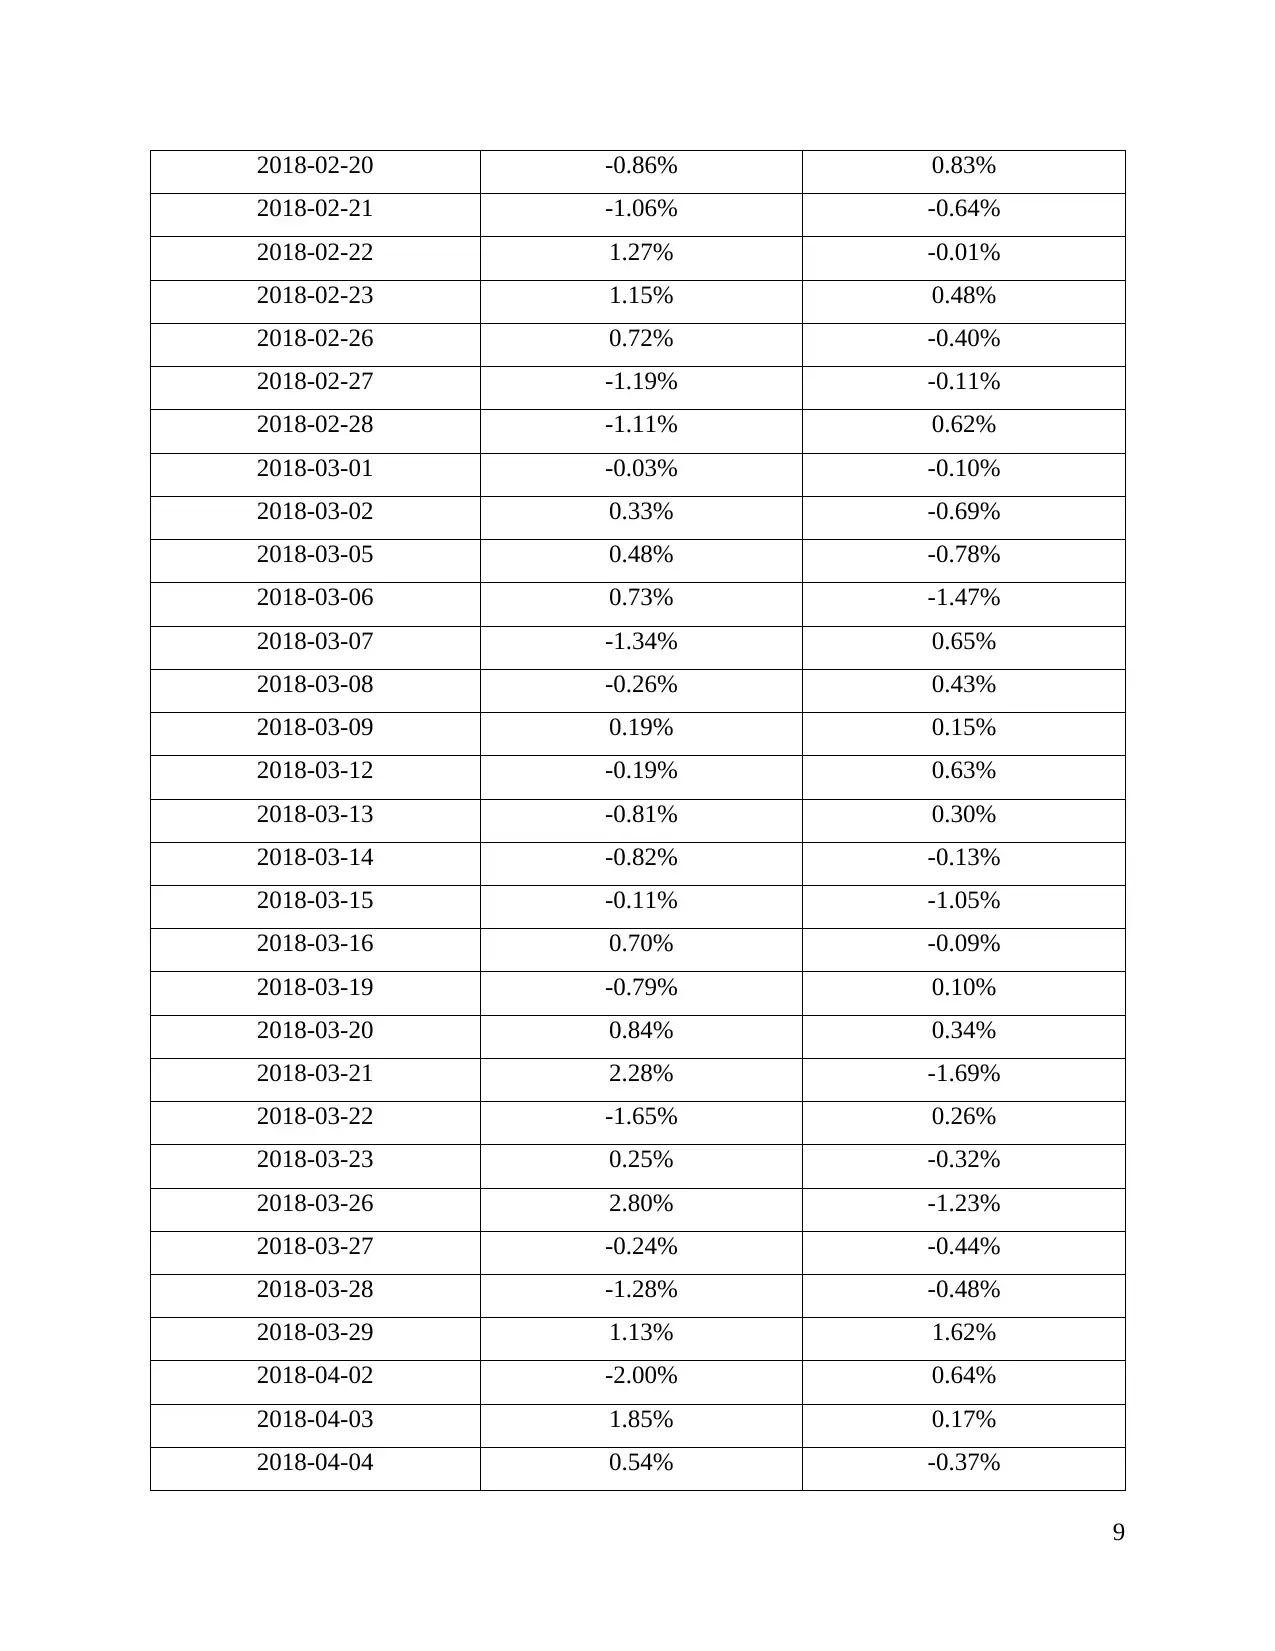
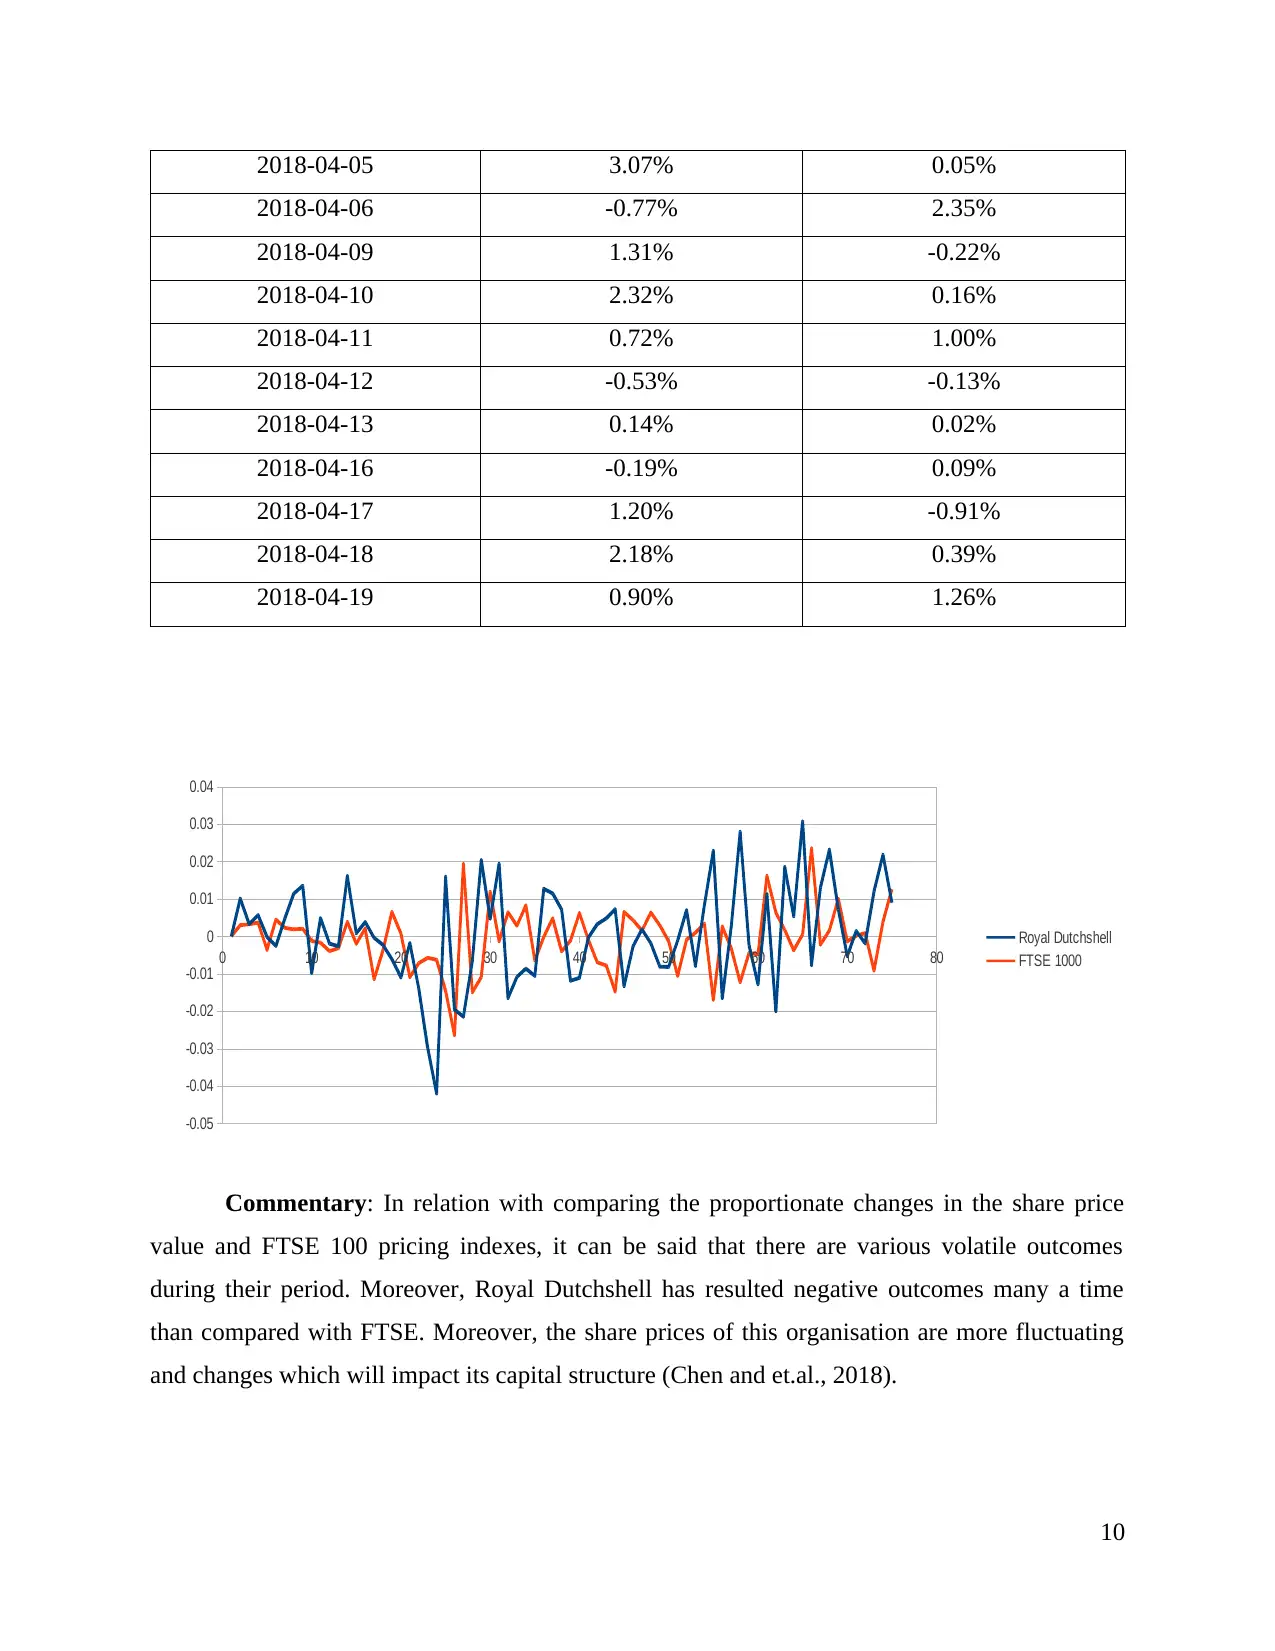
Commentary: In relation with comparing the proportionate changes in the share price
value and FTSE 100 pricing indexes, it can be said that there are various volatile outcomes
during their period. Moreover, Royal Dutchshell has resulted negative outcomes many a time
than compared with FTSE. Moreover, the share prices of this organisation are more fluctuating
and changes which will impact its capital structure (Chen and et.al., 2018).
10
2018-04-06 -0.77% 2.35%
2018-04-09 1.31% -0.22%
2018-04-10 2.32% 0.16%
2018-04-11 0.72% 1.00%
2018-04-12 -0.53% -0.13%
2018-04-13 0.14% 0.02%
2018-04-16 -0.19% 0.09%
2018-04-17 1.20% -0.91%
2018-04-18 2.18% 0.39%
2018-04-19 0.90% 1.26%
0 10 20 30 40 50 60 70 80
-0.05
-0.04
-0.03
-0.02
-0.01
0
0.01
0.02
0.03
0.04
Royal Dutchshell
FTSE 1000
Commentary: In relation with comparing the proportionate changes in the share price
value and FTSE 100 pricing indexes, it can be said that there are various volatile outcomes
during their period. Moreover, Royal Dutchshell has resulted negative outcomes many a time
than compared with FTSE. Moreover, the share prices of this organisation are more fluctuating
and changes which will impact its capital structure (Chen and et.al., 2018).
10
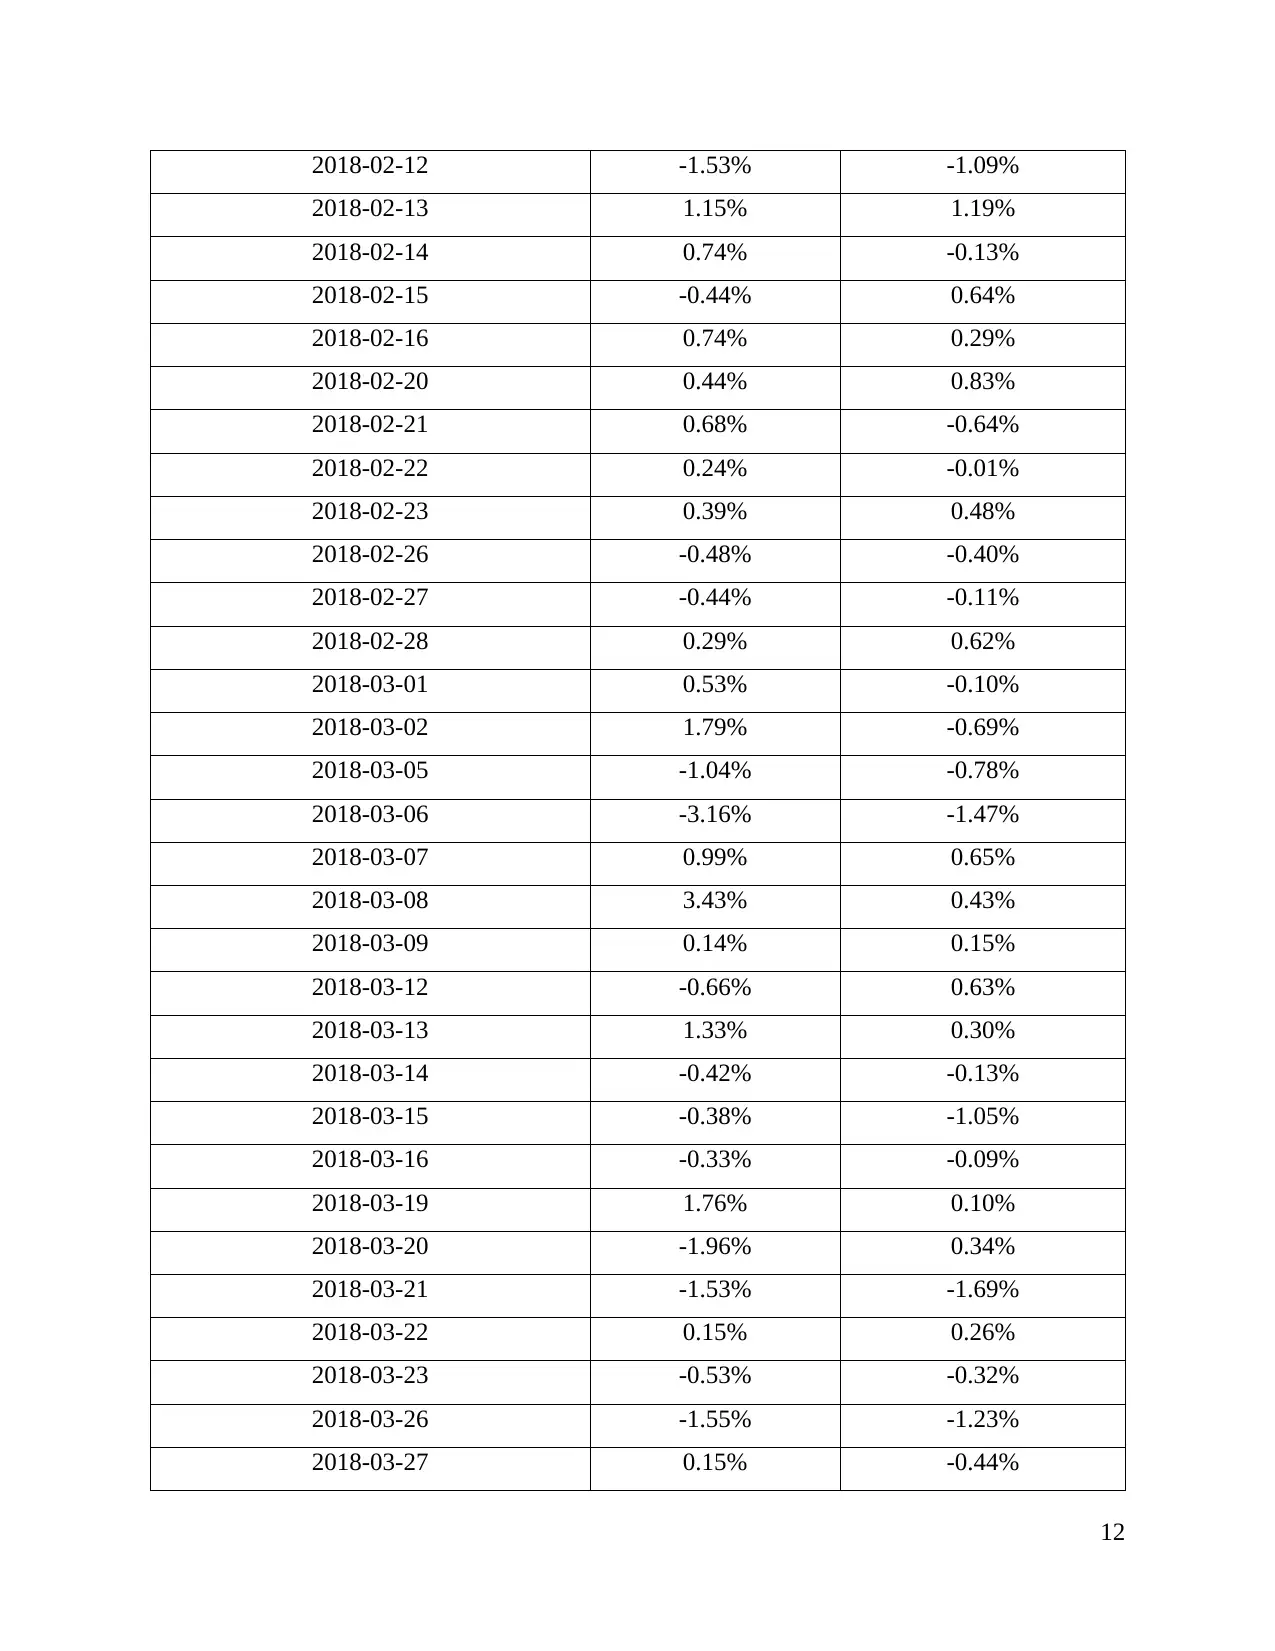
Share price value of Tesco in comparison with FTSE 100
Percentage change
Date Tesco FTASE 100
2018-01-02 0 0
2018-01-03 0.53% 0.30%
2018-01-04 0.76% 0.32%
2018-01-05 -0.71% 0.37%
2018-01-08 2.19% -0.36%
2018-01-09 0.05% 0.45%
2018-01-10 -1.17% 0.23%
2018-01-11 -4.53% 0.19%
2018-01-12 1.29% 0.20%
2018-01-16 1.46% -0.12%
2018-01-17 1.88% -0.17%
2018-01-18 0.09% -0.39%
2018-01-19 -1.08% -0.32%
2018-01-22 -0.91% 0.39%
2018-01-23 -0.38% -0.20%
2018-01-24 1.26% 0.21%
2018-01-25 -0.33% -1.14%
2018-01-26 0.38% -0.36%
2018-01-29 0.86% 0.65%
2018-01-30 -0.33% 0.08%
2018-01-31 -0.66% -1.09%
2018-02-01 -0.19% -0.72%
2018-02-02 -1.29% -0.57%
2018-02-05 -1.99% -0.63%
2018-02-06 -1.71% -1.46%
2018-02-07 0.58% -2.64%
2018-02-08 1.30% 1.93%
2018-02-09 -0.05% -1.49%
11
Paraphrase This Document
Need a fresh take? Get an instant paraphrase of this document with our AI Paraphraser
2018-02-12 -1.53% -1.09%
2018-02-13 1.15% 1.19%
2018-02-14 0.74% -0.13%
2018-02-15 -0.44% 0.64%
2018-02-16 0.74% 0.29%
2018-02-20 0.44% 0.83%
2018-02-21 0.68% -0.64%
2018-02-22 0.24% -0.01%
2018-02-23 0.39% 0.48%
2018-02-26 -0.48% -0.40%
2018-02-27 -0.44% -0.11%
2018-02-28 0.29% 0.62%
2018-03-01 0.53% -0.10%
2018-03-02 1.79% -0.69%
2018-03-05 -1.04% -0.78%
2018-03-06 -3.16% -1.47%
2018-03-07 0.99% 0.65%
2018-03-08 3.43% 0.43%
2018-03-09 0.14% 0.15%
2018-03-12 -0.66% 0.63%
2018-03-13 1.33% 0.30%
2018-03-14 -0.42% -0.13%
2018-03-15 -0.38% -1.05%
2018-03-16 -0.33% -0.09%
2018-03-19 1.76% 0.10%
2018-03-20 -1.96% 0.34%
2018-03-21 -1.53% -1.69%
2018-03-22 0.15% 0.26%
2018-03-23 -0.53% -0.32%
2018-03-26 -1.55% -1.23%
2018-03-27 0.15% -0.44%
12
1 out of 14
Related Documents


Your All-in-One AI-Powered Toolkit for Academic Success.
+13062052269
info@desklib.com
Available 24*7 on WhatsApp / Email
![[object Object]](/_next/static/media/star-bottom.7253800d.svg)
Unlock your academic potential
© 2024 | Zucol Services PVT LTD | All rights reserved.