Data Analysis and Statistical Calculation for Humidity Level of Bristol City
VerifiedAdded on 2023/01/16
|10
|1438
|58
AI Summary
This report provides a data analysis and statistical calculation for the humidity level of Bristol city, including mean, median, mode, range, and standard deviation. It also includes a linear forecasting model to predict future humidity levels.
Contribute Materials
Your contribution can guide someone’s learning journey. Share your
documents today.

Report
Secure Best Marks with AI Grader
Need help grading? Try our AI Grader for instant feedback on your assignments.
Table of Contents
INTRODUCTION...........................................................................................................................3
MAIN BODY...................................................................................................................................3
1. Arrange the collected data in table format...............................................................................3
2. Represent the data in different charts format...........................................................................3
3. Calculate the following statistical data....................................................................................5
4. Use linear forecasting model to calculate y = mx+c................................................................7
CONCLUSION................................................................................................................................8
REFERENCES ...............................................................................................................................9
INTRODUCTION
Data analysis process of cleaning, modelling and transforming data and represent in the
understating form that is useful for the business related decision making process. Main purpose
of data analysis is to measure data and further utilize these information for the benefits of the
company through improving operational activities (Dong, Sun and Li, 2017). This report based
on the Humidity level of Bristol city. This assessment include the various statistical calculation
such as mean, median, mode, range and standard deviation. In addition, it include the linear
forecasting model to calculate the humidity level for the 15th or 20th day.
MAIN BODY
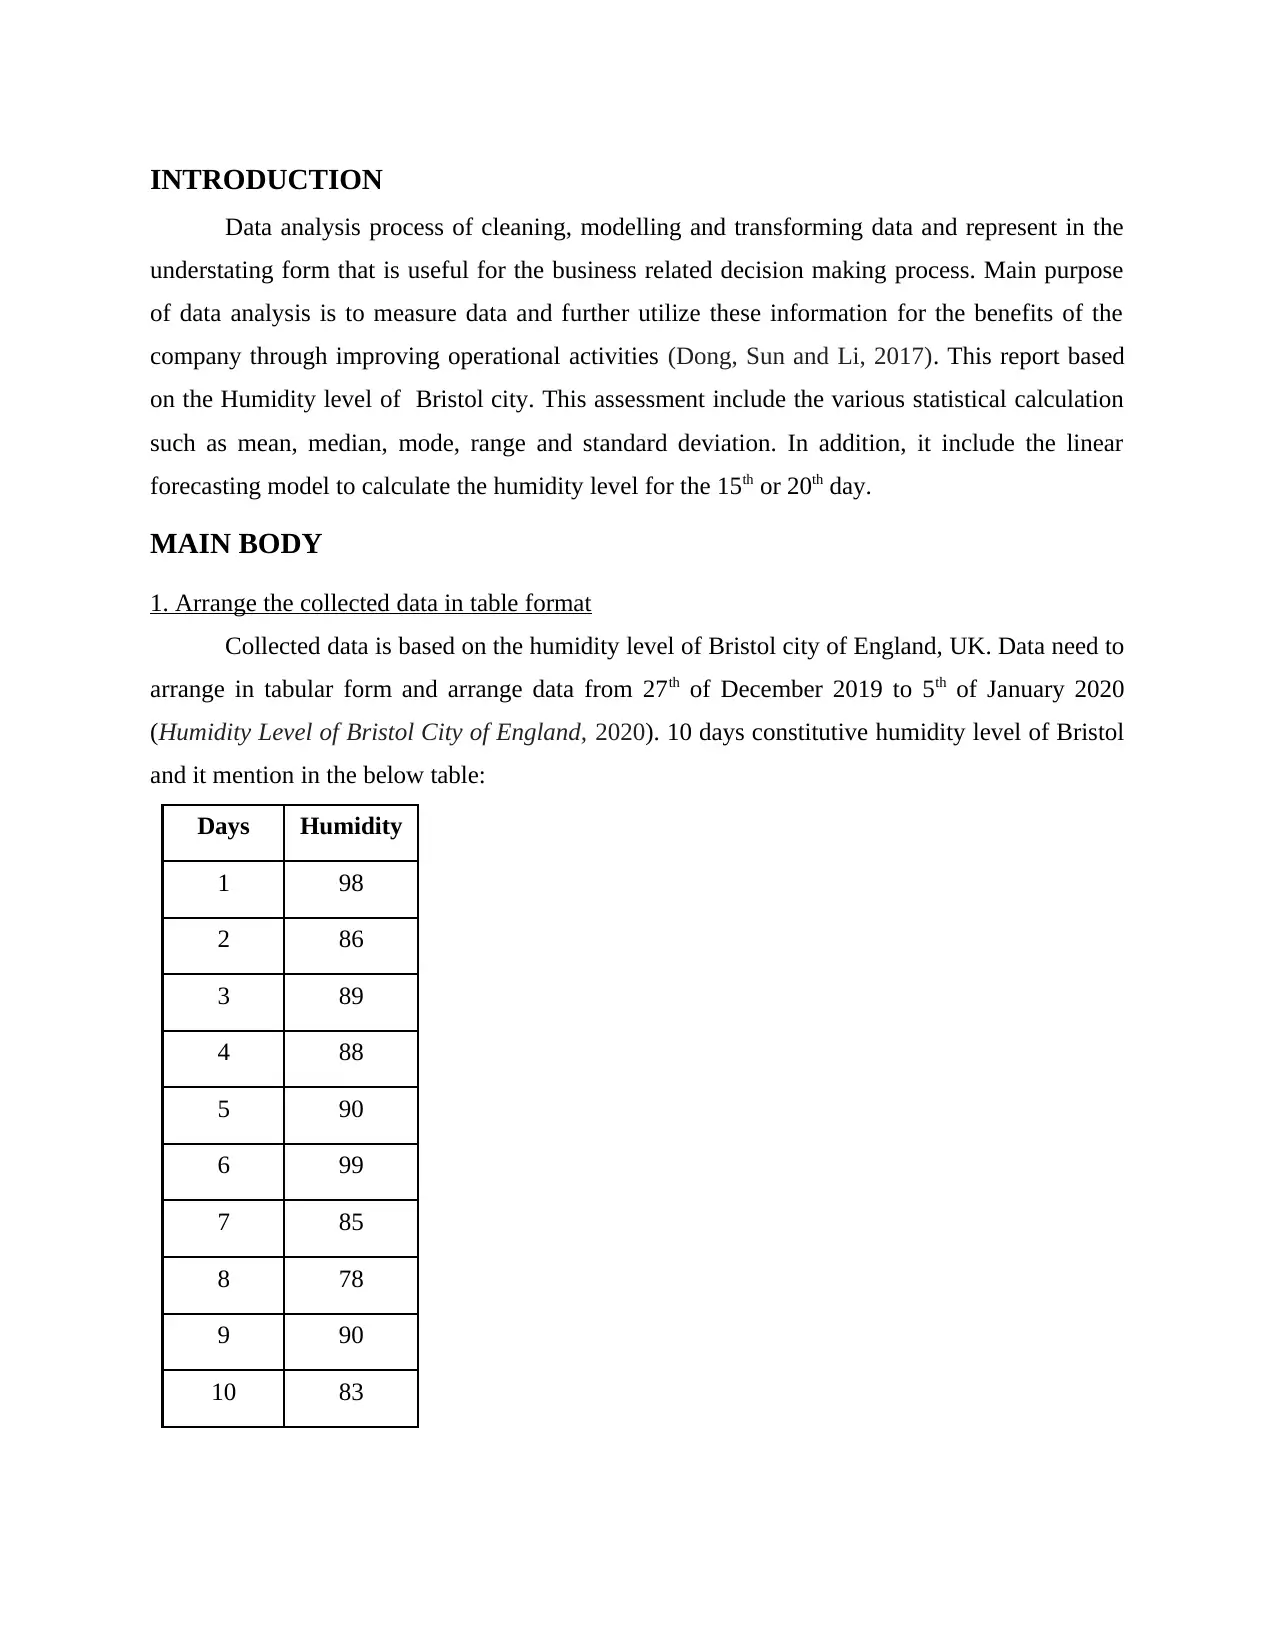
1. Arrange the collected data in table format
Collected data is based on the humidity level of Bristol city of England, UK. Data need to
arrange in tabular form and arrange data from 27th of December 2019 to 5th of January 2020
(Humidity Level of Bristol City of England, 2020). 10 days constitutive humidity level of Bristol
and it mention in the below table:
Days Humidity
1 98
2 86
3 89
4 88
5 90
6 99
7 85
8 78
9 90
10 83
Data analysis process of cleaning, modelling and transforming data and represent in the
understating form that is useful for the business related decision making process. Main purpose
of data analysis is to measure data and further utilize these information for the benefits of the
company through improving operational activities (Dong, Sun and Li, 2017). This report based
on the Humidity level of Bristol city. This assessment include the various statistical calculation
such as mean, median, mode, range and standard deviation. In addition, it include the linear
forecasting model to calculate the humidity level for the 15th or 20th day.
MAIN BODY
1. Arrange the collected data in table format
Collected data is based on the humidity level of Bristol city of England, UK. Data need to
arrange in tabular form and arrange data from 27th of December 2019 to 5th of January 2020
(Humidity Level of Bristol City of England, 2020). 10 days constitutive humidity level of Bristol
and it mention in the below table:
Days Humidity
1 98
2 86
3 89
4 88
5 90
6 99
7 85
8 78
9 90
10 83
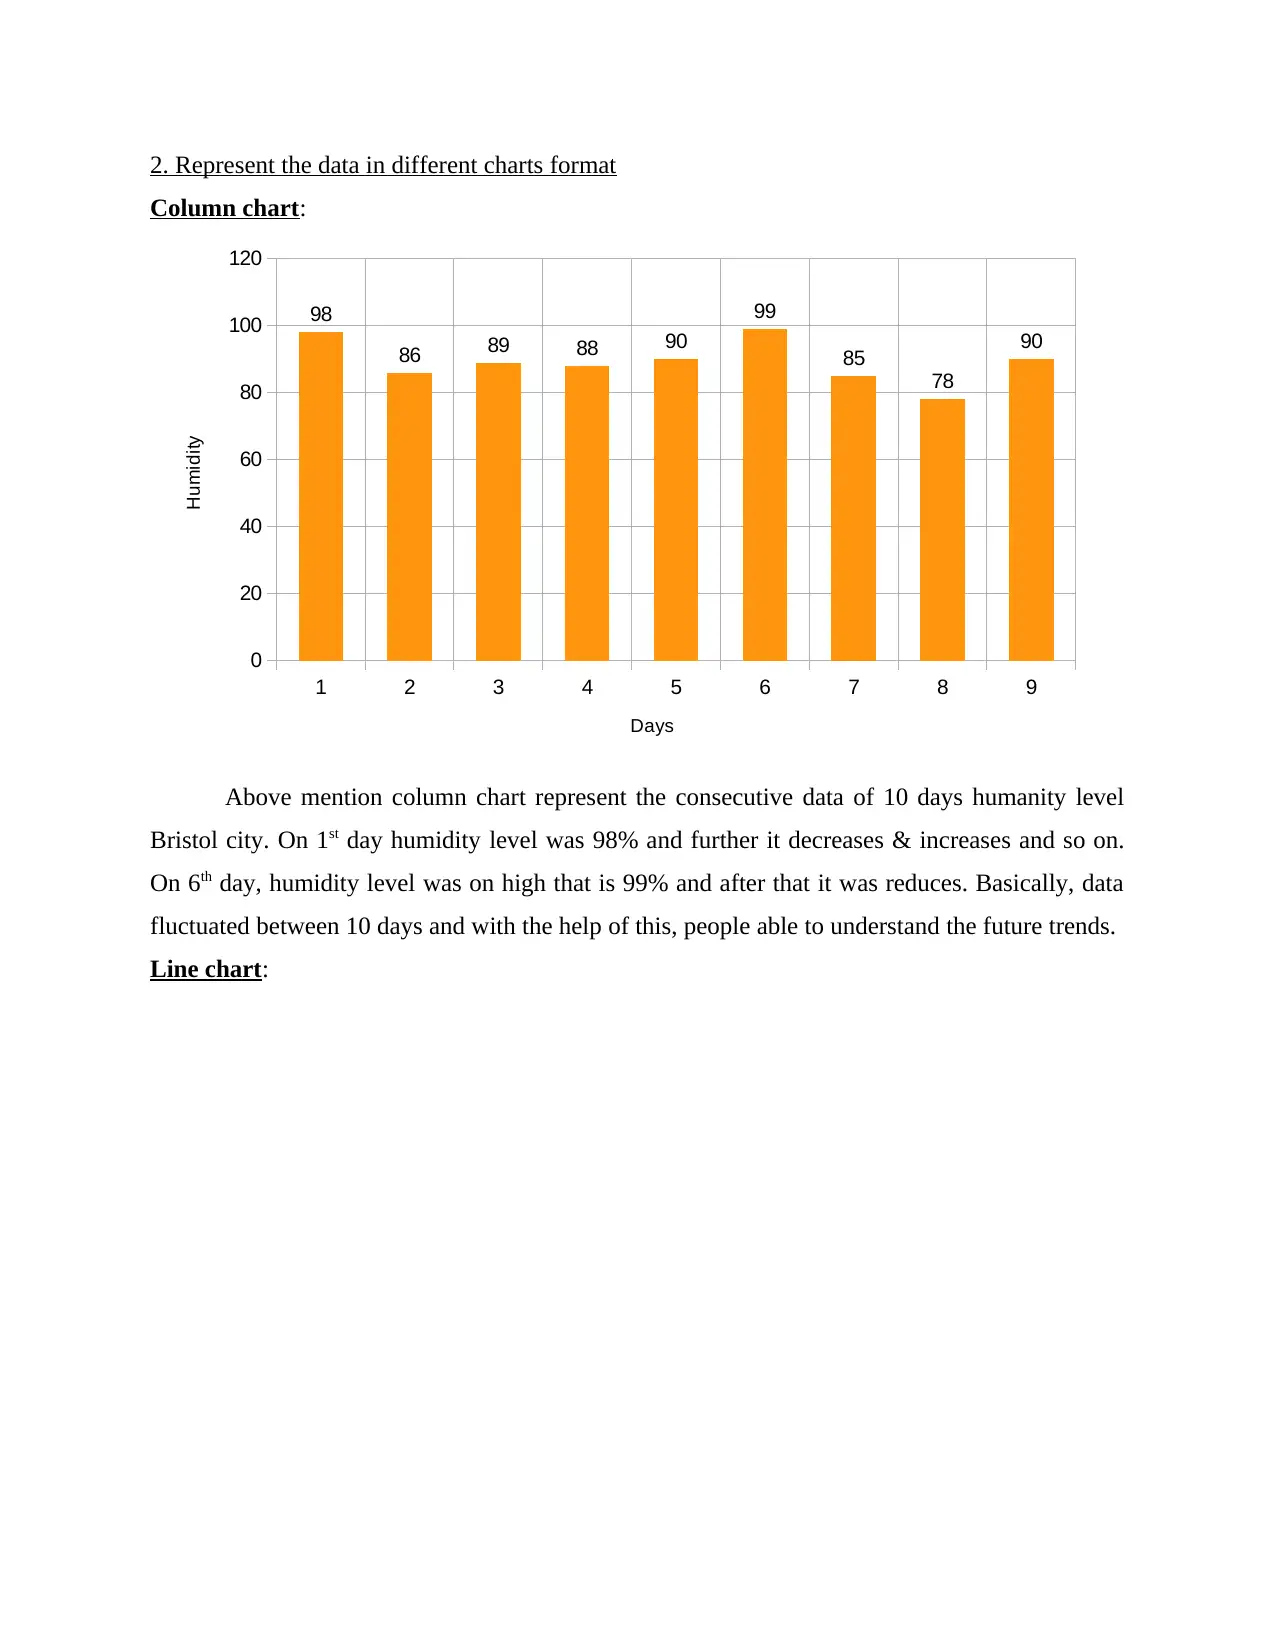
2. Represent the data in different charts format
Column chart:
1 2 3 4 5 6 7 8 9
0
20
40
60
80
100
120
98
86 89 88 90
99
85
78
90
Days
Humidity
Above mention column chart represent the consecutive data of 10 days humanity level
Bristol city. On 1st day humidity level was 98% and further it decreases & increases and so on.
On 6th day, humidity level was on high that is 99% and after that it was reduces. Basically, data
fluctuated between 10 days and with the help of this, people able to understand the future trends.
Line chart:
Secure Best Marks with AI Grader
Need help grading? Try our AI Grader for instant feedback on your assignments.
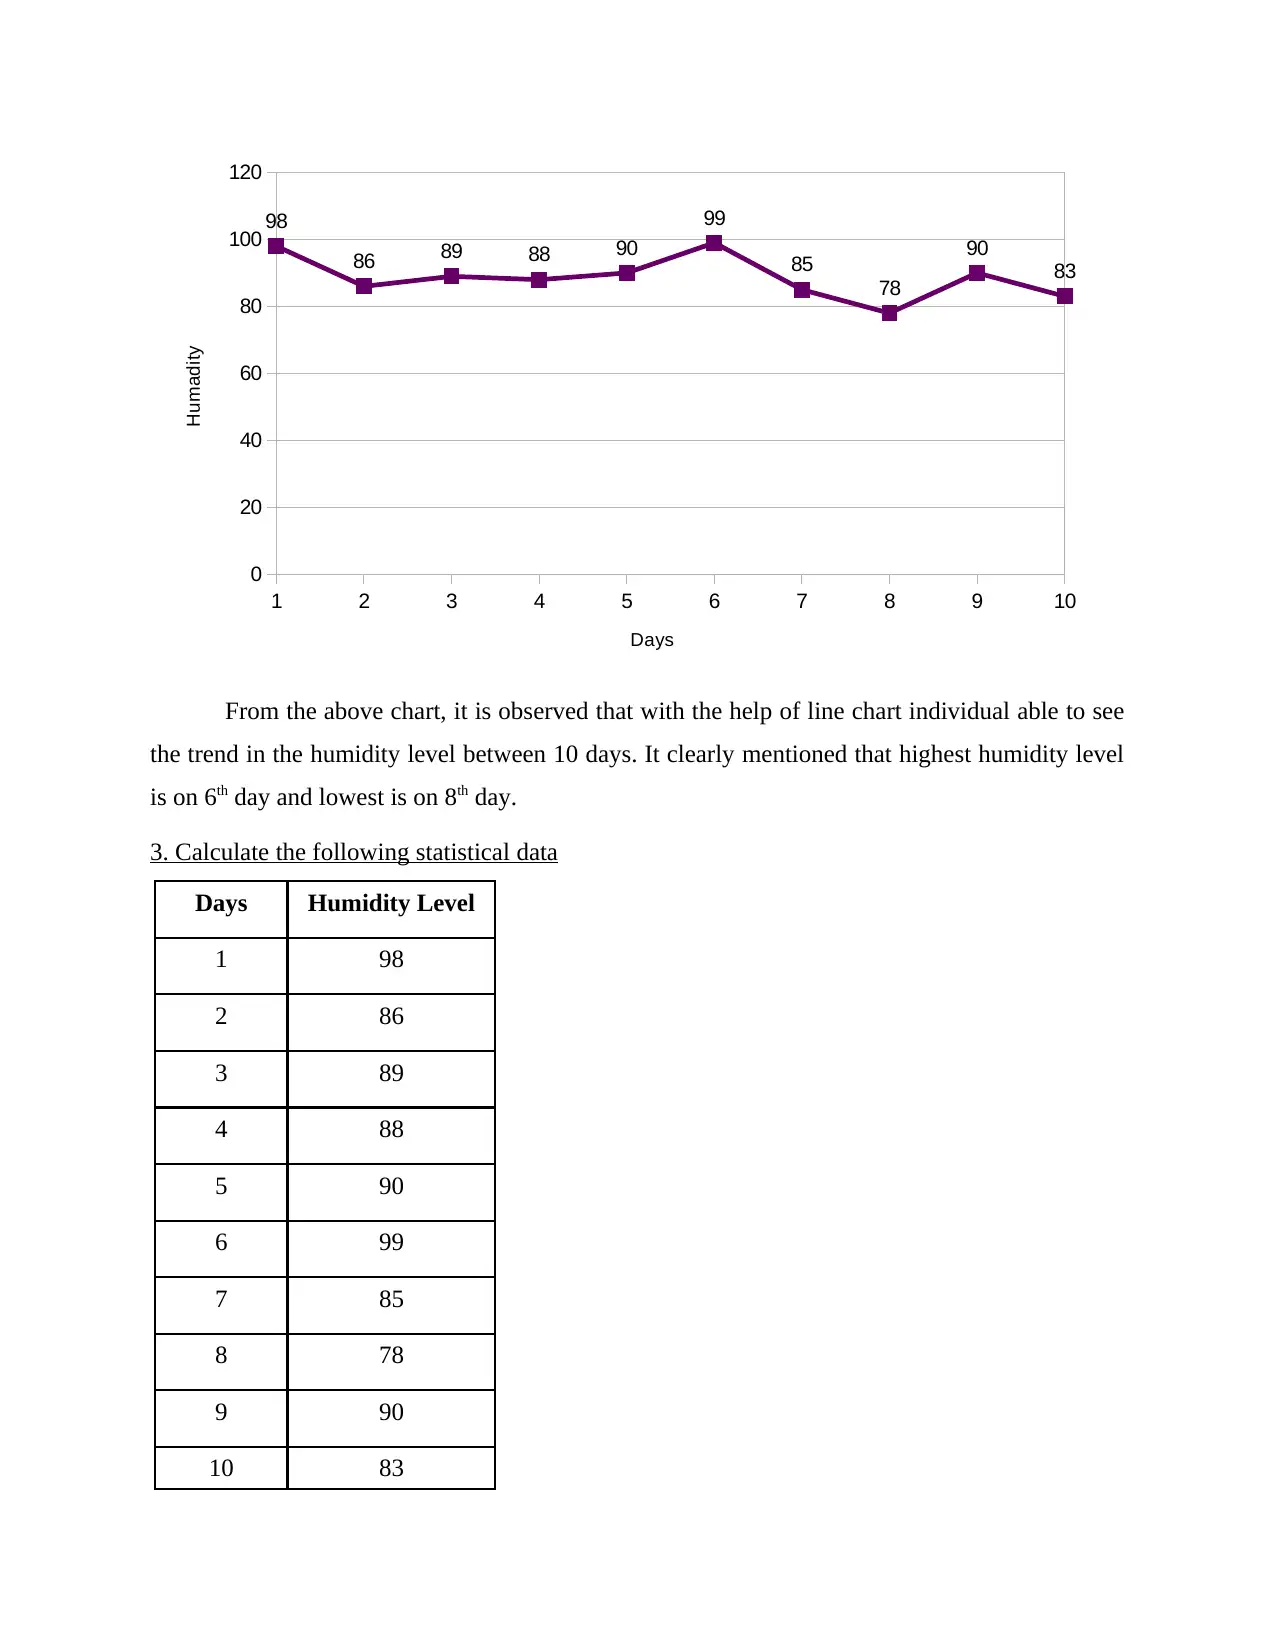
1 2 3 4 5 6 7 8 9 10
0
20
40
60
80
100
120
98
86 89 88 90
99
85
78
90
83
Days
Humadity
From the above chart, it is observed that with the help of line chart individual able to see
the trend in the humidity level between 10 days. It clearly mentioned that highest humidity level
is on 6th day and lowest is on 8th day.
3. Calculate the following statistical data
Days Humidity Level
1 98
2 86
3 89
4 88
5 90
6 99
7 85
8 78
9 90
10 83
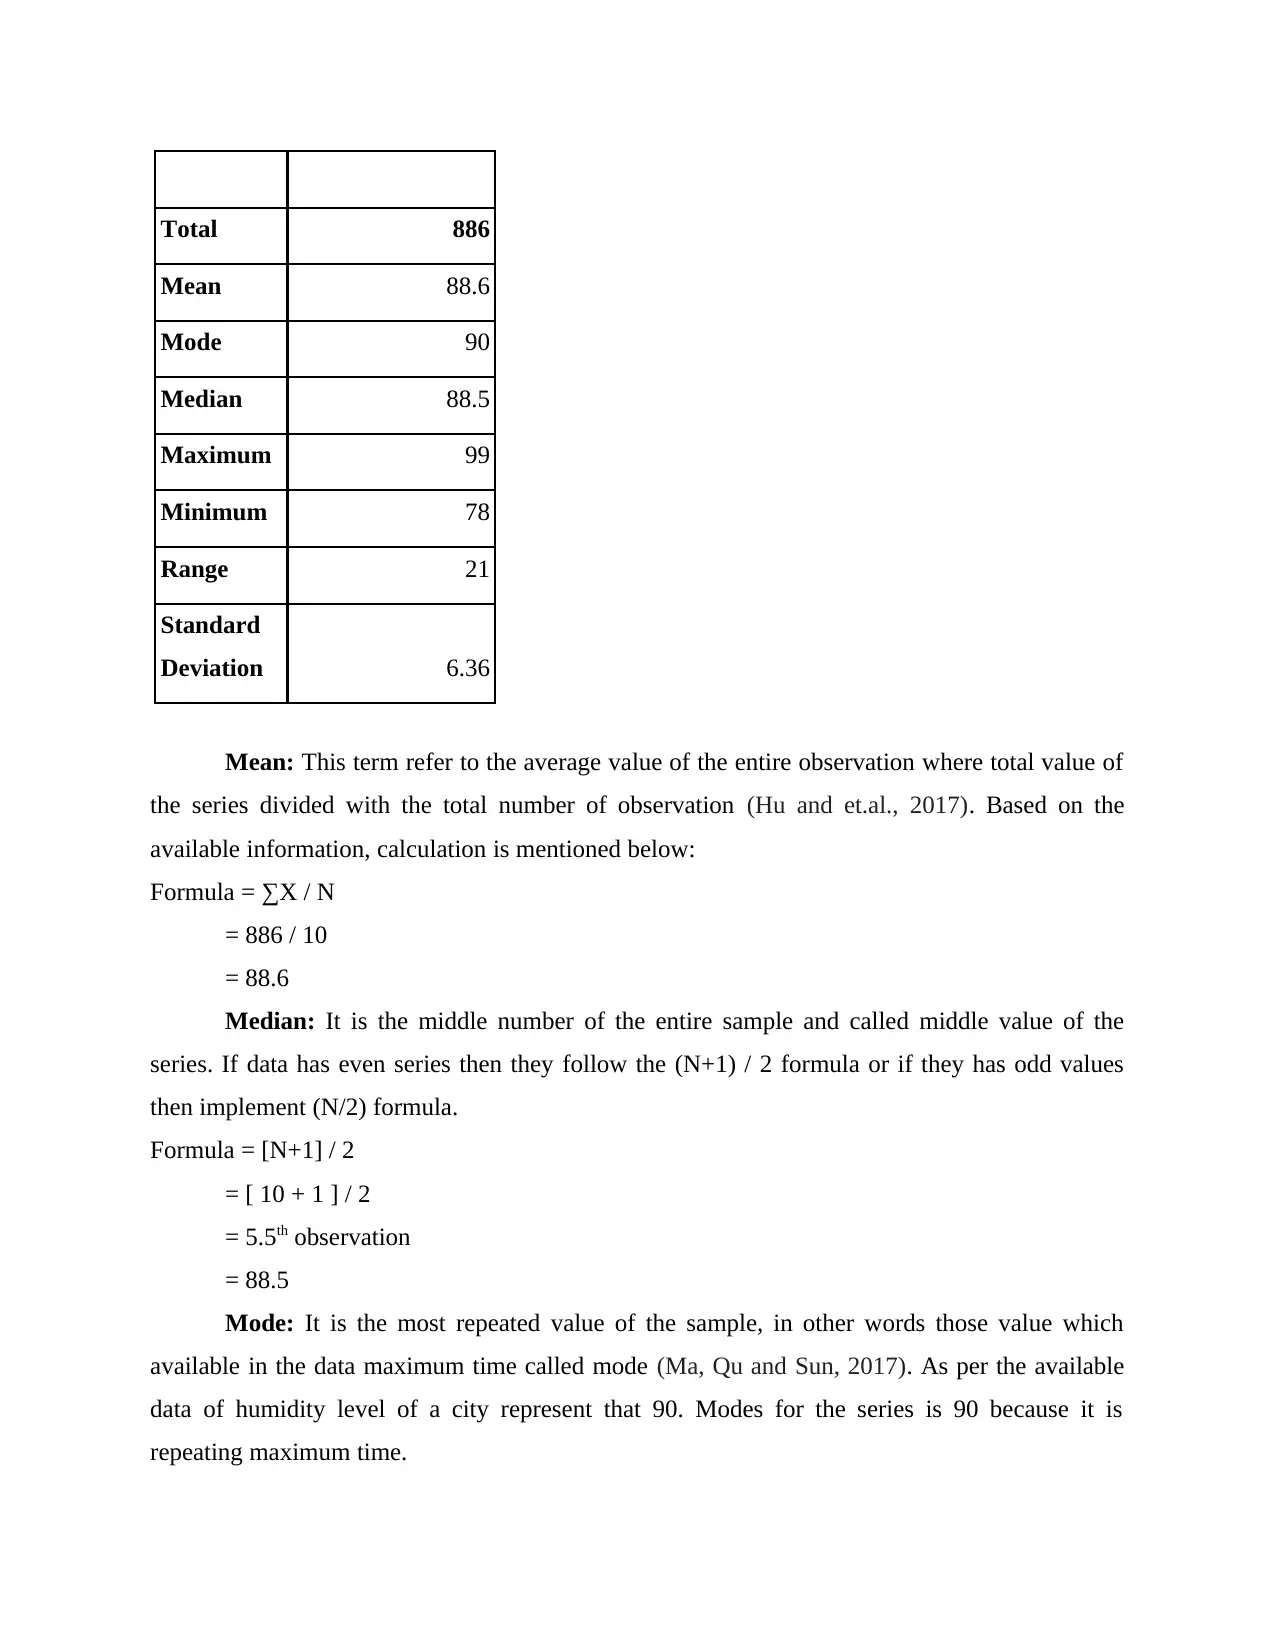
Total 886
Mean 88.6
Mode 90
Median 88.5
Maximum 99
Minimum 78
Range 21
Standard
Deviation 6.36
Mean: This term refer to the average value of the entire observation where total value of
the series divided with the total number of observation (Hu and et.al., 2017). Based on the
available information, calculation is mentioned below:
Formula = ∑X / N
= 886 / 10
= 88.6
Median: It is the middle number of the entire sample and called middle value of the
series. If data has even series then they follow the (N+1) / 2 formula or if they has odd values
then implement (N/2) formula.
Formula = [N+1] / 2
= [ 10 + 1 ] / 2
= 5.5th observation
= 88.5
Mode: It is the most repeated value of the sample, in other words those value which
available in the data maximum time called mode (Ma, Qu and Sun, 2017). As per the available
data of humidity level of a city represent that 90. Modes for the series is 90 because it is
repeating maximum time.
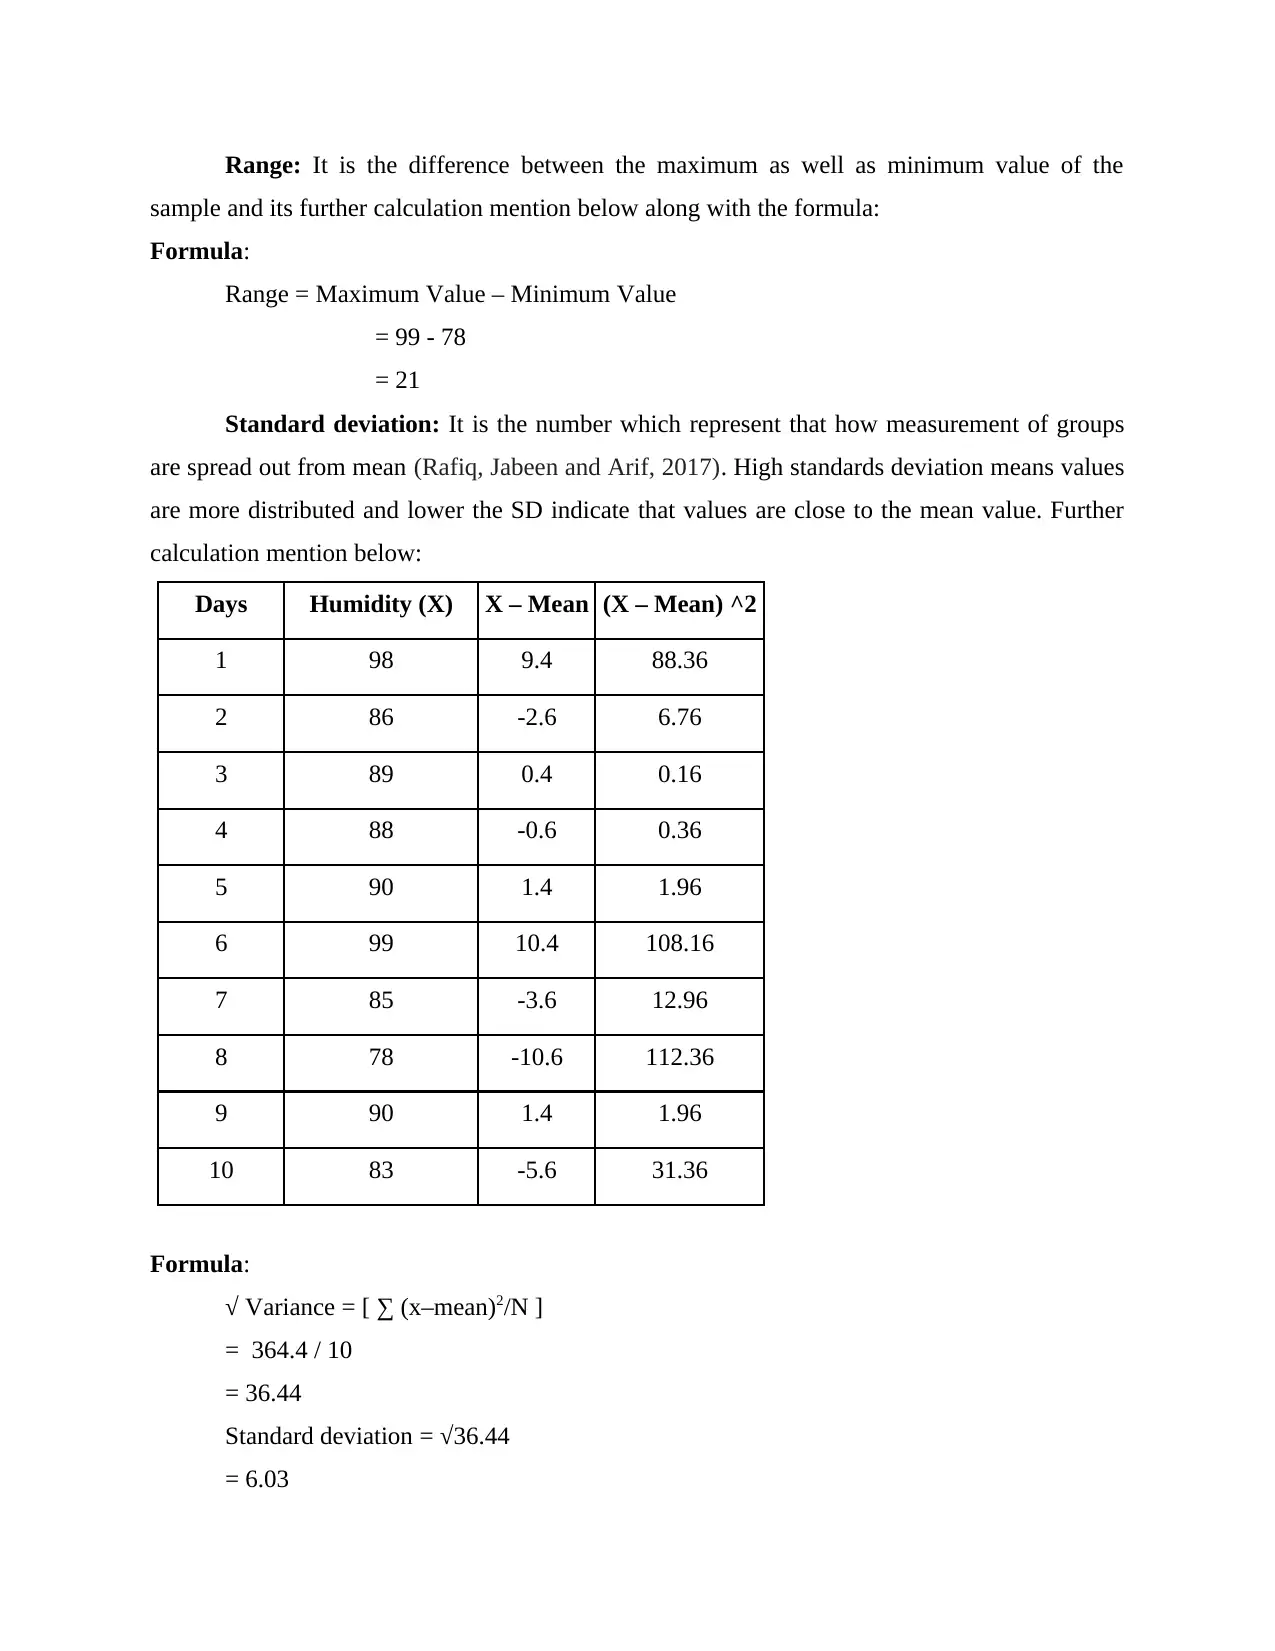
Range: It is the difference between the maximum as well as minimum value of the
sample and its further calculation mention below along with the formula:
Formula:
Range = Maximum Value – Minimum Value
= 99 - 78
= 21
Standard deviation: It is the number which represent that how measurement of groups
are spread out from mean (Rafiq, Jabeen and Arif, 2017). High standards deviation means values
are more distributed and lower the SD indicate that values are close to the mean value. Further
calculation mention below:
Days Humidity (X) X – Mean (X – Mean) ^2
1 98 9.4 88.36
2 86 -2.6 6.76
3 89 0.4 0.16
4 88 -0.6 0.36
5 90 1.4 1.96
6 99 10.4 108.16
7 85 -3.6 12.96
8 78 -10.6 112.36
9 90 1.4 1.96
10 83 -5.6 31.36
Formula:
√ Variance = [ ∑ (x–mean)2/N ]
= 364.4 / 10
= 36.44
Standard deviation = √36.44
= 6.03
Paraphrase This Document
Need a fresh take? Get an instant paraphrase of this document with our AI Paraphraser
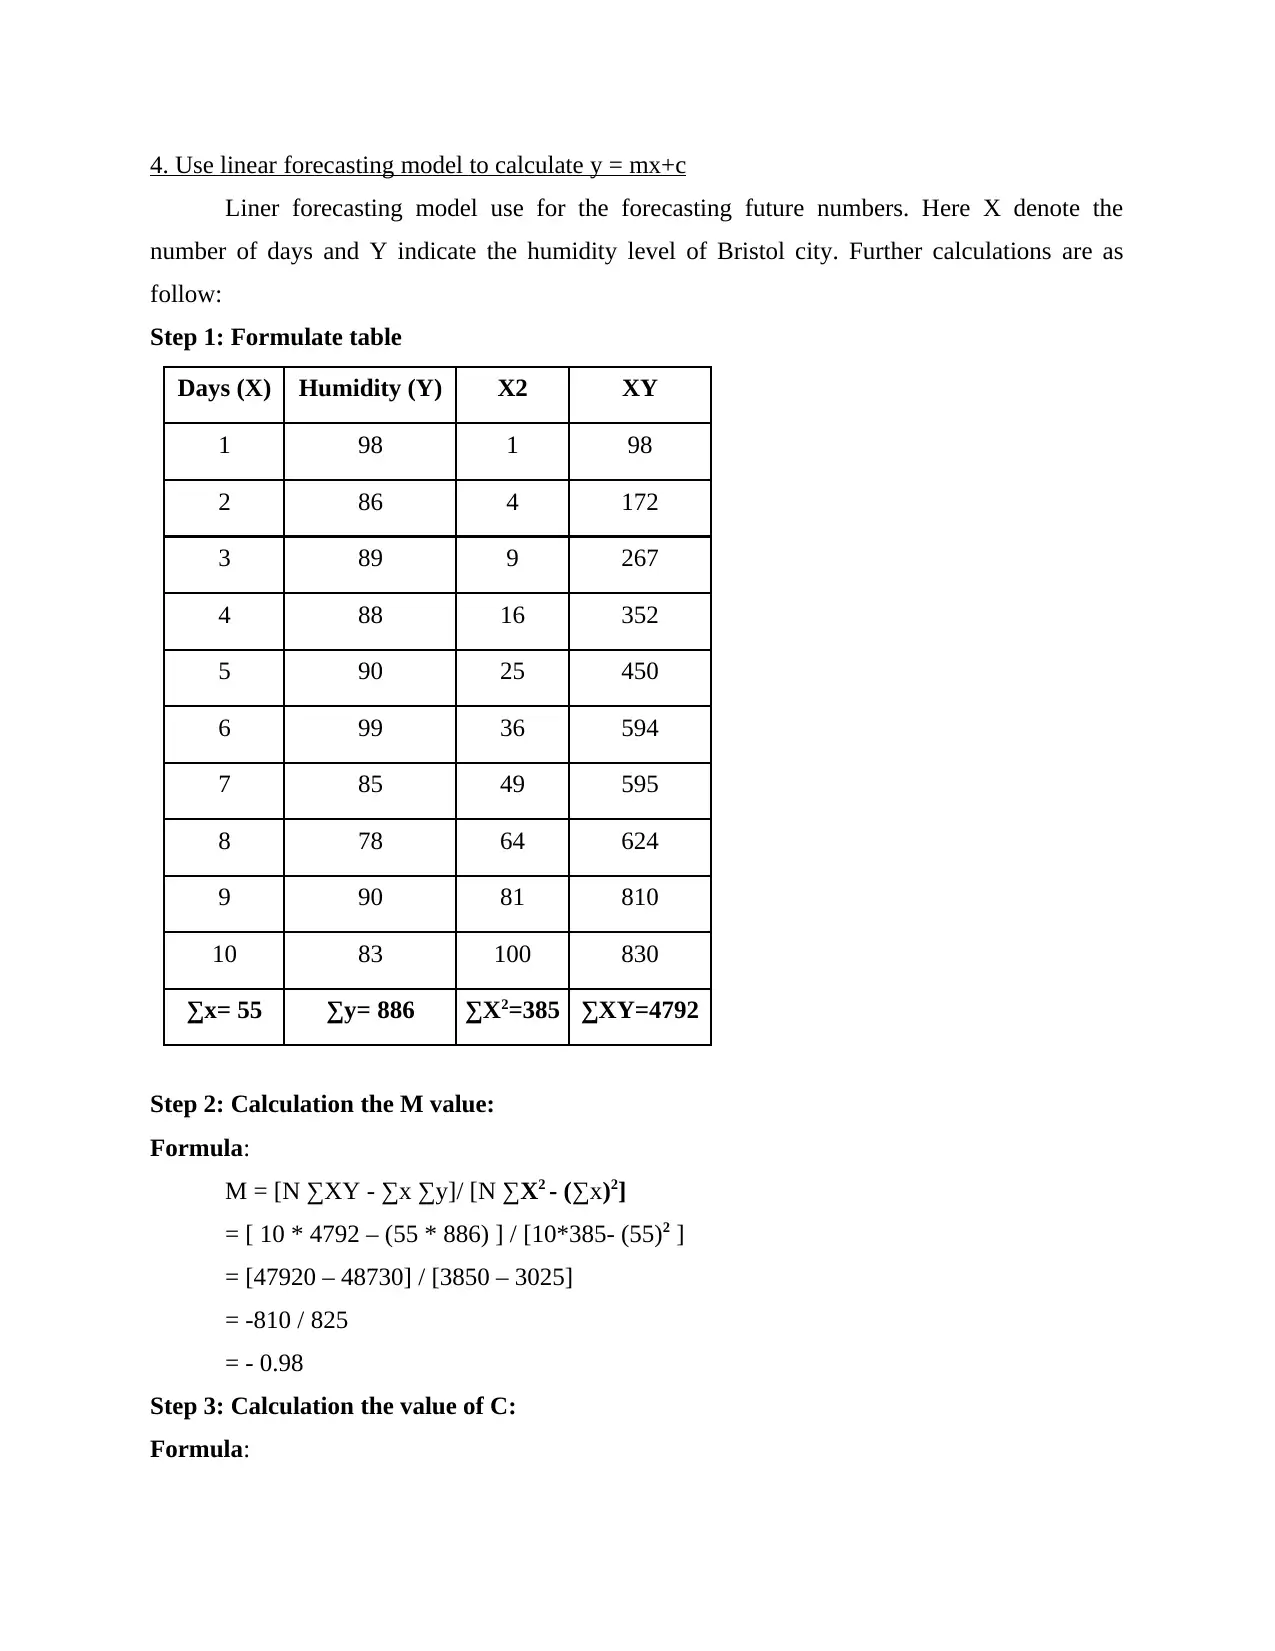
4. Use linear forecasting model to calculate y = mx+c
Liner forecasting model use for the forecasting future numbers. Here X denote the
number of days and Y indicate the humidity level of Bristol city. Further calculations are as
follow:
Step 1: Formulate table
Days (X) Humidity (Y) X2 XY
1 98 1 98
2 86 4 172
3 89 9 267
4 88 16 352
5 90 25 450
6 99 36 594
7 85 49 595
8 78 64 624
9 90 81 810
10 83 100 830
∑x= 55 ∑y= 886 ∑X2=385 ∑XY=4792
Step 2: Calculation the M value:
Formula:
M = [N ∑XY - ∑x ∑y]/ [N ∑X2 - (∑x)2]
= [ 10 * 4792 – (55 * 886) ] / [10*385- (55)2 ]
= [47920 – 48730] / [3850 – 3025]
= -810 / 825
= - 0.98
Step 3: Calculation the value of C:
Formula:
C = ∑y - m ∑x / N
= (886 – {-0.98 * 55}) / 10
= 939.9 / 10
= 93.99
Step 4: Humidity on 15th day:
Formula:
Y = mx + c
= - 0.98 * 15 + 93.99
= -14.7 + 93.99
= 79.29
The level of humidity on 15th day will be 79.29.
Step 5: Humidity on 20th Day:
Formula:
Y = mx + c
= -0.98 * 20 + 93.99
= -19.6 + 93.99
= 74.39
The humidity level on 20th day will be 74.39.
CONCLUSION
From the above discussion and calculation it has been concluded that, with the help of
data analysis and statistical organizations able to collect, analyse or make future decisions in
respect of the business operations. Statistical analysis helps in calculating mean, median, mode,
standard deviation etc. In addition, linear forecasting model used to evaluate the future trend
regarding humidity level of the city.
REFERENCES
Books & Journals
Dong, Q., Sun, Y. and Li, P., 2017. A novel forecasting model based on a hybrid processing
strategy and an optimized local linear fuzzy neural network to make wind power
forecasting: A case study of wind farms in China. Renewable Energy. 102. pp.241-257.
Hu, R. and et.al., 2017. A short-term power load forecasting model based on the generalized
regression neural network with decreasing step fruit fly optimization
algorithm. Neurocomputing. 221. pp.24-31.
Ma, J., Qu, J. H. and Sun, D. W., 2017. Developing hyperspectral prediction model for
investigating dehydrating and rehydrating mass changes of vacuum freeze dried grass
carp fillets. Food and bioproducts processing. 104. pp.66-76.
Rafiq, M., Jabeen, M. and Arif, M., 2017. Continuing education (CE) of LIS professionals: Need
analysis & role of LIS schools. The Journal of Academic Librarianship. 43(1). pp.25-
33.
Online
Humidity Level of Bristol City of England. 2020. [Online]. Available through:
<https://www.timeanddate.com/weather/uk/bristol/historic>
1 out of 10
Related Documents


Your All-in-One AI-Powered Toolkit for Academic Success.
+13062052269
info@desklib.com
Available 24*7 on WhatsApp / Email
![[object Object]](/_next/static/media/star-bottom.7253800d.svg)
Unlock your academic potential
© 2024 | Zucol Services PVT LTD | All rights reserved.