Financial Management: Case Study Report on Rio Tinto Group
VerifiedAdded on 2023/06/18
|15
|3738
|462
AI Summary
This report provides financial and non-financial analysis of the Rio Tinto Group, a leading mining group. It includes key financial and economic outlook, financial ratio analysis, and recommendations for the company's future success. The report covers profitability and market ratios, efficiency ratios, liquidity ratios, and gearing ratios. The subject is Financial Management and the course code is not mentioned. The course name and college/university are not mentioned.
Contribute Materials
Your contribution can guide someone’s learning journey. Share your
documents today.
FINANCIAL
MANAGEMENT : - CASE
STUDY REPORT
MANAGEMENT : - CASE
STUDY REPORT
Secure Best Marks with AI Grader
Need help grading? Try our AI Grader for instant feedback on your assignments.
EXECUTIVE SUMMARY
The current project shall be highlighting on the financial and the non-financial analysis of
the Rio Tinto Group. There is the key financial and the economic outlook of the company that
shall be disclosing the recent events that have been incurred in the business. Apart from that the
major part is covered in the financial ratio analysis that shall be undertaken to compare the
financial statements of the business for the two consecutive years showing the performance that
it has generated and the improvements that are made over the years.
TABLE OF CONTENTS
TABLE OF CONTENTS................................................................................................................3
INTRODUCTION...........................................................................................................................1
Background and business............................................................................................................1
COMPANY ANALYSIS.................................................................................................................1
Financial highlights.....................................................................................................................1
Economic outlook........................................................................................................................1
RATIO ANALYSIS........................................................................................................................2
Profitability and market ratios.....................................................................................................2
Efficiency ratios...........................................................................................................................3
Liquidity ratios.............................................................................................................................4
Gearing ratios...............................................................................................................................5
RECOMMENDATIONS.................................................................................................................6
Is the current reporting year better than the prior reporting year for the Rio Tinto....................6
Scope of the company succeeding in the future..........................................................................6
Likelihood for the merger or the acquisition for the Rio Tinto Group........................................7
Suggestions for the company to succeed in the future................................................................7
Impacts from the external business environment........................................................................7
Should the investment be made in Rio Tinto...............................................................................8
REFERENCES................................................................................................................................9
APPENDICES...............................................................................................................................10
Calculation of ratios...................................................................................................................10
INTRODUCTION
Background and business
The Rio Tinto Group is the Anglo-Australian multinational company which is a leading
mining group that was established in 1873 and is headquartered in London. It is one of the
leading businesses and the second largest in the metals and mining corporation. It is indulged in
the activities like finding, mining and processing of the Earth's mineral resources. Some major
minerals that it produces are iron ore, copper, diamonds, gold and uranium etc. It has been
having the poor records in terms of the corporate governance and the corporate social
responsibility that is affecting the human and the labour rights and apart from that it is involved
in several corporate scandals like the Juukan Gorge.
COMPANY ANALYSIS
Financial highlights
The current financial performance of the Rio Tinto Group shows the high potential of the
company in the operations sector as the profitability margin has risen to a huge extent depicting
the positive signal for the business. Apart from that the strengthening of the balance sheet can
evidently be noticed in case of the decrease in the debt element of the company that is from 3.7
billion to 0.7 billion leaving huge amount of the free cash flows for the company under the
consideration. The year has provided with the extraordinary performance in the year 2020 also
boosting the safety and the security position of the company through the proper application of
the corporate governance (Yap, Komalasari and Hadiansah, 2018). With the increased
performance of the company the efficiency of the stakeholders is also increased through
providing the better returns on equity and the capital employed of the company. The company
has also significantly increased the margin of the dividend payout ratio in the company further
increasing the satisfaction that is attained by the shareholders that are affiliated by the business
from 5.9 to 7.4.
Economic outlook
The economic outlook of the company depicts that there is a strong performance
underlying the current annual reports of the Rio Tinto Group. It can also be assessed that such
performance of the company strengthens its position in the market. One of the significant
contributors to the same are the commodity prices of the iron ore in the market which tends to
rise and comprises the major portion of the earnings in the market (Fitch Affirms Rio Tinto at 'A';
1
Secure Best Marks with AI Grader
Need help grading? Try our AI Grader for instant feedback on your assignments.
Stable Outlook, 2021). The earnings before interest and tax in the previous year rose by the
margin of 14% and is now increasing by the margin of 30% which is the rare jump in the market.
Apart from that the company is facilitated by the strong cash position in the business and the
financial flexibility that is experienced by the business due to the lesser debt ratio in the
company. The business optimizes on the lower leverage ratio through developing the highly
conservative balance sheet of the company. It is one of the leading global mining companies and
has attained the similar position through the diversification that is being operated in the business
and the higher level of the demands that are enjoyed of the aluminium and the iron ore of the
company.
RATIO ANALYSIS
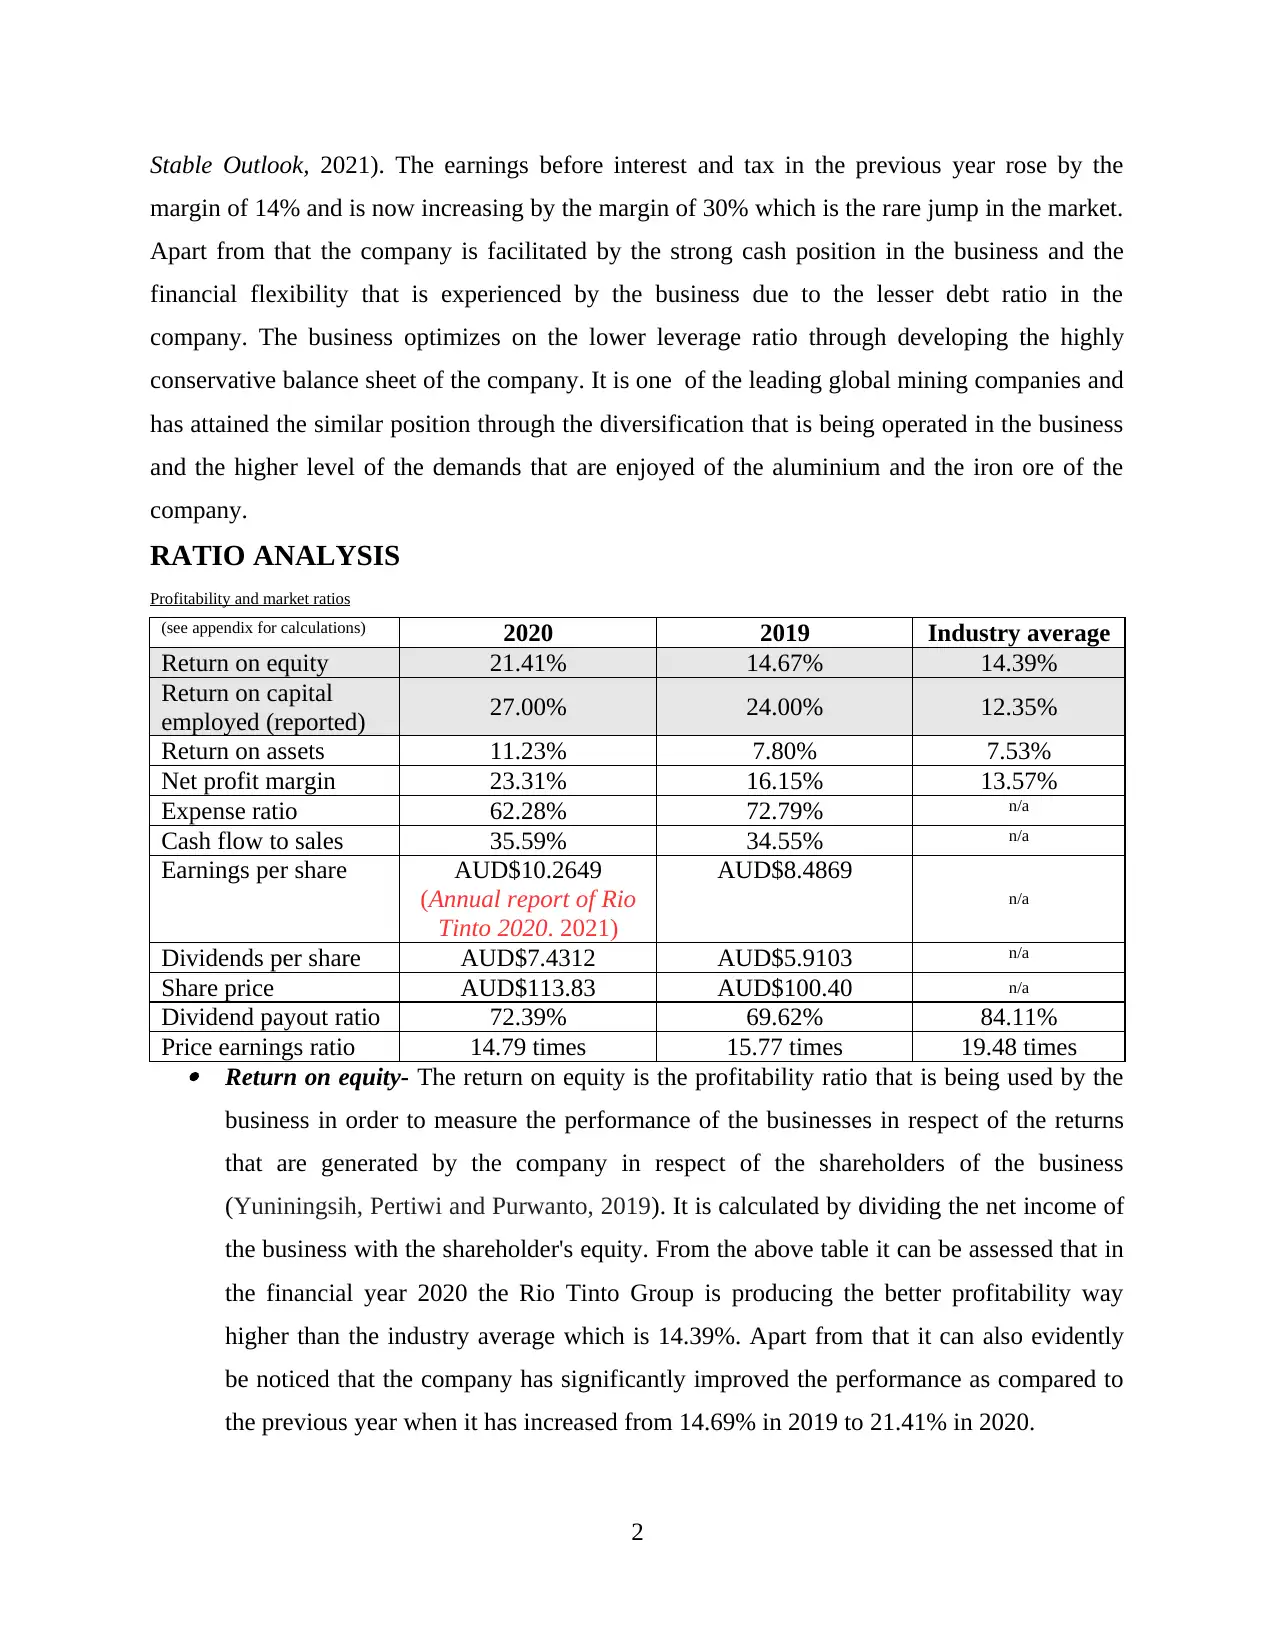
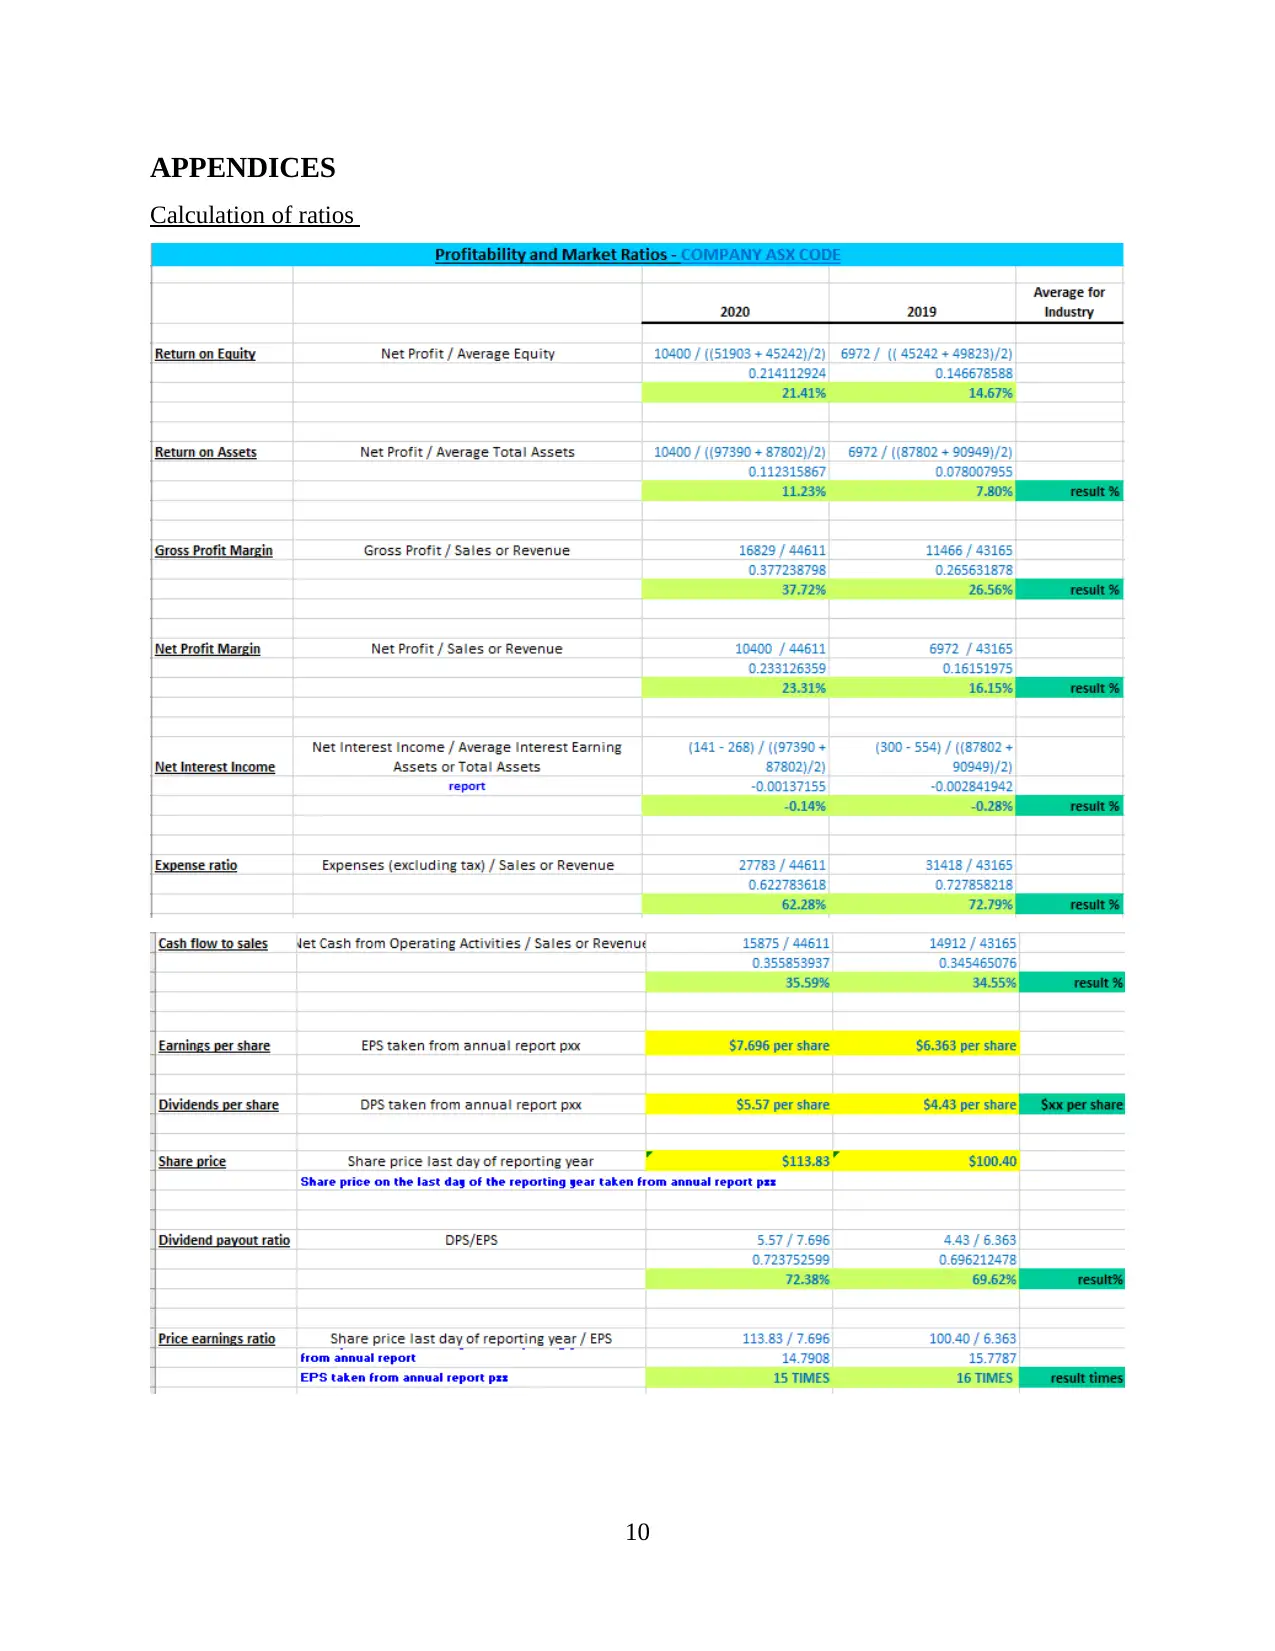
Profitability and market ratios
(see appendix for calculations) 2020 2019 Industry average
Return on equity 21.41% 14.67% 14.39%
Return on capital
employed (reported) 27.00% 24.00% 12.35%
Return on assets 11.23% 7.80% 7.53%
Net profit margin 23.31% 16.15% 13.57%
Expense ratio 62.28% 72.79% n/a
Cash flow to sales 35.59% 34.55% n/a
Earnings per share AUD$10.2649
(Annual report of Rio
Tinto 2020. 2021)
AUD$8.4869
n/a
Dividends per share AUD$7.4312 AUD$5.9103 n/a
Share price AUD$113.83 AUD$100.40 n/a
Dividend payout ratio 72.39% 69.62% 84.11%
Price earnings ratio 14.79 times 15.77 times 19.48 times
Return on equity- The return on equity is the profitability ratio that is being used by the
business in order to measure the performance of the businesses in respect of the returns
that are generated by the company in respect of the shareholders of the business
(Yuniningsih, Pertiwi and Purwanto, 2019). It is calculated by dividing the net income of
the business with the shareholder's equity. From the above table it can be assessed that in
the financial year 2020 the Rio Tinto Group is producing the better profitability way
higher than the industry average which is 14.39%. Apart from that it can also evidently
be noticed that the company has significantly improved the performance as compared to
the previous year when it has increased from 14.69% in 2019 to 21.41% in 2020.
2
margin of 14% and is now increasing by the margin of 30% which is the rare jump in the market.
Apart from that the company is facilitated by the strong cash position in the business and the
financial flexibility that is experienced by the business due to the lesser debt ratio in the
company. The business optimizes on the lower leverage ratio through developing the highly
conservative balance sheet of the company. It is one of the leading global mining companies and
has attained the similar position through the diversification that is being operated in the business
and the higher level of the demands that are enjoyed of the aluminium and the iron ore of the
company.
RATIO ANALYSIS
Profitability and market ratios
(see appendix for calculations) 2020 2019 Industry average
Return on equity 21.41% 14.67% 14.39%
Return on capital
employed (reported) 27.00% 24.00% 12.35%
Return on assets 11.23% 7.80% 7.53%
Net profit margin 23.31% 16.15% 13.57%
Expense ratio 62.28% 72.79% n/a
Cash flow to sales 35.59% 34.55% n/a
Earnings per share AUD$10.2649
(Annual report of Rio
Tinto 2020. 2021)
AUD$8.4869
n/a
Dividends per share AUD$7.4312 AUD$5.9103 n/a
Share price AUD$113.83 AUD$100.40 n/a
Dividend payout ratio 72.39% 69.62% 84.11%
Price earnings ratio 14.79 times 15.77 times 19.48 times
Return on equity- The return on equity is the profitability ratio that is being used by the
business in order to measure the performance of the businesses in respect of the returns
that are generated by the company in respect of the shareholders of the business
(Yuniningsih, Pertiwi and Purwanto, 2019). It is calculated by dividing the net income of
the business with the shareholder's equity. From the above table it can be assessed that in
the financial year 2020 the Rio Tinto Group is producing the better profitability way
higher than the industry average which is 14.39%. Apart from that it can also evidently
be noticed that the company has significantly improved the performance as compared to
the previous year when it has increased from 14.69% in 2019 to 21.41% in 2020.
2
Net profit margin- The net profit margin of the company depicts the profitability that is
received by the company after deducting all the costs and the expenses of the business.
This ratio for the company is significantly rising since the operations are being performed
with the overall efficiency in the business and are reducing the cost per unit of the
company thereby increasing the profitability by a huge margin.
Earnings per share- The earnings per share that is attained by the shareholder's of the
business is to be maximized by the company and which is possible by the increasing
returns that are generated by the company. In the current analysis it can be observed that
the earnings per share of the company is increasing as compared to the previous from 8.5
to 10.2 per share.
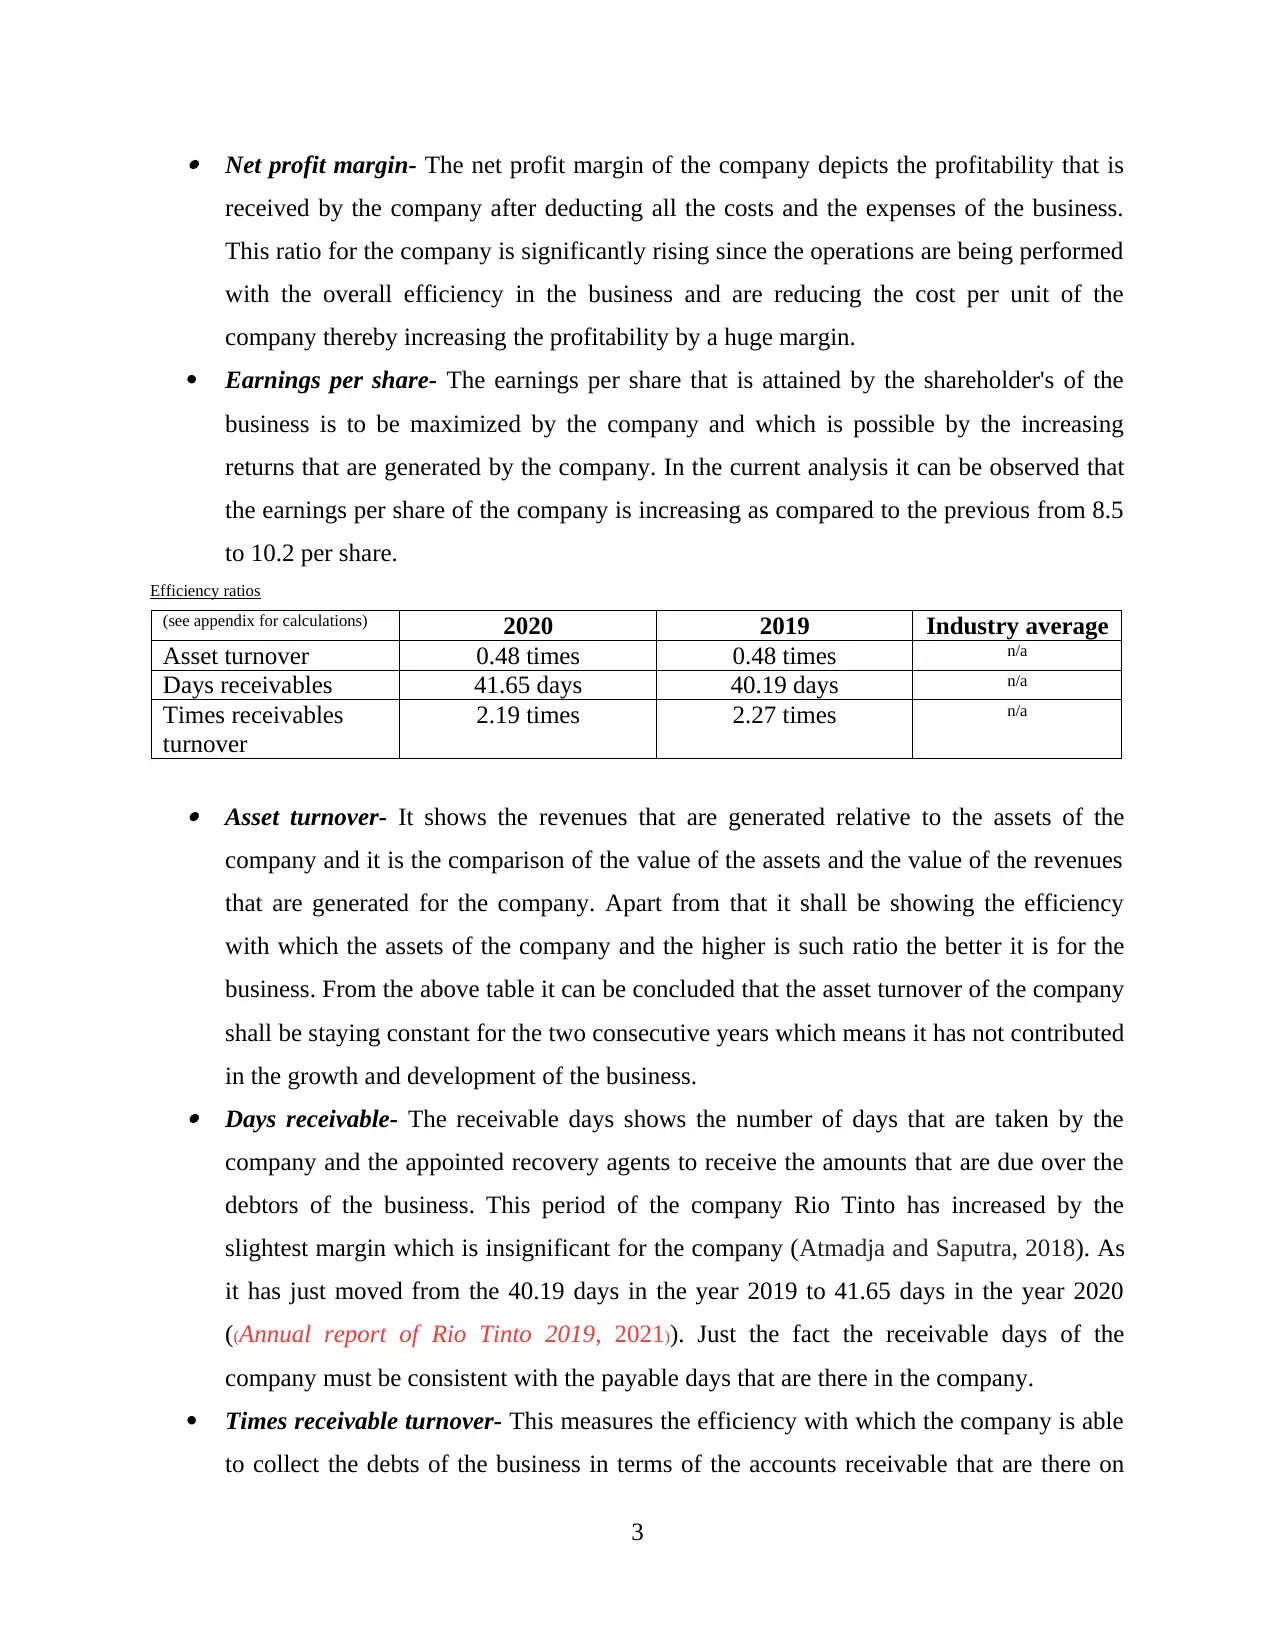
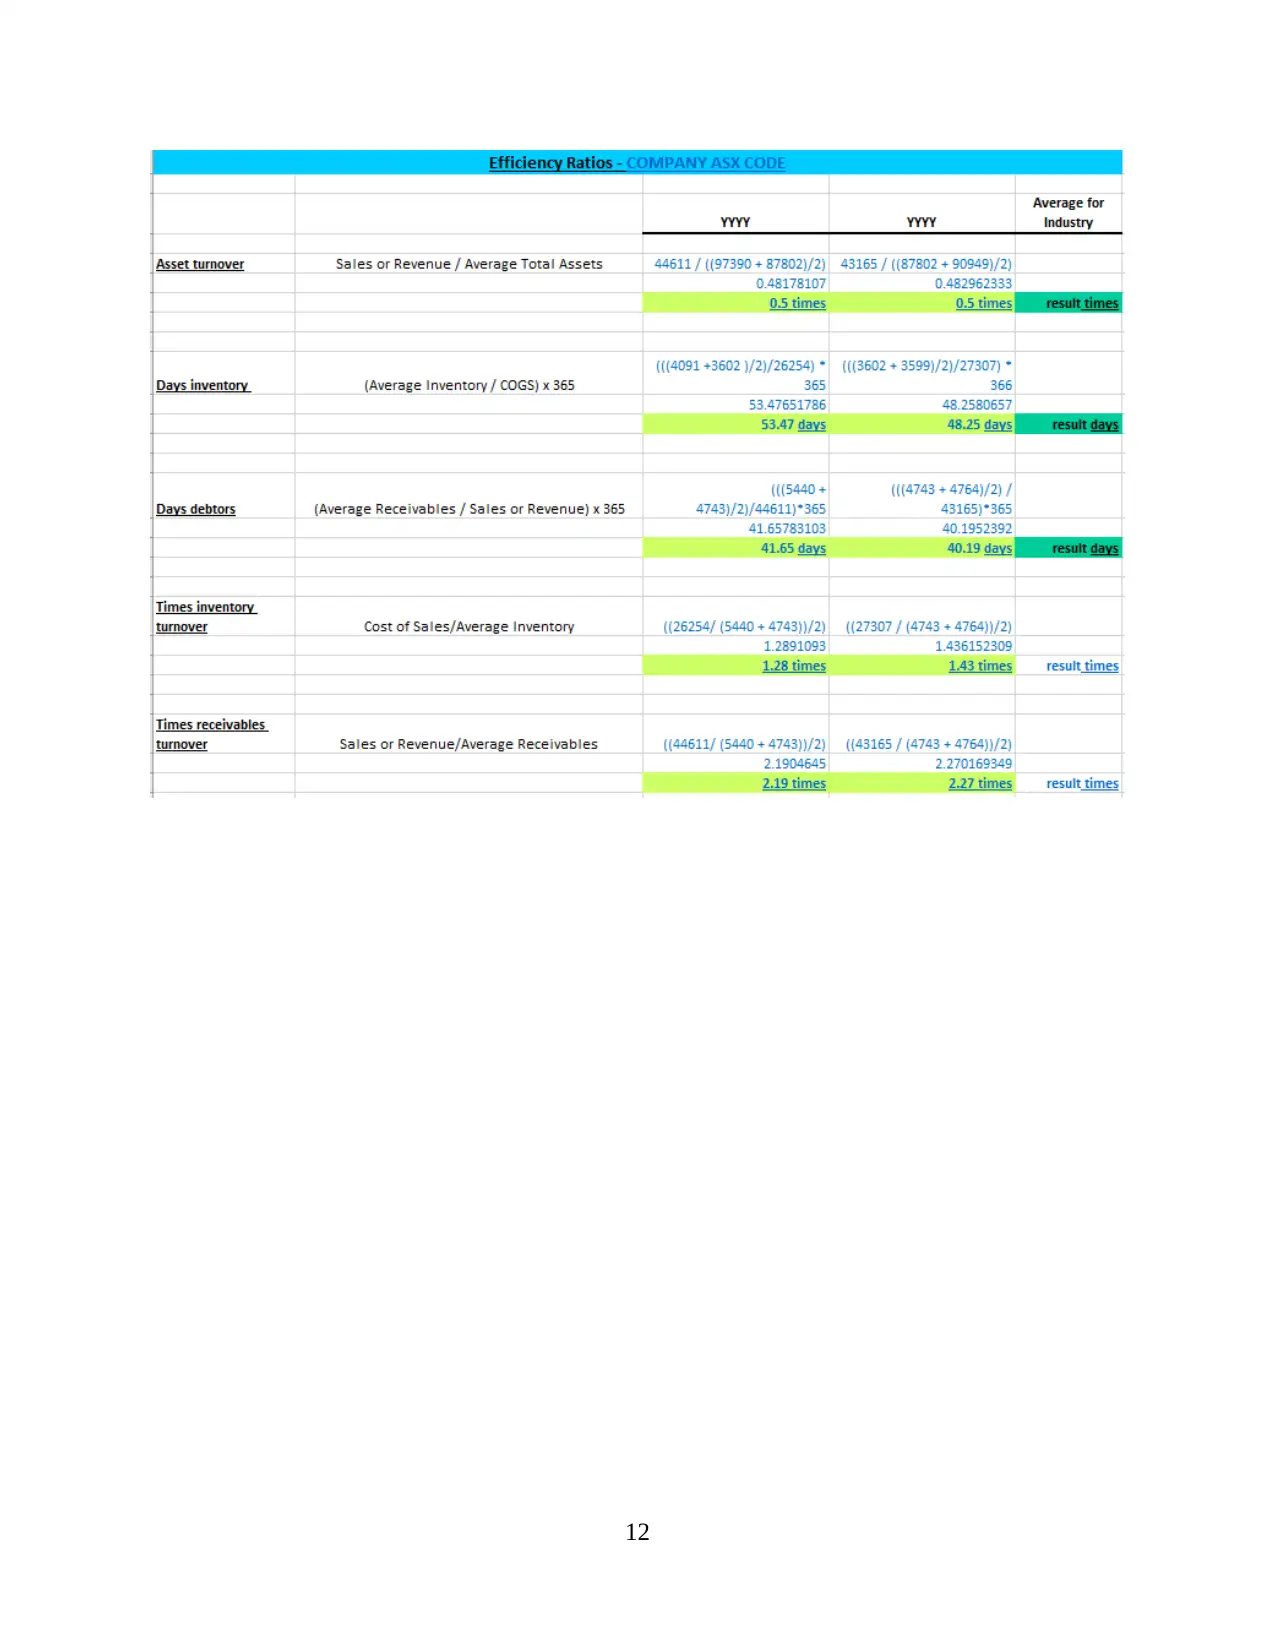
Efficiency ratios
(see appendix for calculations) 2020 2019 Industry average
Asset turnover 0.48 times 0.48 times n/a
Days receivables 41.65 days 40.19 days n/a
Times receivables
turnover
2.19 times 2.27 times n/a
Asset turnover- It shows the revenues that are generated relative to the assets of the
company and it is the comparison of the value of the assets and the value of the revenues
that are generated for the company. Apart from that it shall be showing the efficiency
with which the assets of the company and the higher is such ratio the better it is for the
business. From the above table it can be concluded that the asset turnover of the company
shall be staying constant for the two consecutive years which means it has not contributed
in the growth and development of the business. Days receivable- The receivable days shows the number of days that are taken by the
company and the appointed recovery agents to receive the amounts that are due over the
debtors of the business. This period of the company Rio Tinto has increased by the
slightest margin which is insignificant for the company (Atmadja and Saputra, 2018). As
it has just moved from the 40.19 days in the year 2019 to 41.65 days in the year 2020
((Annual report of Rio Tinto 2019, 2021)). Just the fact the receivable days of the
company must be consistent with the payable days that are there in the company.
Times receivable turnover- This measures the efficiency with which the company is able
to collect the debts of the business in terms of the accounts receivable that are there on
3
received by the company after deducting all the costs and the expenses of the business.
This ratio for the company is significantly rising since the operations are being performed
with the overall efficiency in the business and are reducing the cost per unit of the
company thereby increasing the profitability by a huge margin.
Earnings per share- The earnings per share that is attained by the shareholder's of the
business is to be maximized by the company and which is possible by the increasing
returns that are generated by the company. In the current analysis it can be observed that
the earnings per share of the company is increasing as compared to the previous from 8.5
to 10.2 per share.
Efficiency ratios
(see appendix for calculations) 2020 2019 Industry average
Asset turnover 0.48 times 0.48 times n/a
Days receivables 41.65 days 40.19 days n/a
Times receivables
turnover
2.19 times 2.27 times n/a
Asset turnover- It shows the revenues that are generated relative to the assets of the
company and it is the comparison of the value of the assets and the value of the revenues
that are generated for the company. Apart from that it shall be showing the efficiency
with which the assets of the company and the higher is such ratio the better it is for the
business. From the above table it can be concluded that the asset turnover of the company
shall be staying constant for the two consecutive years which means it has not contributed
in the growth and development of the business. Days receivable- The receivable days shows the number of days that are taken by the
company and the appointed recovery agents to receive the amounts that are due over the
debtors of the business. This period of the company Rio Tinto has increased by the
slightest margin which is insignificant for the company (Atmadja and Saputra, 2018). As
it has just moved from the 40.19 days in the year 2019 to 41.65 days in the year 2020
((Annual report of Rio Tinto 2019, 2021)). Just the fact the receivable days of the
company must be consistent with the payable days that are there in the company.
Times receivable turnover- This measures the efficiency with which the company is able
to collect the debts of the business in terms of the accounts receivable that are there on
3
the balance sheet of the enterprise. This reveals the number of times that the debts are
being recovered by the business. This ratio for the Rio Tinto company has increased from
2.27 times in the year 2019 to 2.19 times in the year 2020.
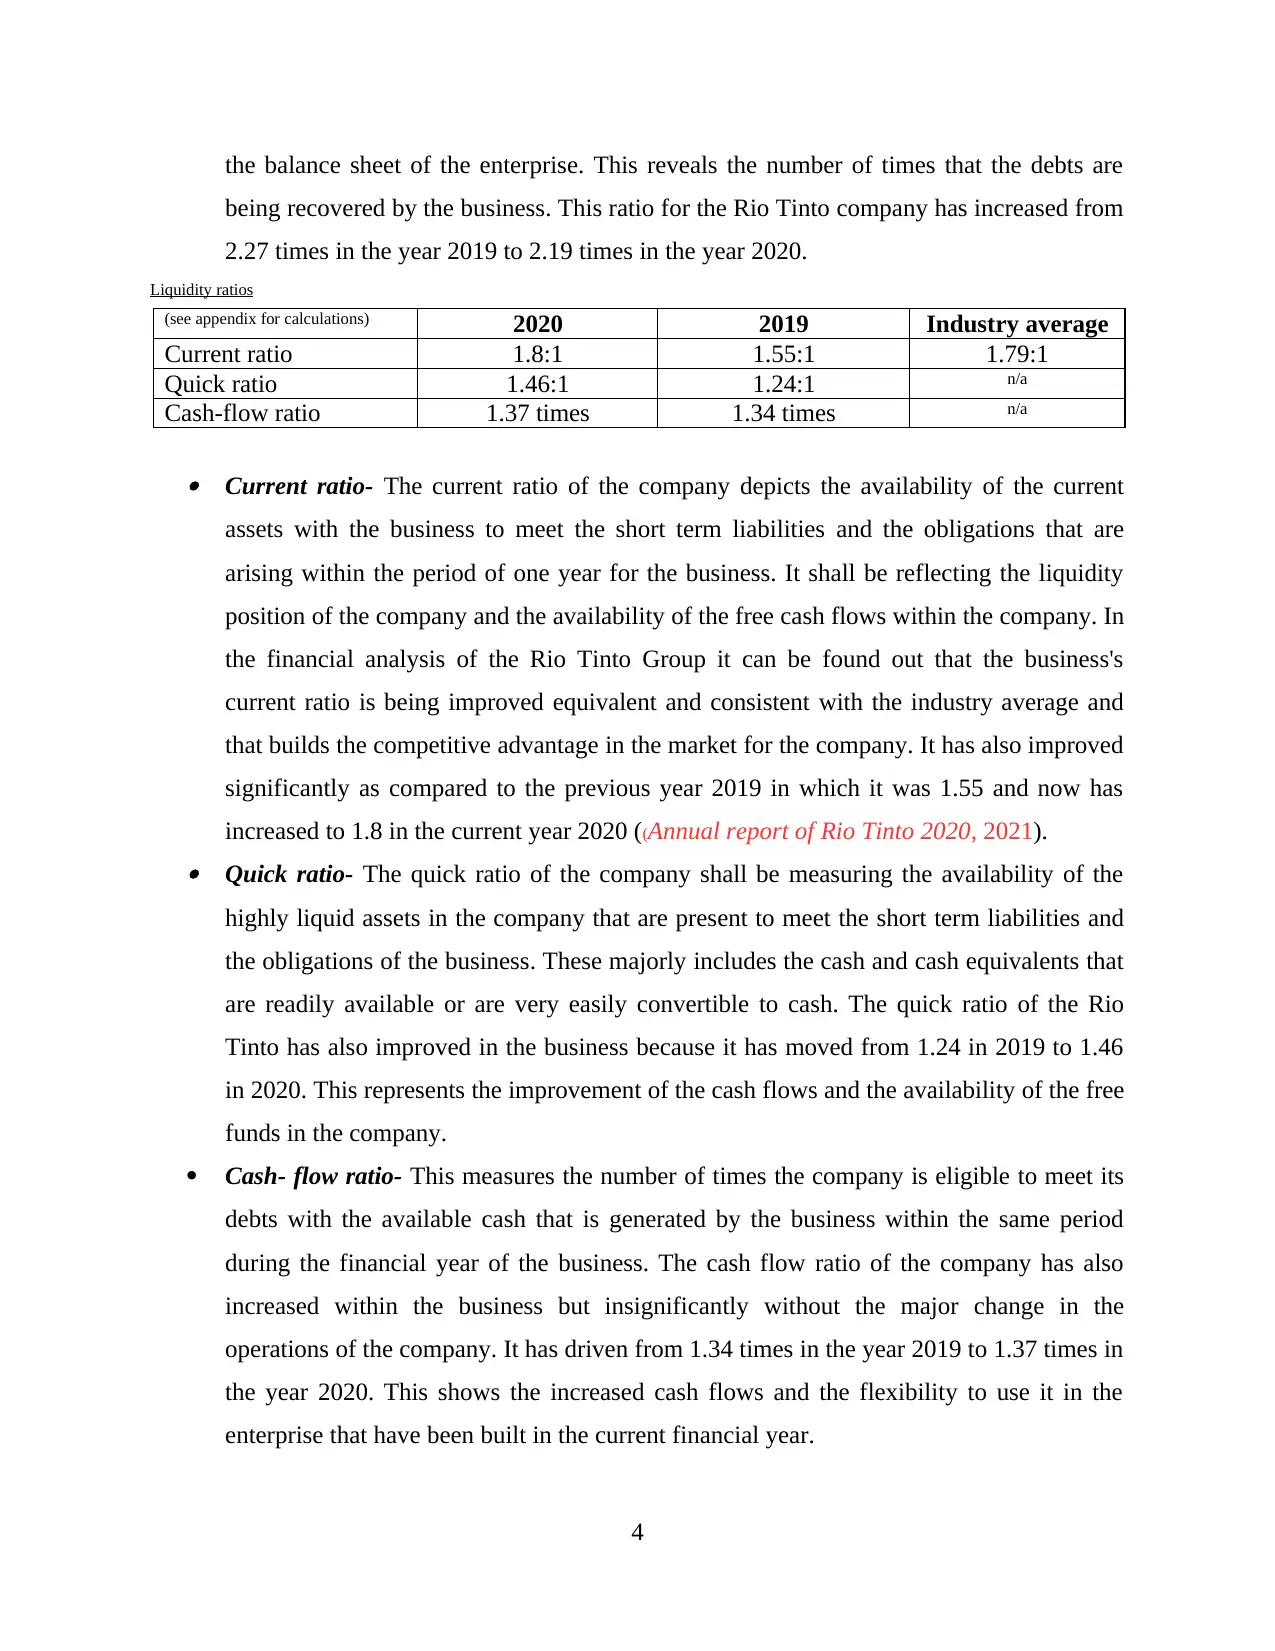
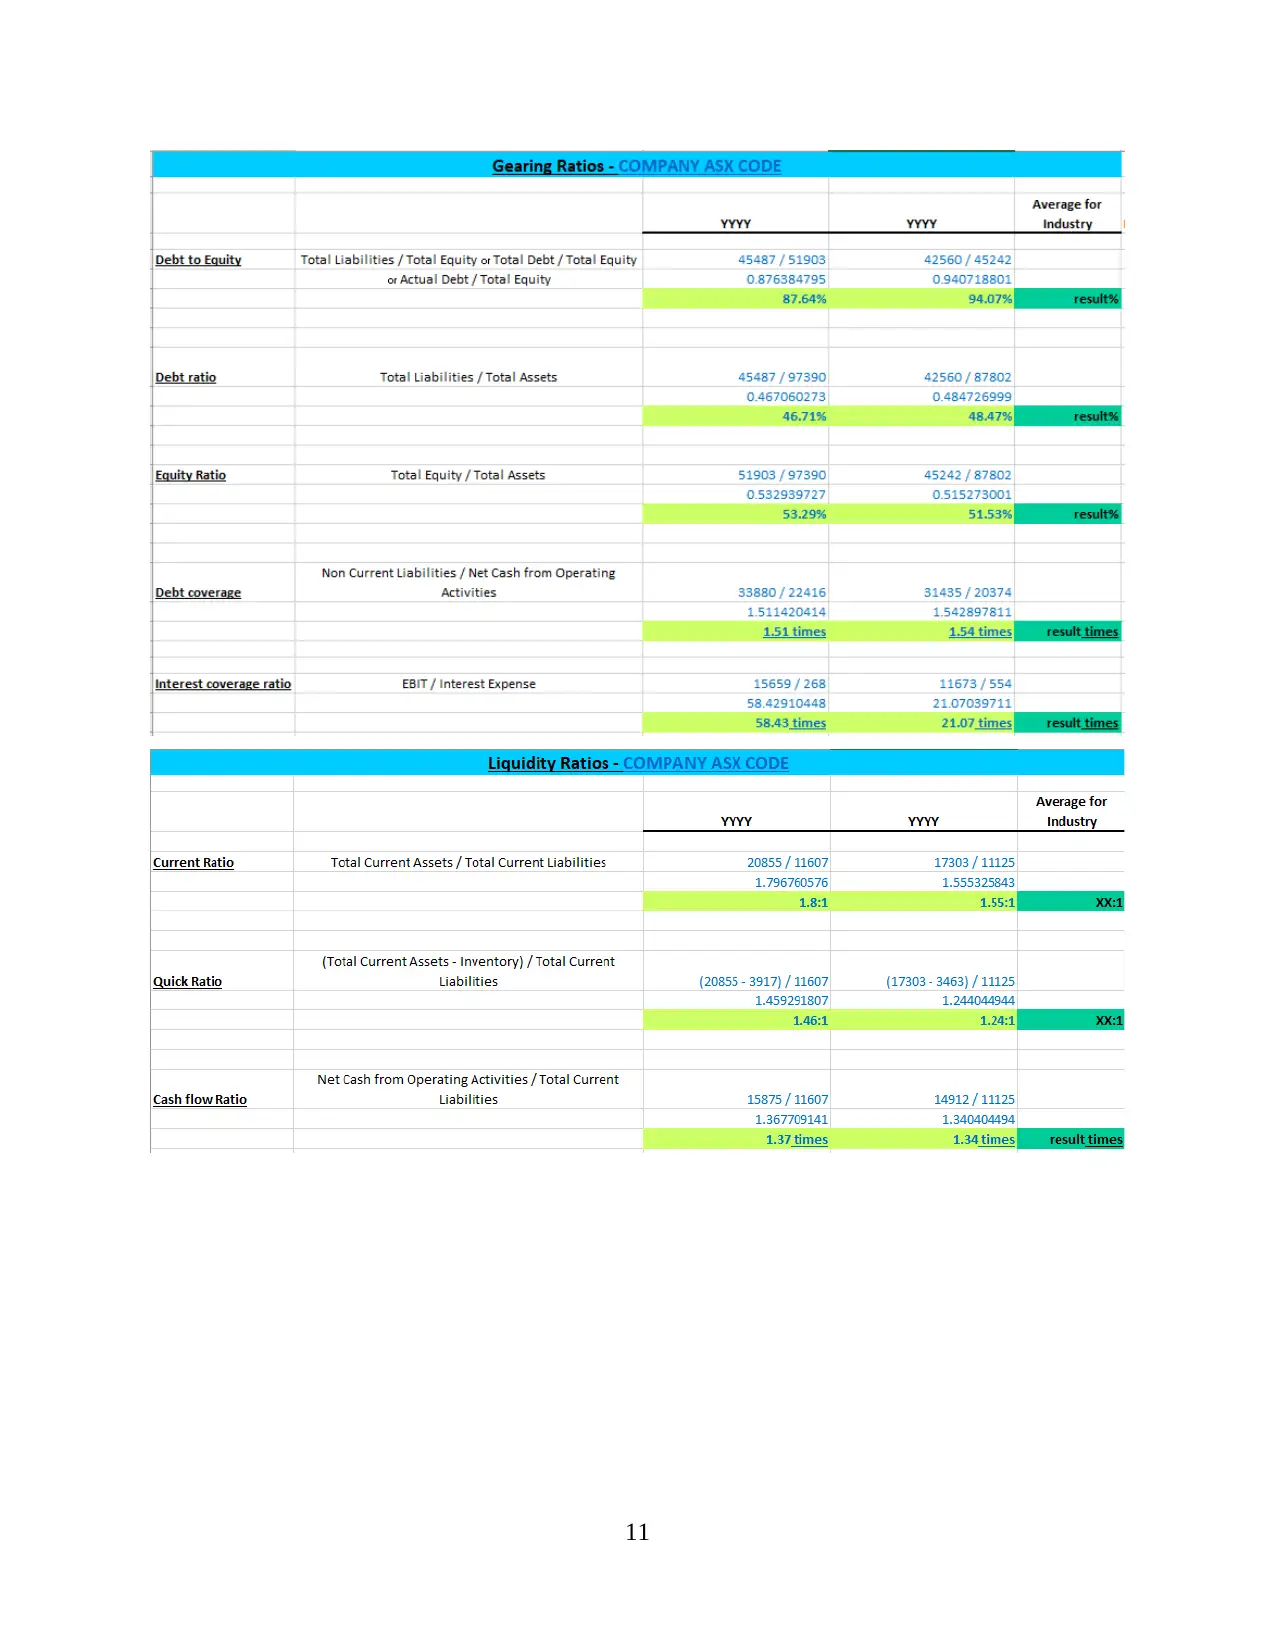
Liquidity ratios
(see appendix for calculations) 2020 2019 Industry average
Current ratio 1.8:1 1.55:1 1.79:1
Quick ratio 1.46:1 1.24:1 n/a
Cash-flow ratio 1.37 times 1.34 times n/a
Current ratio- The current ratio of the company depicts the availability of the current
assets with the business to meet the short term liabilities and the obligations that are
arising within the period of one year for the business. It shall be reflecting the liquidity
position of the company and the availability of the free cash flows within the company. In
the financial analysis of the Rio Tinto Group it can be found out that the business's
current ratio is being improved equivalent and consistent with the industry average and
that builds the competitive advantage in the market for the company. It has also improved
significantly as compared to the previous year 2019 in which it was 1.55 and now has
increased to 1.8 in the current year 2020 ((Annual report of Rio Tinto 2020, 2021). Quick ratio- The quick ratio of the company shall be measuring the availability of the
highly liquid assets in the company that are present to meet the short term liabilities and
the obligations of the business. These majorly includes the cash and cash equivalents that
are readily available or are very easily convertible to cash. The quick ratio of the Rio
Tinto has also improved in the business because it has moved from 1.24 in 2019 to 1.46
in 2020. This represents the improvement of the cash flows and the availability of the free
funds in the company.
Cash- flow ratio- This measures the number of times the company is eligible to meet its
debts with the available cash that is generated by the business within the same period
during the financial year of the business. The cash flow ratio of the company has also
increased within the business but insignificantly without the major change in the
operations of the company. It has driven from 1.34 times in the year 2019 to 1.37 times in
the year 2020. This shows the increased cash flows and the flexibility to use it in the
enterprise that have been built in the current financial year.
4
being recovered by the business. This ratio for the Rio Tinto company has increased from
2.27 times in the year 2019 to 2.19 times in the year 2020.
Liquidity ratios
(see appendix for calculations) 2020 2019 Industry average
Current ratio 1.8:1 1.55:1 1.79:1
Quick ratio 1.46:1 1.24:1 n/a
Cash-flow ratio 1.37 times 1.34 times n/a
Current ratio- The current ratio of the company depicts the availability of the current
assets with the business to meet the short term liabilities and the obligations that are
arising within the period of one year for the business. It shall be reflecting the liquidity
position of the company and the availability of the free cash flows within the company. In
the financial analysis of the Rio Tinto Group it can be found out that the business's
current ratio is being improved equivalent and consistent with the industry average and
that builds the competitive advantage in the market for the company. It has also improved
significantly as compared to the previous year 2019 in which it was 1.55 and now has
increased to 1.8 in the current year 2020 ((Annual report of Rio Tinto 2020, 2021). Quick ratio- The quick ratio of the company shall be measuring the availability of the
highly liquid assets in the company that are present to meet the short term liabilities and
the obligations of the business. These majorly includes the cash and cash equivalents that
are readily available or are very easily convertible to cash. The quick ratio of the Rio
Tinto has also improved in the business because it has moved from 1.24 in 2019 to 1.46
in 2020. This represents the improvement of the cash flows and the availability of the free
funds in the company.
Cash- flow ratio- This measures the number of times the company is eligible to meet its
debts with the available cash that is generated by the business within the same period
during the financial year of the business. The cash flow ratio of the company has also
increased within the business but insignificantly without the major change in the
operations of the company. It has driven from 1.34 times in the year 2019 to 1.37 times in
the year 2020. This shows the increased cash flows and the flexibility to use it in the
enterprise that have been built in the current financial year.
4
Paraphrase This Document
Need a fresh take? Get an instant paraphrase of this document with our AI Paraphraser
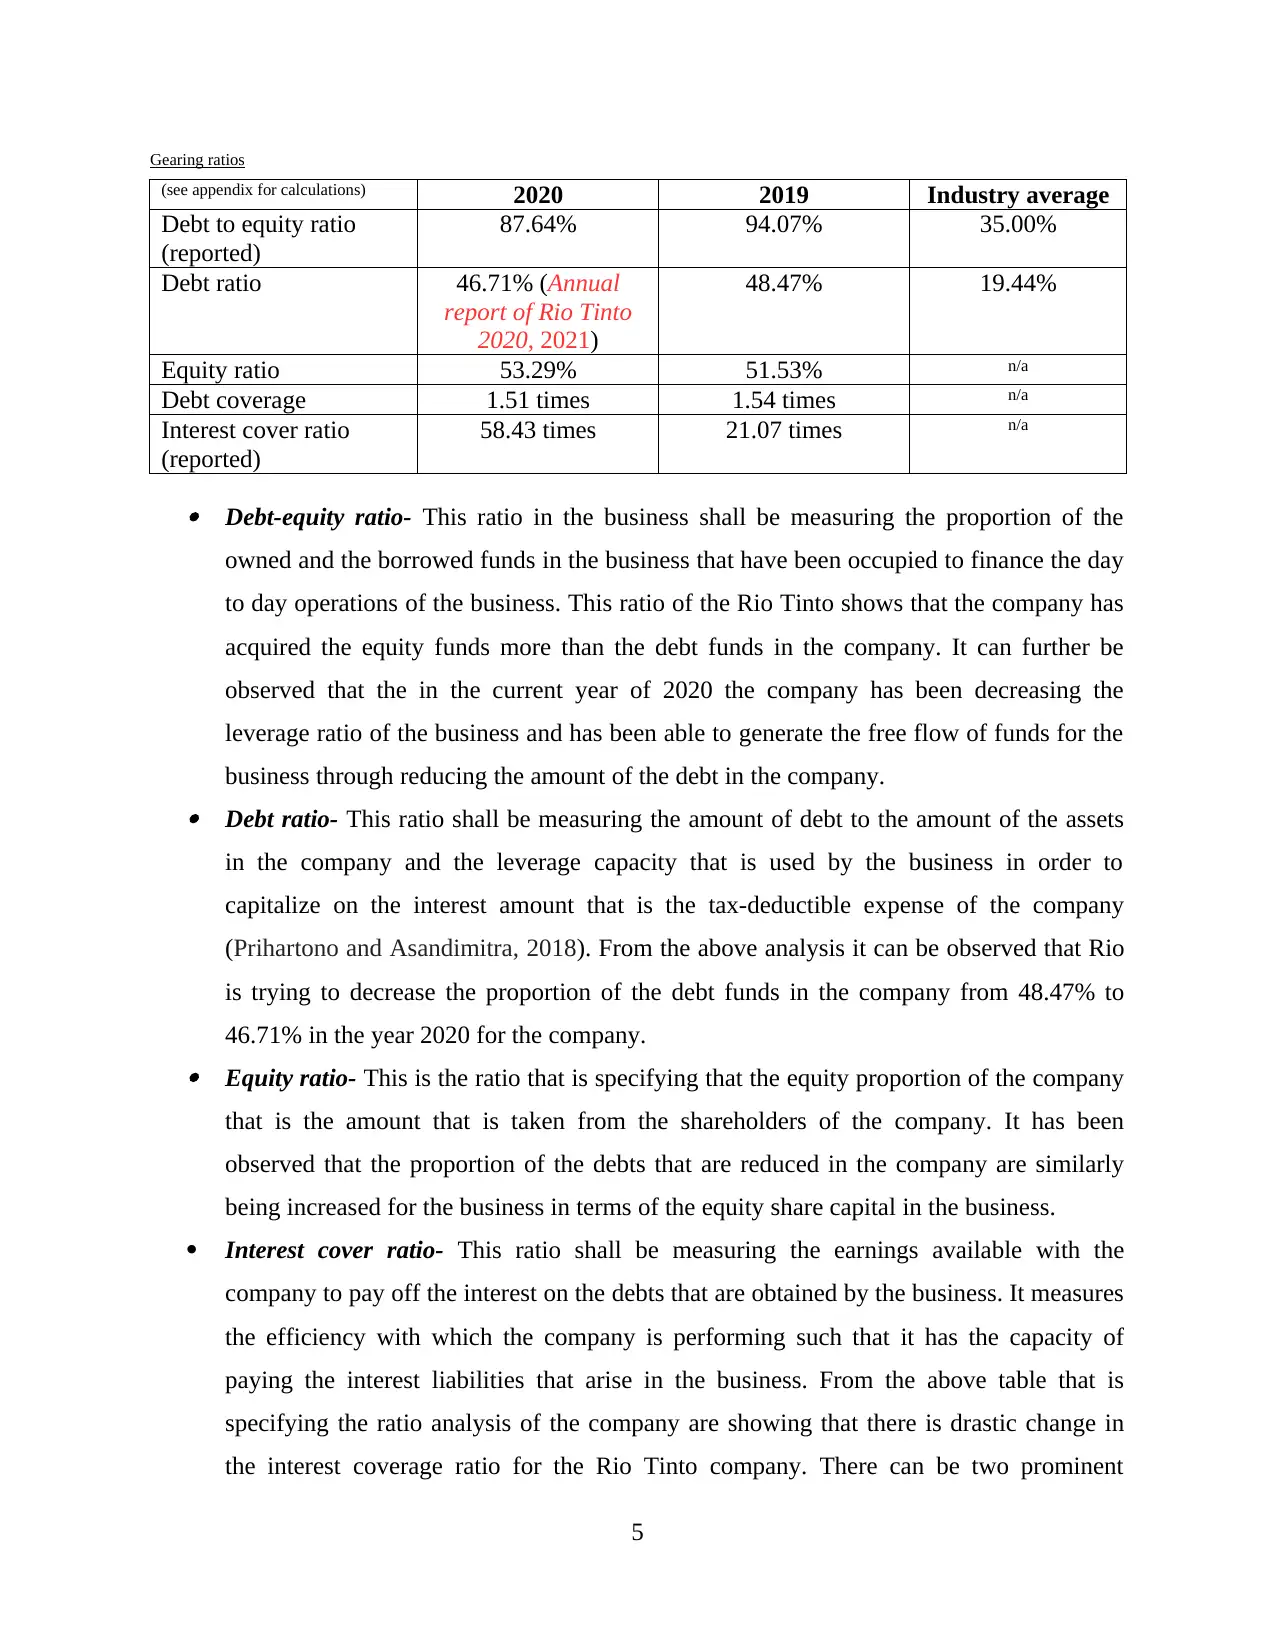
Gearing ratios
(see appendix for calculations) 2020 2019 Industry average
Debt to equity ratio
(reported)
87.64% 94.07% 35.00%
Debt ratio 46.71% (Annual
report of Rio Tinto
2020, 2021)
48.47% 19.44%
Equity ratio 53.29% 51.53% n/a
Debt coverage 1.51 times 1.54 times n/a
Interest cover ratio
(reported)
58.43 times 21.07 times n/a
Debt-equity ratio- This ratio in the business shall be measuring the proportion of the
owned and the borrowed funds in the business that have been occupied to finance the day
to day operations of the business. This ratio of the Rio Tinto shows that the company has
acquired the equity funds more than the debt funds in the company. It can further be
observed that the in the current year of 2020 the company has been decreasing the
leverage ratio of the business and has been able to generate the free flow of funds for the
business through reducing the amount of the debt in the company. Debt ratio- This ratio shall be measuring the amount of debt to the amount of the assets
in the company and the leverage capacity that is used by the business in order to
capitalize on the interest amount that is the tax-deductible expense of the company
(Prihartono and Asandimitra, 2018). From the above analysis it can be observed that Rio
is trying to decrease the proportion of the debt funds in the company from 48.47% to
46.71% in the year 2020 for the company. Equity ratio- This is the ratio that is specifying that the equity proportion of the company
that is the amount that is taken from the shareholders of the company. It has been
observed that the proportion of the debts that are reduced in the company are similarly
being increased for the business in terms of the equity share capital in the business.
Interest cover ratio- This ratio shall be measuring the earnings available with the
company to pay off the interest on the debts that are obtained by the business. It measures
the efficiency with which the company is performing such that it has the capacity of
paying the interest liabilities that arise in the business. From the above table that is
specifying the ratio analysis of the company are showing that there is drastic change in
the interest coverage ratio for the Rio Tinto company. There can be two prominent
5
reasons for the same which are one that the debts of the company are reduced
significantly lowering down the interest liability for the company and also the
profitability of the company has been boosted. This is the reason that the ratio of the
company has increased from 21.07 times in 2019 to 58.43 times in the year 2020, which
is almost triple to the previous year.
RECOMMENDATIONS
Is the current reporting year better than the prior reporting year for the Rio Tinto
Based on the above ratio analysis of the company it can be assessed that the current
reporting year is better than the previous one which can be assured with the help of the ratio
analysis of the Rio Tinto that took place with the help of the annual reports in the company.
Apart from that it can also evidently be noticed that the profitability, liquidity and the efficiency
margin of the company is increasing for the business thereby maximizing the future prosperity of
the business. The increase in the earnings that have been optimized by the company through the
efficiency in the operations of the entity which is being represented by the profit margins, returns
generated for the shareholders of the business, dividend that is being to the shareholders of the
business. This is also the case with the liquidity position in the business wherein the company
have significantly boosted the credibility of the company by timely and efficiently meeting the
liabilities and the obligations of the business. This shall also be helping in the smoothing of the
operations in the business through the availability of the free flow of funds in the company. It
can also be noticed that the company is also planning to reduce the leverage of the business
thereby increasing the proportion of the equity funds in the company. This shall be strengthening
the balance sheet of the company.
Scope of the company succeeding in the future
The scope of the Rio Tinto to succeed in the future are very high because the major
reason behind that is the increase in the demand of the aluminium and the iron ore in the market
which are the major contributors to its earnings in the business. Apart from that the increasing
approach of the company to sustainability, corporate governance and the corporate social
responsibility is boosting the welfare for the company in the market. The low carbon footprint,
go green movement have somewhere contributed to the positive publicity of the business. Also,
6
the current trend of profitability and the future growth prospects of the company shall be
continuing for the foreseeable future in the market.
Likelihood for the merger or the acquisition for the Rio Tinto Group
It has always been the strategy of the company to grow and capitalize on the
opportunities in the market through the planning of the mergers and acquisitions of the company.
It can also be assessed it is the mergers and acquisitions in the company through which the
company is able to grow into a successful leader and the leading business in the international
market of the Rio Tinto company. The company is further planning to extend its operations in
the market by further merging or through acquiring the other entities to obtain the benefit of
synergy in the business. It can further be evaluated that there are certain deals for the company
that are being finalized for the company. The value is being invested in the energy transition and
the various drilling programs that are being financed in the company.
Suggestions for the company to succeed in the future
There can be some suggestions and the recommendations for the company that can
further improve the position of the business and that is the reason that they are required to be
implemented in the business and accordingly the necessary actions are to be taken in the
company. These are some major suggestions to succeed in future for the Rio Tinto company:-
The first and the foremost is to devise the sustainability approach in the business by
functioning effectively and for the welfare of the society in which the business is
operating.
They can function for the application of the smart mining process in the company and
also share value of the business mining projects that are good for both the investor returns
and the preserving of the environment (Bulturbayevich and et.al., 2020).
It also has to review the cultural heritage before planning any of the mining activities in
the business and deciding on any of the locations. This is after the Jukaan Gorge incident
that shattered the image of the company publicly.
Impacts from the external business environment
Every individual business is being impacted by the external environment of the company
and the various factors that are lying there to which the company has to cope up with in order to
attain the growth prospects of the business. Apart from that it can also be assessed that the
company is operating in the free market so it has to face the cut-throat competition in the
7
Secure Best Marks with AI Grader
Need help grading? Try our AI Grader for instant feedback on your assignments.
business that is challenging it to its best. Since the company is operating globally so there is high
risk of the uncertainties pertaining to the political instability and the different lawful legislations
that have been framed by the variety of the constitution in the different parts of the world. It can
also be provided that the technological perspective of the business is high because this shall be
helping in the mining activities through the betterment of the business. Apart from that in the
social scenario it can evidently be noticed that the customers are highly moving towards the
current trends of the business where the sustainability and the environmental protection is the top
most priority and the business has to consider the same for succeeding in the business.
Should the investment be made in Rio Tinto
Yes, I think the investments are to be made in the Rio Tinto company since they are
probably having the bright future for the business and accordingly they are to be invested into as
this shall be providing with the higher returns to the company. Apart from that it also can be
assessed that they are having the high prospects of the growth and the sustainability in the
company.
8
REFERENCES
Books and Journals
Bulturbayevich, M. B. and et.al., 2020. Modern features of financial management in small
businesses. International Engineering Journal For Research & Development. 5(4).
pp.5-5.
Prihartono, M. R. D. and Asandimitra, N., 2018. Analysis factors influencing financial
management behaviour. International Journal of Academic Research in Business and
Social Sciences. 8(8). pp.308-326.
Atmadja, A. T. and Saputra, K. A. K., 2018. Determinant factors influencing the accountability
of village financial management. Academy of Strategic Management Journal. 17(1).
pp.1-9.
Yap, R. J. C., Komalasari, F. and Hadiansah, I., 2018. The effect of financial literacy and attitude
on financial management behavior and satisfaction. BISNIS & BIROKRASI: Jurnal Ilmu
Administrasi dan Organisasi. 23(3). p.4.
Yuniningsih, Y., Pertiwi, T. and Purwanto, E., 2019. Fundamental factor of financial
management in determining company values. Management Science Letters. 9(2).
pp.205-216.
Online
Annual report of Rio Tinto 2019. 2021. Online. Available through:
<https://www.riotinto.com/-/media/Content/Documents/Invest/Reports/Annual-reports/RT-
Annual-report-2019.pdf?>.
Annual report of Rio Tinto 2020. 2021. Online. Available through:
<https://www.riotinto.com/-/media/Content/Documents/Invest/Reports/Annual-reports/RT-
Annual-report-2020.pdf?rev=6df52113b92840648d05a4ac9e4cc1d8>.
Fitch Affirms Rio Tinto at 'A'; Stable Outlook. 2021. [Online] Available through:
<https://www.fitchratings.com/research/corporate-finance/fitch-affirms-rio-tinto-at-a-stable-
outlook-29-04-2021>
9
APPENDICES
Calculation of ratios
10
Calculation of ratios
10
Paraphrase This Document
Need a fresh take? Get an instant paraphrase of this document with our AI Paraphraser
11
12
1 out of 15
Related Documents


Your All-in-One AI-Powered Toolkit for Academic Success.
+13062052269
info@desklib.com
Available 24*7 on WhatsApp / Email
![[object Object]](/_next/static/media/star-bottom.7253800d.svg)
Unlock your academic potential
© 2024 | Zucol Services PVT LTD | All rights reserved.