MPA108 - Managerial Finance: Risk Analysis of CBA, Semester 1, 2019
VerifiedAdded on 2023/01/11
|22
|4173
|47
Report
AI Summary
This report presents a risk analysis of the Commonwealth Bank of Australia (CBA), evaluating its financial performance and investment potential. The report begins with an introduction to CBA, its history, global presence, and key personnel. It then reviews relevant literature on stock investments, risk, and return. The research question focuses on determining the risk and return of CBA to recommend investment strategies. The methodology involves analyzing secondary data, including monthly closing share prices of CBA and S&P.AX from 2005 to 2018, divided into two time periods for comparative analysis. The empirical analysis includes calculating average monthly returns, market capitalization, P/E ratios, and plotting share price histories and histograms. Standard deviation and variance are used to measure risk. The results section discusses estimated standard deviations, variance, and risk premiums. The report also discusses other factors affecting CBA, such as capital structure, legislative changes, competitive pressures, international events, major suppliers and customers, and management changes. The conclusion summarizes the findings and provides an overall assessment of CBA's risk profile and investment potential.
Running head: RISK ANALYSIS OF COMMONWEALTH BANK OF AUSTRALIA
Risk Analysis of Commonwealth Bank of Australia
Name of the Student:
Name of the University:
Author Note:
Risk Analysis of Commonwealth Bank of Australia
Name of the Student:
Name of the University:
Author Note:
Paraphrase This Document
Need a fresh take? Get an instant paraphrase of this document with our AI Paraphraser
RISK ANALYSIS OF COMMONWEALTH BANK OF AUSTRALIA
Table of Contents
Chapter 1: Introduction..............................................................................................................3
Chapter 2: Literature Review.....................................................................................................6
Chapter 3: Research Question....................................................................................................7
Chapter 4: Methodology............................................................................................................7
Chapter 5: Empirical Analysis...................................................................................................8
1. Monthly Return of CBA and S&P for the First Time.....................................................8
2. Monthly Return of CBA and S&P for the Second Time................................................8
3. Average monthly return, market capitalisation and P/E ratios of CBA for both period....9
3.1 Average monthly Return of CBA.AX for Both Period................................................9
3.2 Market capitalization and P/E ratios of CBA for the first period................................9
3.3 Market capitalization and P/E ratios of CBA for the second period..........................10
4. Line graphs plotting the share price history of CBA.AX and the S&P for both period. .10
4.1 The share price history of S&P for the first period....................................................10
4.2 The share price history of CBA.AX for the first period............................................11
4.3 The share price history of S&P for the second period...............................................11
4.4 The share price history of CBA.AX for the second period...................................12
5. Histograms of monthly returns of the Commonwealth Bank of Australia for both period
..............................................................................................................................................12
5.1 Histograms of monthly returns of the Commonwealth Bank of Australia for the first
period................................................................................................................................12
RISK ANALYSIS OF COMMONWEALTH BANK OF AUSTRALIA
5.2 Histograms of monthly returns of the Commonwealth Bank of Australia for the first
period................................................................................................................................13
Standard deviation as a predictor of risk..............................................................................13
Estimated Variance and standard deviations of CBA.AX and S&P for both the period.....13
β as a better measure of risk.................................................................................................14
Chapter 6: Results....................................................................................................................14
Discussion of estimated SD and Variance...........................................................................15
The risk measured by the SD...............................................................................................15
Explanation of Risk Premium through covariance of return from CBA and S&P..............15
Chapter 7: Discussion of other factors.....................................................................................15
Capital structure...................................................................................................................16
Legislative changes impacting the financial company.........................................................16
Competitive pressures..........................................................................................................16
International events..............................................................................................................16
Major suppliers and customers.............................................................................................17
Management and ownership changes...................................................................................17
Chapter 8: Conclusion..............................................................................................................17
Reference and bibliography.....................................................................................................19
⊘ This is a preview!⊘
Do you want full access?
Subscribe today to unlock all pages.
Trusted by 1+ million students worldwide
RISK ANALYSIS OF COMMONWEALTH BANK OF AUSTRALIA
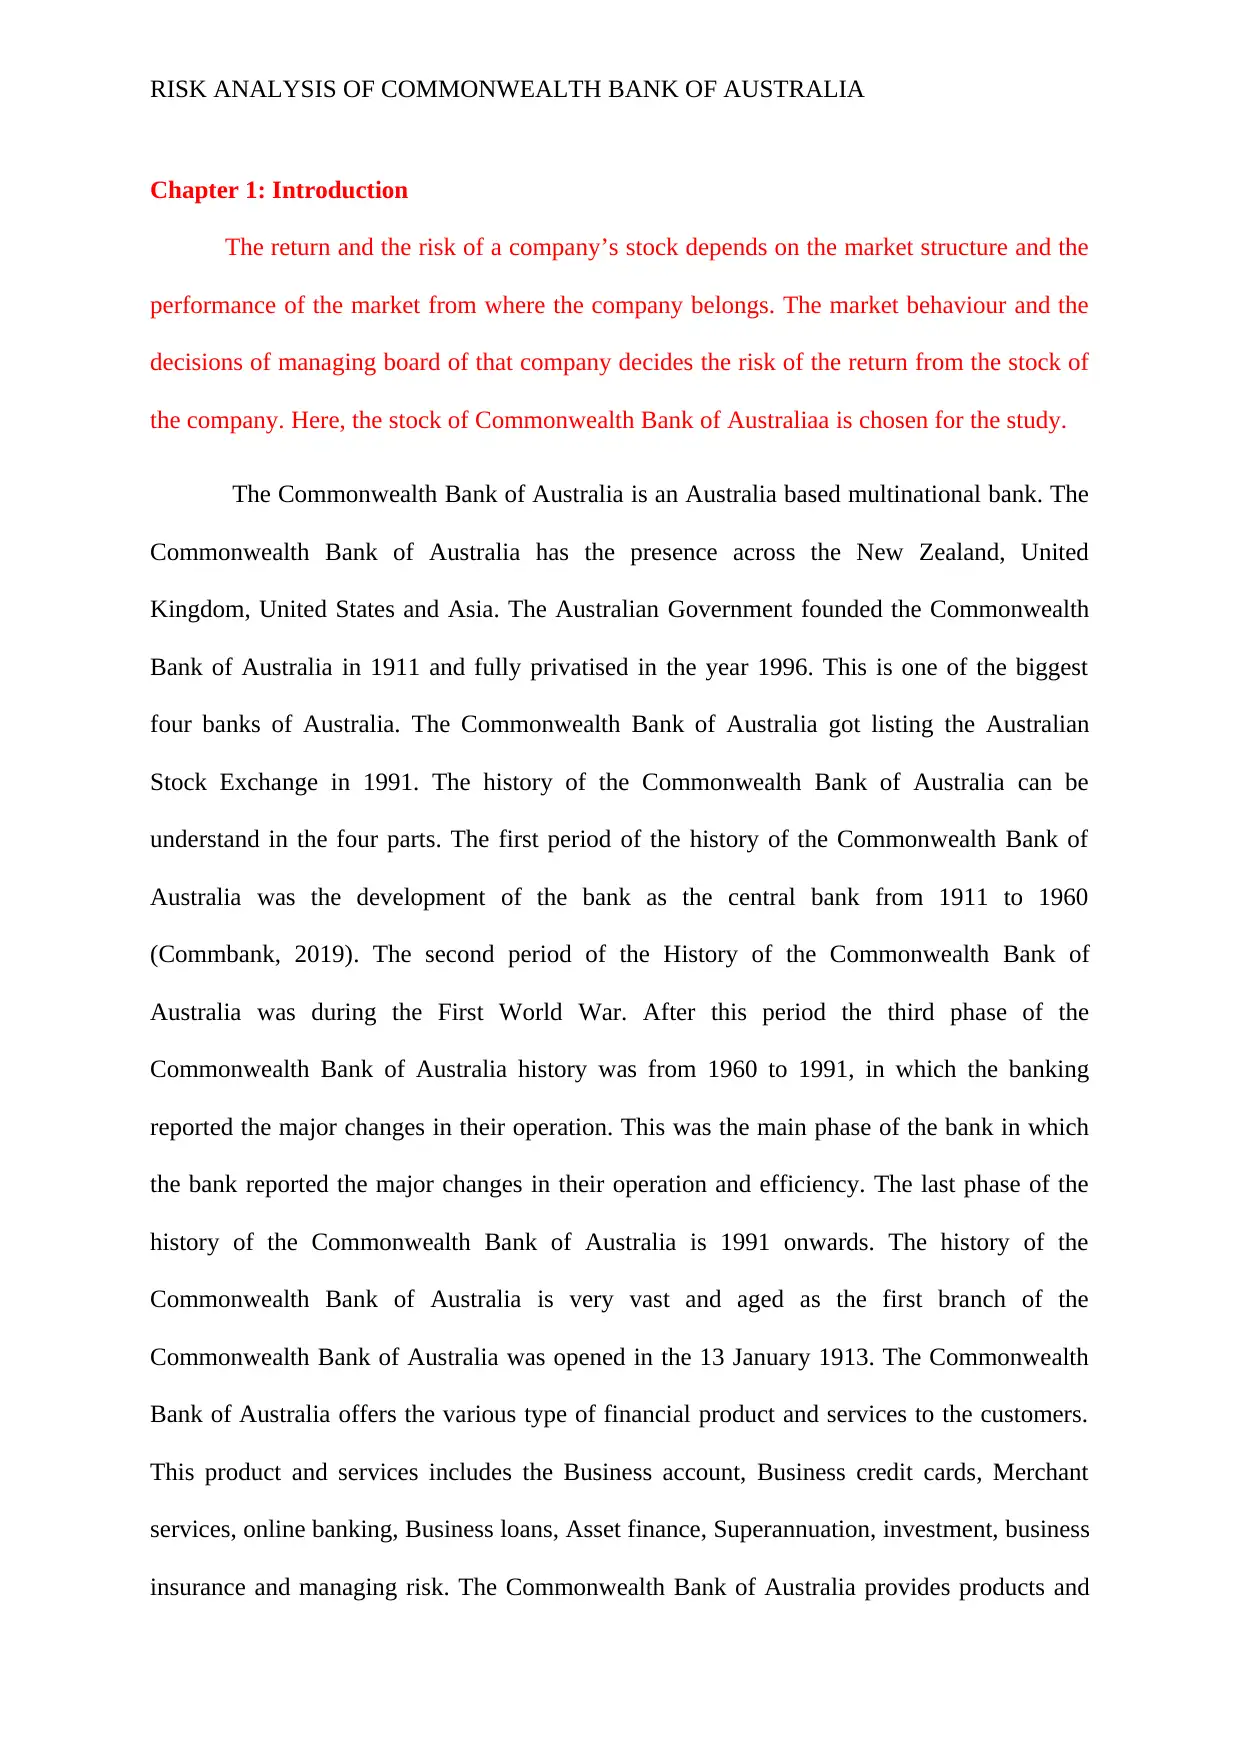
Chapter 1: Introduction
The return and the risk of a company’s stock depends on the market structure and the
performance of the market from where the company belongs. The market behaviour and the
decisions of managing board of that company decides the risk of the return from the stock of
the company. Here, the stock of Commonwealth Bank of Australiaa is chosen for the study.
The Commonwealth Bank of Australia is an Australia based multinational bank. The
Commonwealth Bank of Australia has the presence across the New Zealand, United
Kingdom, United States and Asia. The Australian Government founded the Commonwealth
Bank of Australia in 1911 and fully privatised in the year 1996. This is one of the biggest
four banks of Australia. The Commonwealth Bank of Australia got listing the Australian
Stock Exchange in 1991. The history of the Commonwealth Bank of Australia can be
understand in the four parts. The first period of the history of the Commonwealth Bank of
Australia was the development of the bank as the central bank from 1911 to 1960
(Commbank, 2019). The second period of the History of the Commonwealth Bank of
Australia was during the First World War. After this period the third phase of the
Commonwealth Bank of Australia history was from 1960 to 1991, in which the banking
reported the major changes in their operation. This was the main phase of the bank in which
the bank reported the major changes in their operation and efficiency. The last phase of the
history of the Commonwealth Bank of Australia is 1991 onwards. The history of the
Commonwealth Bank of Australia is very vast and aged as the first branch of the
Commonwealth Bank of Australia was opened in the 13 January 1913. The Commonwealth
Bank of Australia offers the various type of financial product and services to the customers.
This product and services includes the Business account, Business credit cards, Merchant
services, online banking, Business loans, Asset finance, Superannuation, investment, business
insurance and managing risk. The Commonwealth Bank of Australia provides products and
Paraphrase This Document
Need a fresh take? Get an instant paraphrase of this document with our AI Paraphraser
RISK ANALYSIS OF COMMONWEALTH BANK OF AUSTRALIA
services to their customers in the above mentioned category. In the above categories the bank
provides the various other services as well as the product. The bank have the entire banking
solution for their customers by offering the all types of the product and services to their
customers. The bank provides entire range of the banking and financial services and the
product starting from the basic saving account to advanced Superannuation product to their
customers including the services like risk management. The Commonwealth Bank of
Australia is based on the Australian and operates in the every state of Australia. The
Commonwealth Bank of Australia is a multinational bank and also operates in New Zealand,
Asia, Europe and North America. The bank have branches in Hong Kong, Indonesia, Japan,
Vietnam and Singapore along with the representative offices in China and India. The bank
has long history in Europe and provide specialist investment, advisory and financial services
to their European clients (Commbank, 2019). The Commonwealth Bank of Australia has the
New Zealand banking licence and operates in the entire market of New Zealand. Lastly, in
North America the Commonwealth Bank of Australia is located in the New York and
operates in entire North America. The Commonwealth Bank of Australia is the one major
bank out of the four biggest bank of the Australia. The global presence of the bank make it
one of the largest multination bank of Australia. The Board of Commonwealth Bank of
Australia consist the followings members and Directors: -
Catherine Livingstone AO is the Chairman of the Commonwealth Bank of Australia.
She is 62 years old and have degree of BA (Accounting) (Hons.), FCA, FTSE,
FAICD and FAA.
Matt Comyn is the Managing Director and Chief Executive Officer of the
Commonwealth Bank of Australia. He is 42 years old and hold the degrees of BAv
(UNSW), Mcom (UNSW), EMBA (USyd), GMP (HBS).
RISK ANALYSIS OF COMMONWEALTH BANK OF AUSTRALIA
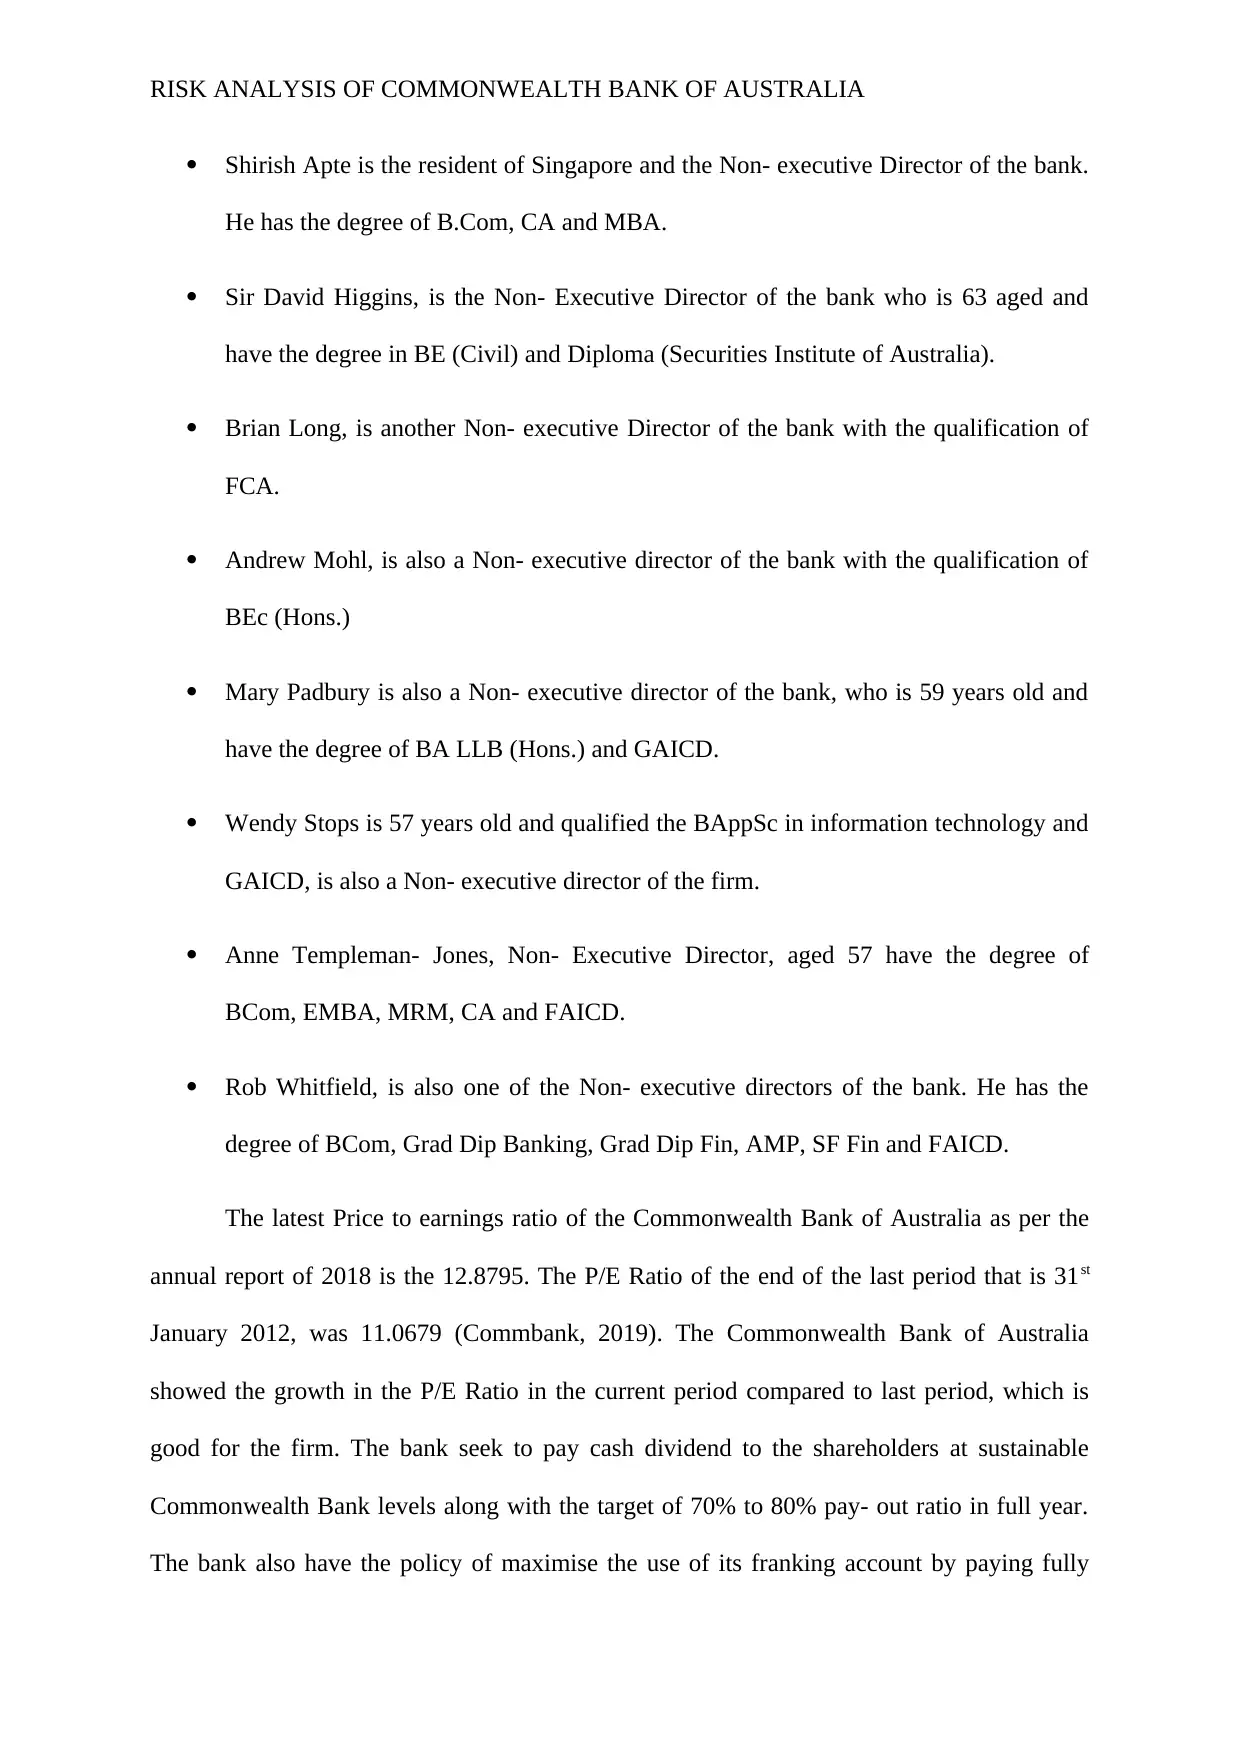
Shirish Apte is the resident of Singapore and the Non- executive Director of the bank.
He has the degree of B.Com, CA and MBA.
Sir David Higgins, is the Non- Executive Director of the bank who is 63 aged and
have the degree in BE (Civil) and Diploma (Securities Institute of Australia).
Brian Long, is another Non- executive Director of the bank with the qualification of
FCA.
Andrew Mohl, is also a Non- executive director of the bank with the qualification of
BEc (Hons.)
Mary Padbury is also a Non- executive director of the bank, who is 59 years old and
have the degree of BA LLB (Hons.) and GAICD.
Wendy Stops is 57 years old and qualified the BAppSc in information technology and
GAICD, is also a Non- executive director of the firm.
Anne Templeman- Jones, Non- Executive Director, aged 57 have the degree of
BCom, EMBA, MRM, CA and FAICD.
Rob Whitfield, is also one of the Non- executive directors of the bank. He has the
degree of BCom, Grad Dip Banking, Grad Dip Fin, AMP, SF Fin and FAICD.
The latest Price to earnings ratio of the Commonwealth Bank of Australia as per the
annual report of 2018 is the 12.8795. The P/E Ratio of the end of the last period that is 31st
January 2012, was 11.0679 (Commbank, 2019). The Commonwealth Bank of Australia
showed the growth in the P/E Ratio in the current period compared to last period, which is
good for the firm. The bank seek to pay cash dividend to the shareholders at sustainable
Commonwealth Bank levels along with the target of 70% to 80% pay- out ratio in full year.
The bank also have the policy of maximise the use of its franking account by paying fully
⊘ This is a preview!⊘
Do you want full access?
Subscribe today to unlock all pages.
Trusted by 1+ million students worldwide
RISK ANALYSIS OF COMMONWEALTH BANK OF AUSTRALIA
franked dividends. The environment policy of the Commonwealth Bank of Australia states
that the bank is the part of the Federal Government’s National Greenhouse and Energy
Reporting scheme. Hence, it is mandate for the bank to report their greenhouse emission,
energy production and energy consumption in the annual basis. The company also have the
several policies for controlling their impact in the environments.
Chapter 2: Literature Review
The studies that discusses about the stock investments found that it measures about
the risk and return from the stocks for investment. The volatility of the market is estimated
with accuracy over a time range by the researchers by using the standard deviation and
covariance analysis (Syriopoulos, Makram & Boubaker, 2015). In this research, the analysis
uses the secondary data and discovers that the market volatility and the proportional
ownership are correlated (Goddard, Kita & Wang, 2015). P/E ratio, EPS and derivate are the
major factors that can identify the risk of the stocks and can predict the return. These papers
also discuss about the recent development and growth and major internal and external
changes. These includes the dividend, changes in managing board of director, legislative
changes and the international events
The capital structure of the bank is consist of the $ 37533 million of ordinary share
capital and the public borrowings of the $ 566200 million along with the loan capital of $
22249 million. The Commonwealth Bank of Australia showed the growth in the P/E Ratio in
the current period compared to last period, which is good for the firm. The bank seek to pay
cash dividend to the shareholders at sustainable Commonwealth Bank levels along with the
target of 70% to 80% pay- out ratio in full year.
Paraphrase This Document
Need a fresh take? Get an instant paraphrase of this document with our AI Paraphraser
RISK ANALYSIS OF COMMONWEALTH BANK OF AUSTRALIA
Chapter 3: Research Question
The Commonwealth Bank of Australia listed in S&P.AX is chosen for the risk and
return analysis. This is a descriptive study which discusses the banks current financial status,
capital structure, legislative changes, competitive pressure and major suppliers and customers
to recommend whether to invest or not in the stocks of COMMONWEALTH BANK. Hence,
the aim of the study is to find the risk and return of the Commonwealth Bank to recommend
investment depending on the development and growth of the company.
Chapter 4: Methodology
The study collects secondary data of S&P.AX and COMMONWEALTH BANK
monthly closing share prices from 2005 to 2018 and collected from the Yahoo finance
(Yahoo is now a part of Oath, 2019). The data is used to calculate the average return and risk
premium of COMMONWEALTH BANK stocks in the Australian stock market. The data is
divided in two time periods for comparing the growth of the financial stock return of the
company. First time period starts from 2 February, 2005 to 1 February, 2012 and second time
period starts from 2 February, 20012 to 1 February, 2019.
RISK ANALYSIS OF COMMONWEALTH BANK OF AUSTRALIA
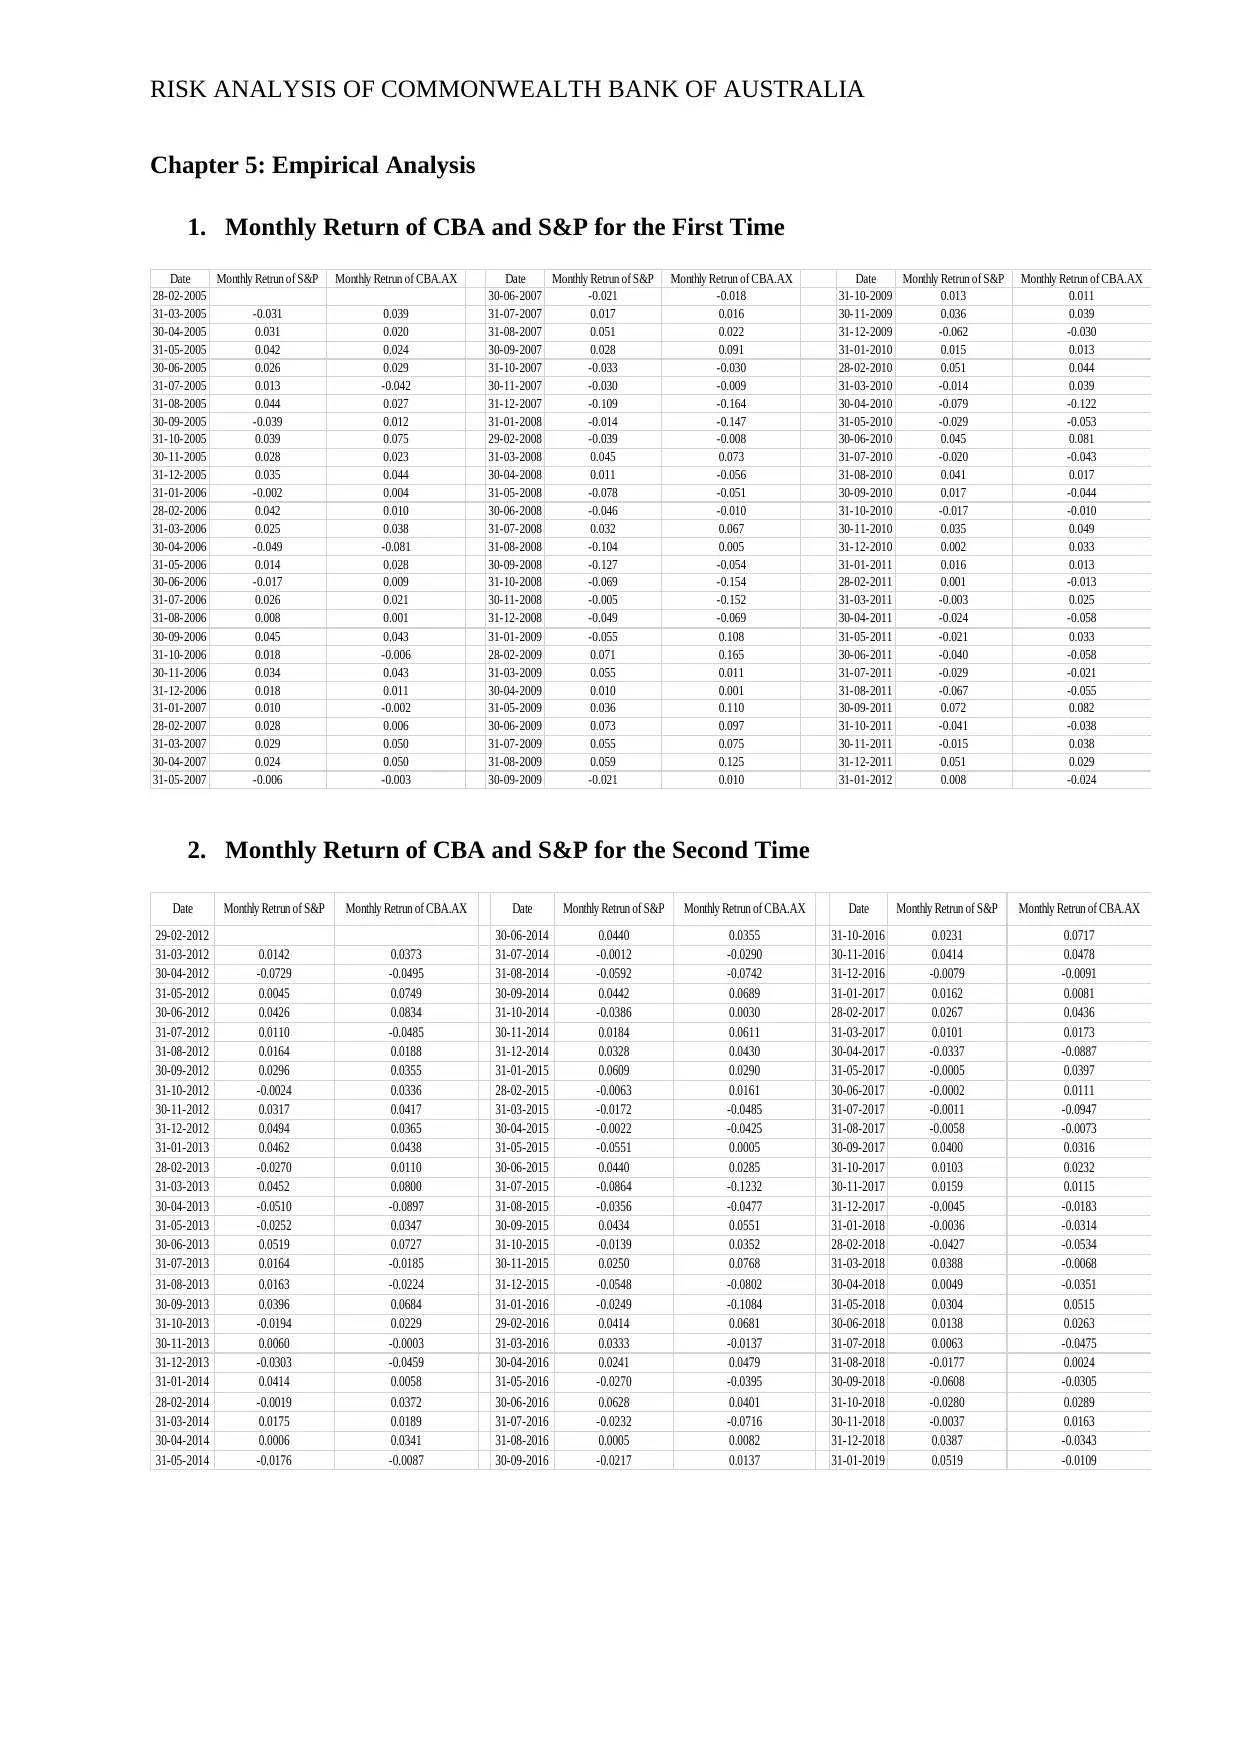
Chapter 5: Empirical Analysis
1. Monthly Return of CBA and S&P for the First Time
Date Monthly Retrun of S&P Monthly Retrun of CBA.AX Date Monthly Retrun of S&P Monthly Retrun of CBA.AX Date Monthly Retrun of S&P Monthly Retrun of CBA.AX
28-02-2005 30-06-2007 -0.021 -0.018 31-10-2009 0.013 0.011
31-03-2005 -0.031 0.039 31-07-2007 0.017 0.016 30-11-2009 0.036 0.039
30-04-2005 0.031 0.020 31-08-2007 0.051 0.022 31-12-2009 -0.062 -0.030
31-05-2005 0.042 0.024 30-09-2007 0.028 0.091 31-01-2010 0.015 0.013
30-06-2005 0.026 0.029 31-10-2007 -0.033 -0.030 28-02-2010 0.051 0.044
31-07-2005 0.013 -0.042 30-11-2007 -0.030 -0.009 31-03-2010 -0.014 0.039
31-08-2005 0.044 0.027 31-12-2007 -0.109 -0.164 30-04-2010 -0.079 -0.122
30-09-2005 -0.039 0.012 31-01-2008 -0.014 -0.147 31-05-2010 -0.029 -0.053
31-10-2005 0.039 0.075 29-02-2008 -0.039 -0.008 30-06-2010 0.045 0.081
30-11-2005 0.028 0.023 31-03-2008 0.045 0.073 31-07-2010 -0.020 -0.043
31-12-2005 0.035 0.044 30-04-2008 0.011 -0.056 31-08-2010 0.041 0.017
31-01-2006 -0.002 0.004 31-05-2008 -0.078 -0.051 30-09-2010 0.017 -0.044
28-02-2006 0.042 0.010 30-06-2008 -0.046 -0.010 31-10-2010 -0.017 -0.010
31-03-2006 0.025 0.038 31-07-2008 0.032 0.067 30-11-2010 0.035 0.049
30-04-2006 -0.049 -0.081 31-08-2008 -0.104 0.005 31-12-2010 0.002 0.033
31-05-2006 0.014 0.028 30-09-2008 -0.127 -0.054 31-01-2011 0.016 0.013
30-06-2006 -0.017 0.009 31-10-2008 -0.069 -0.154 28-02-2011 0.001 -0.013
31-07-2006 0.026 0.021 30-11-2008 -0.005 -0.152 31-03-2011 -0.003 0.025
31-08-2006 0.008 0.001 31-12-2008 -0.049 -0.069 30-04-2011 -0.024 -0.058
30-09-2006 0.045 0.043 31-01-2009 -0.055 0.108 31-05-2011 -0.021 0.033
31-10-2006 0.018 -0.006 28-02-2009 0.071 0.165 30-06-2011 -0.040 -0.058
30-11-2006 0.034 0.043 31-03-2009 0.055 0.011 31-07-2011 -0.029 -0.021
31-12-2006 0.018 0.011 30-04-2009 0.010 0.001 31-08-2011 -0.067 -0.055
31-01-2007 0.010 -0.002 31-05-2009 0.036 0.110 30-09-2011 0.072 0.082
28-02-2007 0.028 0.006 30-06-2009 0.073 0.097 31-10-2011 -0.041 -0.038
31-03-2007 0.029 0.050 31-07-2009 0.055 0.075 30-11-2011 -0.015 0.038
30-04-2007 0.024 0.050 31-08-2009 0.059 0.125 31-12-2011 0.051 0.029
31-05-2007 -0.006 -0.003 30-09-2009 -0.021 0.010 31-01-2012 0.008 -0.024
2. Monthly Return of CBA and S&P for the Second Time
Date Monthly Retrun of S&P Monthly Retrun of CBA.AX Date Monthly Retrun of S&P Monthly Retrun of CBA.AX Date Monthly Retrun of S&P Monthly Retrun of CBA.AX
29-02-2012 30-06-2014 0.0440 0.0355 31-10-2016 0.0231 0.0717
31-03-2012 0.0142 0.0373 31-07-2014 -0.0012 -0.0290 30-11-2016 0.0414 0.0478
30-04-2012 -0.0729 -0.0495 31-08-2014 -0.0592 -0.0742 31-12-2016 -0.0079 -0.0091
31-05-2012 0.0045 0.0749 30-09-2014 0.0442 0.0689 31-01-2017 0.0162 0.0081
30-06-2012 0.0426 0.0834 31-10-2014 -0.0386 0.0030 28-02-2017 0.0267 0.0436
31-07-2012 0.0110 -0.0485 30-11-2014 0.0184 0.0611 31-03-2017 0.0101 0.0173
31-08-2012 0.0164 0.0188 31-12-2014 0.0328 0.0430 30-04-2017 -0.0337 -0.0887
30-09-2012 0.0296 0.0355 31-01-2015 0.0609 0.0290 31-05-2017 -0.0005 0.0397
31-10-2012 -0.0024 0.0336 28-02-2015 -0.0063 0.0161 30-06-2017 -0.0002 0.0111
30-11-2012 0.0317 0.0417 31-03-2015 -0.0172 -0.0485 31-07-2017 -0.0011 -0.0947
31-12-2012 0.0494 0.0365 30-04-2015 -0.0022 -0.0425 31-08-2017 -0.0058 -0.0073
31-01-2013 0.0462 0.0438 31-05-2015 -0.0551 0.0005 30-09-2017 0.0400 0.0316
28-02-2013 -0.0270 0.0110 30-06-2015 0.0440 0.0285 31-10-2017 0.0103 0.0232
31-03-2013 0.0452 0.0800 31-07-2015 -0.0864 -0.1232 30-11-2017 0.0159 0.0115
30-04-2013 -0.0510 -0.0897 31-08-2015 -0.0356 -0.0477 31-12-2017 -0.0045 -0.0183
31-05-2013 -0.0252 0.0347 30-09-2015 0.0434 0.0551 31-01-2018 -0.0036 -0.0314
30-06-2013 0.0519 0.0727 31-10-2015 -0.0139 0.0352 28-02-2018 -0.0427 -0.0534
31-07-2013 0.0164 -0.0185 30-11-2015 0.0250 0.0768 31-03-2018 0.0388 -0.0068
31-08-2013 0.0163 -0.0224 31-12-2015 -0.0548 -0.0802 30-04-2018 0.0049 -0.0351
30-09-2013 0.0396 0.0684 31-01-2016 -0.0249 -0.1084 31-05-2018 0.0304 0.0515
31-10-2013 -0.0194 0.0229 29-02-2016 0.0414 0.0681 30-06-2018 0.0138 0.0263
30-11-2013 0.0060 -0.0003 31-03-2016 0.0333 -0.0137 31-07-2018 0.0063 -0.0475
31-12-2013 -0.0303 -0.0459 30-04-2016 0.0241 0.0479 31-08-2018 -0.0177 0.0024
31-01-2014 0.0414 0.0058 31-05-2016 -0.0270 -0.0395 30-09-2018 -0.0608 -0.0305
28-02-2014 -0.0019 0.0372 30-06-2016 0.0628 0.0401 31-10-2018 -0.0280 0.0289
31-03-2014 0.0175 0.0189 31-07-2016 -0.0232 -0.0716 30-11-2018 -0.0037 0.0163
30-04-2014 0.0006 0.0341 31-08-2016 0.0005 0.0082 31-12-2018 0.0387 -0.0343
31-05-2014 -0.0176 -0.0087 30-09-2016 -0.0217 0.0137 31-01-2019 0.0519 -0.0109
⊘ This is a preview!⊘
Do you want full access?
Subscribe today to unlock all pages.
Trusted by 1+ million students worldwide
RISK ANALYSIS OF COMMONWEALTH BANK OF AUSTRALIA
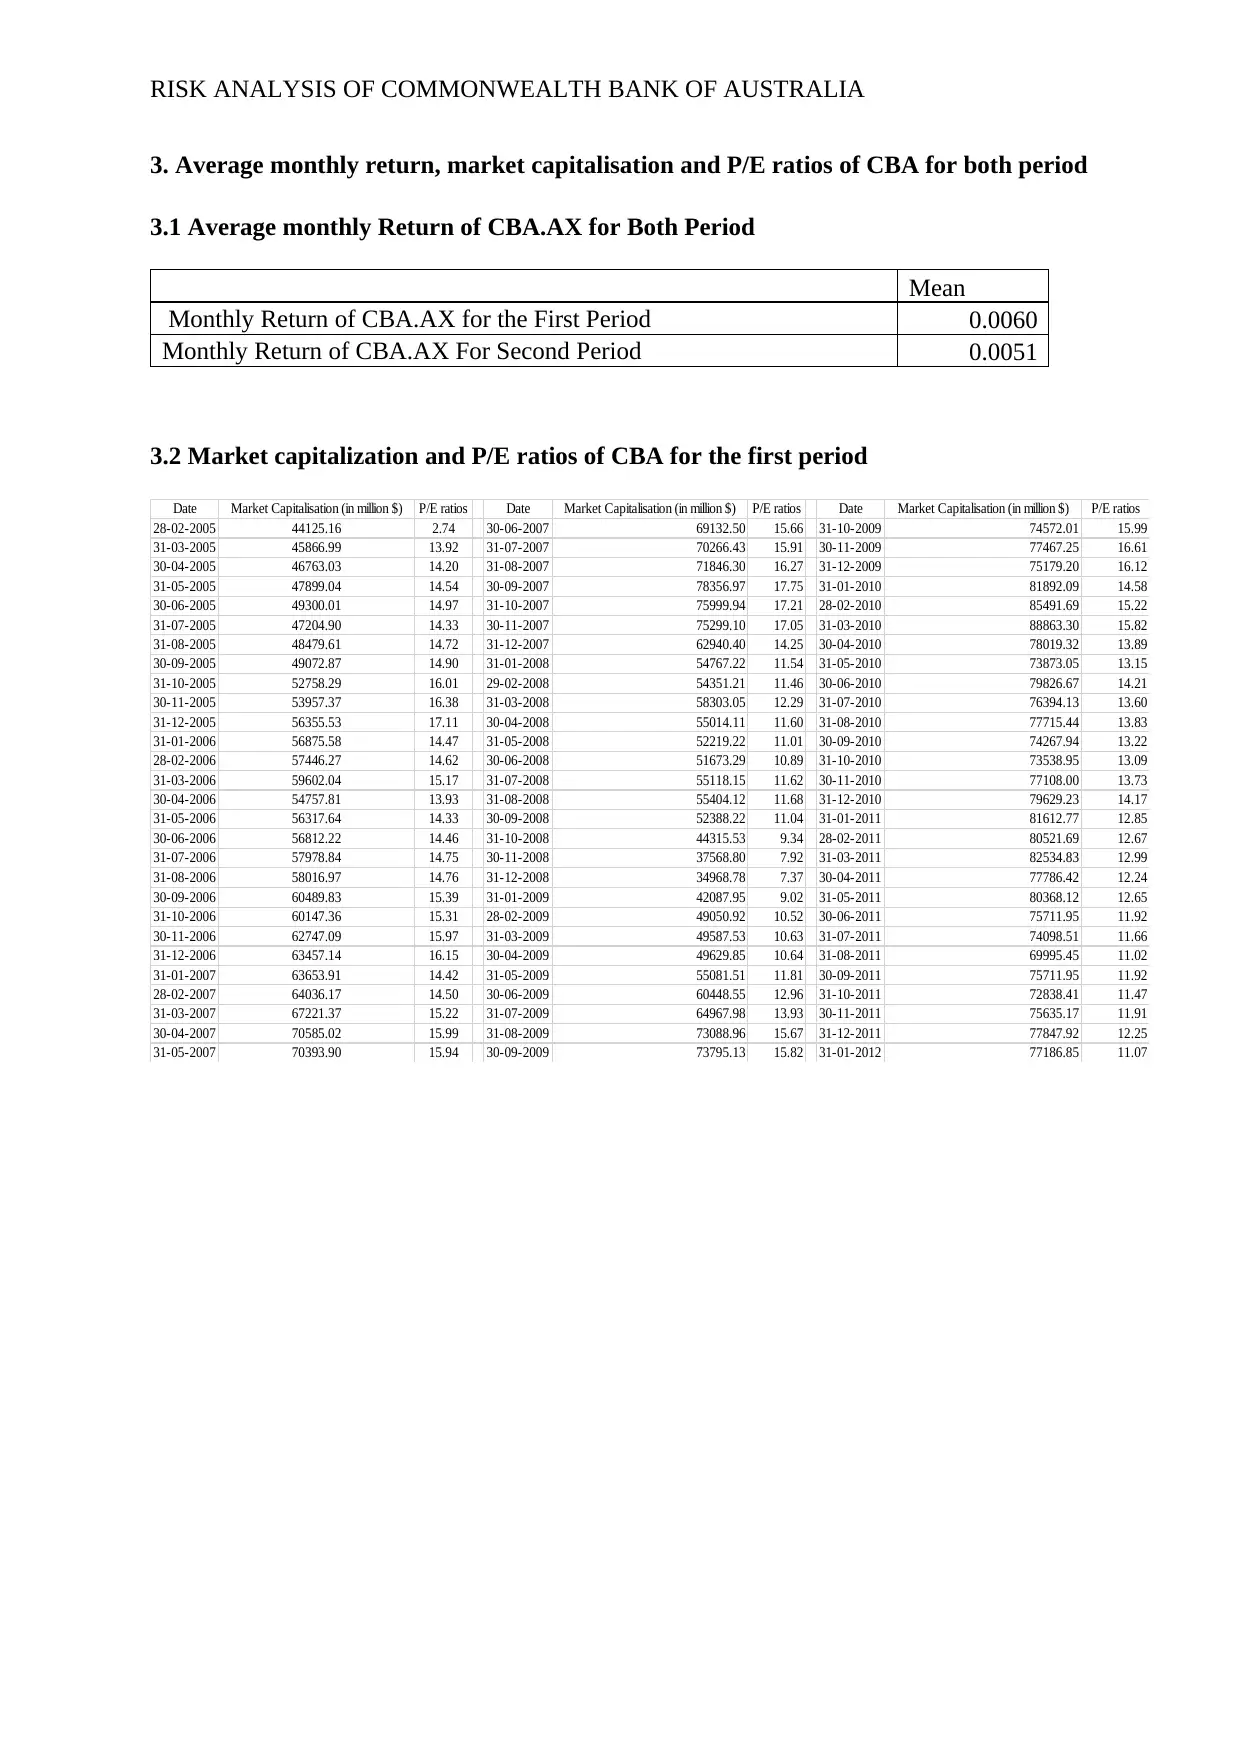
3. Average monthly return, market capitalisation and P/E ratios of CBA for both period
3.1 Average monthly Return of CBA.AX for Both Period
Mean
Monthly Return of CBA.AX for the First Period 0.0060
Monthly Return of CBA.AX For Second Period 0.0051
3.2 Market capitalization and P/E ratios of CBA for the first period
Date Market Capitalisation (in million $) P/E ratios Date Market Capitalisation (in million $) P/E ratios Date Market Capitalisation (in million $) P/E ratios
28-02-2005 44125.16 2.74 30-06-2007 69132.50 15.66 31-10-2009 74572.01 15.99
31-03-2005 45866.99 13.92 31-07-2007 70266.43 15.91 30-11-2009 77467.25 16.61
30-04-2005 46763.03 14.20 31-08-2007 71846.30 16.27 31-12-2009 75179.20 16.12
31-05-2005 47899.04 14.54 30-09-2007 78356.97 17.75 31-01-2010 81892.09 14.58
30-06-2005 49300.01 14.97 31-10-2007 75999.94 17.21 28-02-2010 85491.69 15.22
31-07-2005 47204.90 14.33 30-11-2007 75299.10 17.05 31-03-2010 88863.30 15.82
31-08-2005 48479.61 14.72 31-12-2007 62940.40 14.25 30-04-2010 78019.32 13.89
30-09-2005 49072.87 14.90 31-01-2008 54767.22 11.54 31-05-2010 73873.05 13.15
31-10-2005 52758.29 16.01 29-02-2008 54351.21 11.46 30-06-2010 79826.67 14.21
30-11-2005 53957.37 16.38 31-03-2008 58303.05 12.29 31-07-2010 76394.13 13.60
31-12-2005 56355.53 17.11 30-04-2008 55014.11 11.60 31-08-2010 77715.44 13.83
31-01-2006 56875.58 14.47 31-05-2008 52219.22 11.01 30-09-2010 74267.94 13.22
28-02-2006 57446.27 14.62 30-06-2008 51673.29 10.89 31-10-2010 73538.95 13.09
31-03-2006 59602.04 15.17 31-07-2008 55118.15 11.62 30-11-2010 77108.00 13.73
30-04-2006 54757.81 13.93 31-08-2008 55404.12 11.68 31-12-2010 79629.23 14.17
31-05-2006 56317.64 14.33 30-09-2008 52388.22 11.04 31-01-2011 81612.77 12.85
30-06-2006 56812.22 14.46 31-10-2008 44315.53 9.34 28-02-2011 80521.69 12.67
31-07-2006 57978.84 14.75 30-11-2008 37568.80 7.92 31-03-2011 82534.83 12.99
31-08-2006 58016.97 14.76 31-12-2008 34968.78 7.37 30-04-2011 77786.42 12.24
30-09-2006 60489.83 15.39 31-01-2009 42087.95 9.02 31-05-2011 80368.12 12.65
31-10-2006 60147.36 15.31 28-02-2009 49050.92 10.52 30-06-2011 75711.95 11.92
30-11-2006 62747.09 15.97 31-03-2009 49587.53 10.63 31-07-2011 74098.51 11.66
31-12-2006 63457.14 16.15 30-04-2009 49629.85 10.64 31-08-2011 69995.45 11.02
31-01-2007 63653.91 14.42 31-05-2009 55081.51 11.81 30-09-2011 75711.95 11.92
28-02-2007 64036.17 14.50 30-06-2009 60448.55 12.96 31-10-2011 72838.41 11.47
31-03-2007 67221.37 15.22 31-07-2009 64967.98 13.93 30-11-2011 75635.17 11.91
30-04-2007 70585.02 15.99 31-08-2009 73088.96 15.67 31-12-2011 77847.92 12.25
31-05-2007 70393.90 15.94 30-09-2009 73795.13 15.82 31-01-2012 77186.85 11.07
Paraphrase This Document
Need a fresh take? Get an instant paraphrase of this document with our AI Paraphraser
RISK ANALYSIS OF COMMONWEALTH BANK OF AUSTRALIA
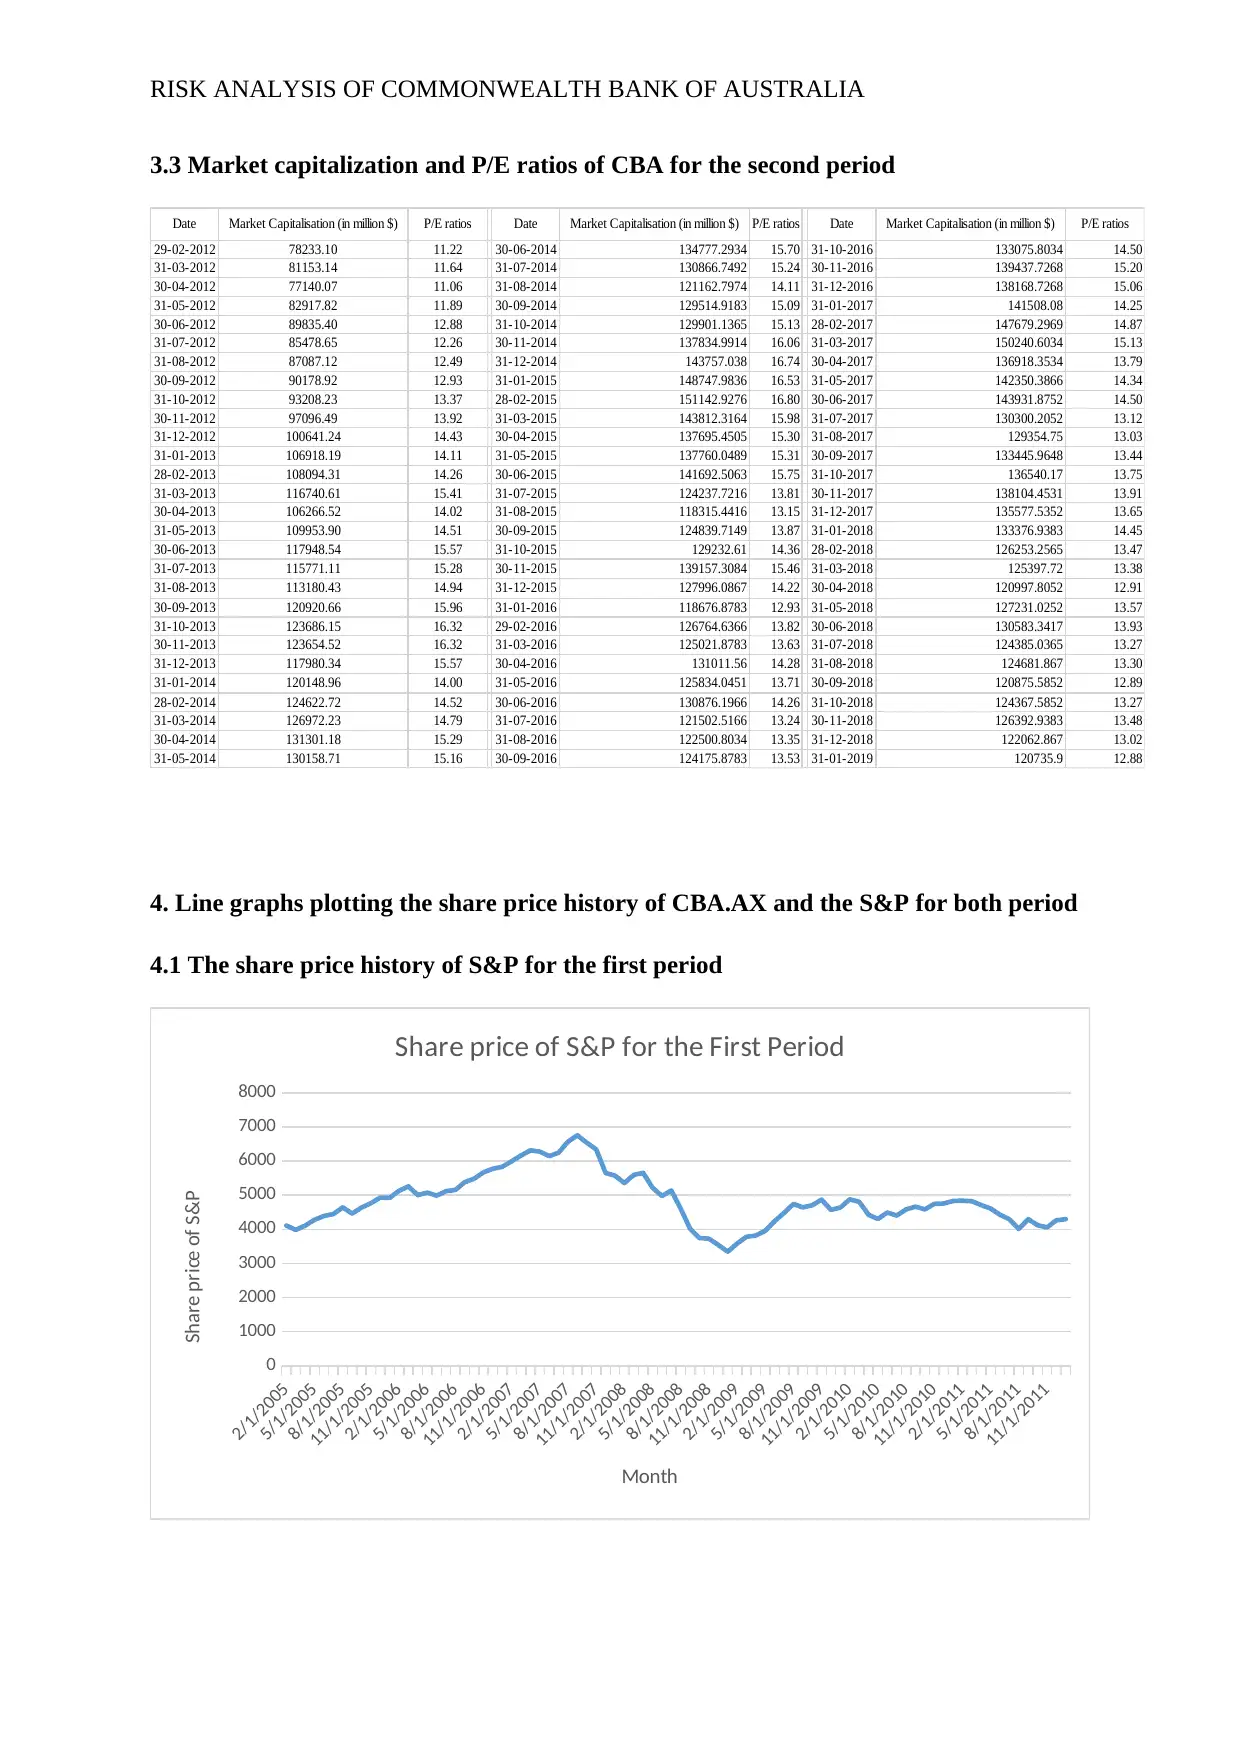
3.3 Market capitalization and P/E ratios of CBA for the second period
Date Market Capitalisation (in million $) P/E ratios Date Market Capitalisation (in million $) P/E ratios Date Market Capitalisation (in million $) P/E ratios
29-02-2012 78233.10 11.22 30-06-2014 134777.2934 15.70 31-10-2016 133075.8034 14.50
31-03-2012 81153.14 11.64 31-07-2014 130866.7492 15.24 30-11-2016 139437.7268 15.20
30-04-2012 77140.07 11.06 31-08-2014 121162.7974 14.11 31-12-2016 138168.7268 15.06
31-05-2012 82917.82 11.89 30-09-2014 129514.9183 15.09 31-01-2017 141508.08 14.25
30-06-2012 89835.40 12.88 31-10-2014 129901.1365 15.13 28-02-2017 147679.2969 14.87
31-07-2012 85478.65 12.26 30-11-2014 137834.9914 16.06 31-03-2017 150240.6034 15.13
31-08-2012 87087.12 12.49 31-12-2014 143757.038 16.74 30-04-2017 136918.3534 13.79
30-09-2012 90178.92 12.93 31-01-2015 148747.9836 16.53 31-05-2017 142350.3866 14.34
31-10-2012 93208.23 13.37 28-02-2015 151142.9276 16.80 30-06-2017 143931.8752 14.50
30-11-2012 97096.49 13.92 31-03-2015 143812.3164 15.98 31-07-2017 130300.2052 13.12
31-12-2012 100641.24 14.43 30-04-2015 137695.4505 15.30 31-08-2017 129354.75 13.03
31-01-2013 106918.19 14.11 31-05-2015 137760.0489 15.31 30-09-2017 133445.9648 13.44
28-02-2013 108094.31 14.26 30-06-2015 141692.5063 15.75 31-10-2017 136540.17 13.75
31-03-2013 116740.61 15.41 31-07-2015 124237.7216 13.81 30-11-2017 138104.4531 13.91
30-04-2013 106266.52 14.02 31-08-2015 118315.4416 13.15 31-12-2017 135577.5352 13.65
31-05-2013 109953.90 14.51 30-09-2015 124839.7149 13.87 31-01-2018 133376.9383 14.45
30-06-2013 117948.54 15.57 31-10-2015 129232.61 14.36 28-02-2018 126253.2565 13.47
31-07-2013 115771.11 15.28 30-11-2015 139157.3084 15.46 31-03-2018 125397.72 13.38
31-08-2013 113180.43 14.94 31-12-2015 127996.0867 14.22 30-04-2018 120997.8052 12.91
30-09-2013 120920.66 15.96 31-01-2016 118676.8783 12.93 31-05-2018 127231.0252 13.57
31-10-2013 123686.15 16.32 29-02-2016 126764.6366 13.82 30-06-2018 130583.3417 13.93
30-11-2013 123654.52 16.32 31-03-2016 125021.8783 13.63 31-07-2018 124385.0365 13.27
31-12-2013 117980.34 15.57 30-04-2016 131011.56 14.28 31-08-2018 124681.867 13.30
31-01-2014 120148.96 14.00 31-05-2016 125834.0451 13.71 30-09-2018 120875.5852 12.89
28-02-2014 124622.72 14.52 30-06-2016 130876.1966 14.26 31-10-2018 124367.5852 13.27
31-03-2014 126972.23 14.79 31-07-2016 121502.5166 13.24 30-11-2018 126392.9383 13.48
30-04-2014 131301.18 15.29 31-08-2016 122500.8034 13.35 31-12-2018 122062.867 13.02
31-05-2014 130158.71 15.16 30-09-2016 124175.8783 13.53 31-01-2019 120735.9 12.88
4. Line graphs plotting the share price history of CBA.AX and the S&P for both period
4.1 The share price history of S&P for the first period
2/1/2005
5/1/2005
8/1/2005
11/1/2005
2/1/2006
5/1/2006
8/1/2006
11/1/2006
2/1/2007
5/1/2007
8/1/2007
11/1/2007
2/1/2008
5/1/2008
8/1/2008
11/1/2008
2/1/2009
5/1/2009
8/1/2009
11/1/2009
2/1/2010
5/1/2010
8/1/2010
11/1/2010
2/1/2011
5/1/2011
8/1/2011
11/1/2011
0
1000
2000
3000
4000
5000
6000
7000
8000
Share price of S&P for the First Period
Month
Share price of S&P
RISK ANALYSIS OF COMMONWEALTH BANK OF AUSTRALIA
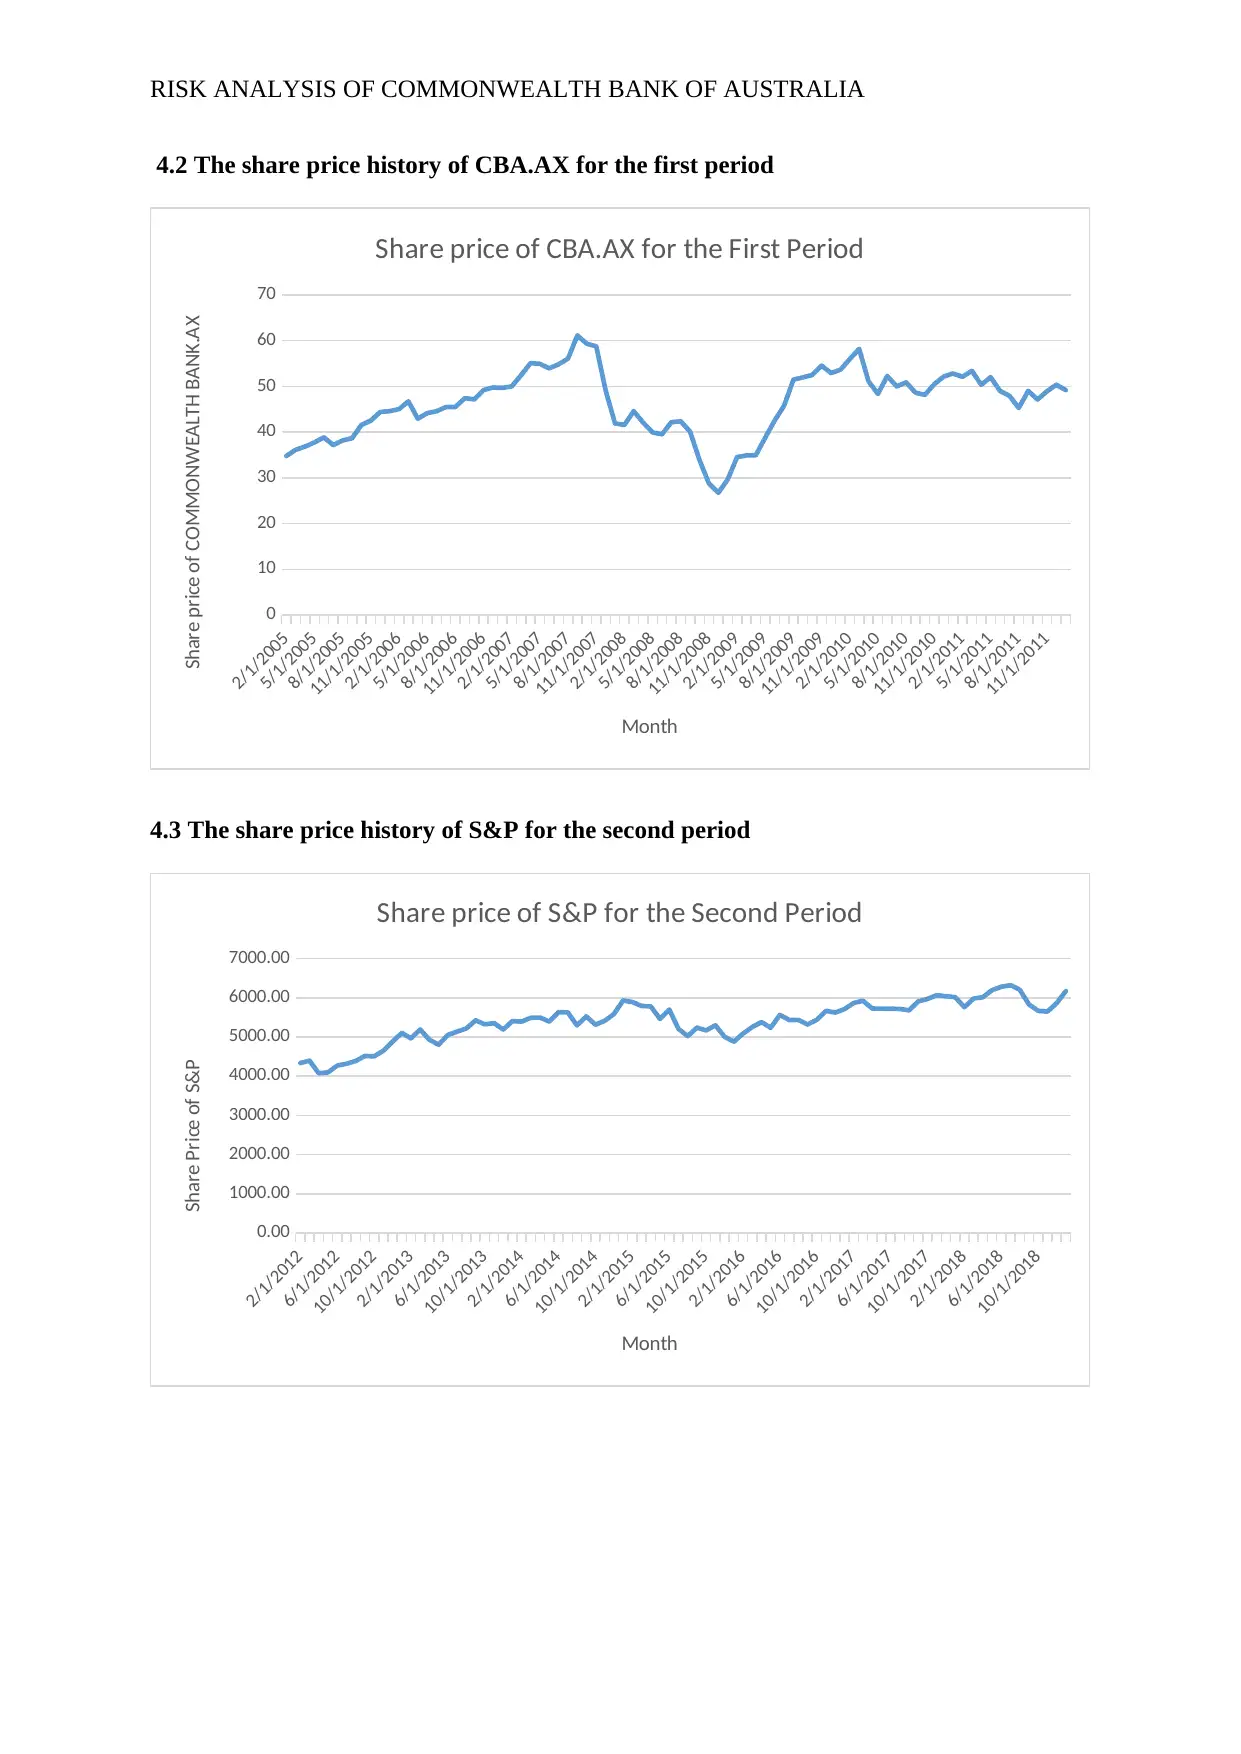
4.2 The share price history of CBA.AX for the first period
2/1/2005
5/1/2005
8/1/2005
11/1/2005
2/1/2006
5/1/2006
8/1/2006
11/1/2006
2/1/2007
5/1/2007
8/1/2007
11/1/2007
2/1/2008
5/1/2008
8/1/2008
11/1/2008
2/1/2009
5/1/2009
8/1/2009
11/1/2009
2/1/2010
5/1/2010
8/1/2010
11/1/2010
2/1/2011
5/1/2011
8/1/2011
11/1/2011
0
10
20
30
40
50
60
70
Share price of CBA.AX for the First Period
Month
Share price of COMMONWEALTH BANK.AX
4.3 The share price history of S&P for the second period
2/1/2012
6/1/2012
10/1/2012
2/1/2013
6/1/2013
10/1/2013
2/1/2014
6/1/2014
10/1/2014
2/1/2015
6/1/2015
10/1/2015
2/1/2016
6/1/2016
10/1/2016
2/1/2017
6/1/2017
10/1/2017
2/1/2018
6/1/2018
10/1/2018
0.00
1000.00
2000.00
3000.00
4000.00
5000.00
6000.00
7000.00
Share price of S&P for the Second Period
Month
Share Price of S&P
⊘ This is a preview!⊘
Do you want full access?
Subscribe today to unlock all pages.
Trusted by 1+ million students worldwide
1 out of 22
Related Documents


Your All-in-One AI-Powered Toolkit for Academic Success.
+13062052269
info@desklib.com
Available 24*7 on WhatsApp / Email
![[object Object]](/_next/static/media/star-bottom.7253800d.svg)
Unlock your academic potential
Copyright © 2020–2026 A2Z Services. All Rights Reserved. Developed and managed by ZUCOL.