Spectroscopy and Analytical Chemistry (CHM2922) - Lab Reports

Verified

Added on  2023/08/09

|66
|17238
|363
AI Summary
This document provides lab reports for the Spectroscopy and Analytical Chemistry course (CHM2922) at Monash University, Malaysia Campus. It includes information on the experiment, instrument used, procedures, results, and calculations. Download now!

Contribute Materials

Your contribution can guide someone’s learning journey. Share your documents today.
Document Page
Spectroscopy and Analytical
Chemistry (CHM2922) - Lab Reports
Chemistry
Monash University, Malaysia Campus
65 pag.

Secure Best Marks with AI Grader

Need help grading? Try our AI Grader for instant feedback on your assignments.
Document Page
Spectroscopy and
Analytical Chemistry
(CHM2922) – Lab
Reports
Document Page
Intentional plagiarism or collusion amounts to cheating under Monash UniversityStatute 4.1
Student Discipline.
Plagiarism:Plagiarismmeanstotakeanduseanotherperson’sideasandormannerofexpressingthemandt
opasstheseofas one’s own by failing to give appropriate acknowledgement, including the use of
material from any source, staf, students ortheinternet, published and unpublishedworks.
Collusion: Collusion means unauthorised collaboration on assessable written, oral or practical work
with another person.
Where there are reasonable grounds for believing that intentional plagiarism or collusion has
occurred, this will be reported to the Associate Dean (Education) or nominee, who may disallow the
work concerned by prohibiting assessment or refer the matter to the Faculty Discipline Panel for a
SCHOOL OF SCIENCE
ASSESSMENT COVER
SHEET
Student’s name (Surname)
Amran (Given names)
Nuramira Batrisyia
ID number 27467236 Phone
Unit name Spectroscopy and Analytical
Chemistry
Unit code CHM2922
t
Note: If this is a group assignment, please include the names of all other group members.
Title of
assignment
Experiment 1: Gas Chromatography - Measuring the Alcohol Content
of Wine
Lecturer/tutor Assoc Prof Dr Lim Yau Yan
Is this an authorisedgroup assignment? Yes No
Has any part of this assignment been previously submitted as part
ofanotherunit/course? Yes No
Tutorial/laboratory day &
time
Tuesday, 2PM
Due date Tuesday, 2PM Date submitted T u e s d a y
All work must be submitted by the due date. If an extension of work is granted this must be specifed
with the signature of the lecturer/tutor.
Extension granted until(date)................................ Signature of
lecturer/tutor.................................................
Please note that it is your responsibility to retain copies of your assessments.
Student Statement:
I have read the university’s Student Academic IntegrityPolicyandProcedures.
I understand the consequences of engaging in plagiarism and collusion as described
Document Page
Privacy Statement
The information on this form is collected for the primary purpose of assessing your assignment and ensuring the
academic integrity requirements of the University are met. Other purposes of collection include recording your
plagiarism and collusion declaration, attending to course and administrative matters and statistical analyses. If you
choose not to complete all the questions on this form it may not be possible for Monash University to assess your
assignment. You have a right to access personal information that Monash University holds about you, subject to
any exceptions in relevant legislation. If you wish to seek access to your personal information or inquire about the
handling of your personal
information, please contact the University Privacy Ofcer:privacyofcer@adm.monash.edu.au

Secure Best Marks with AI Grader

Need help grading? Try our AI Grader for instant feedback on your assignments.
Document Page
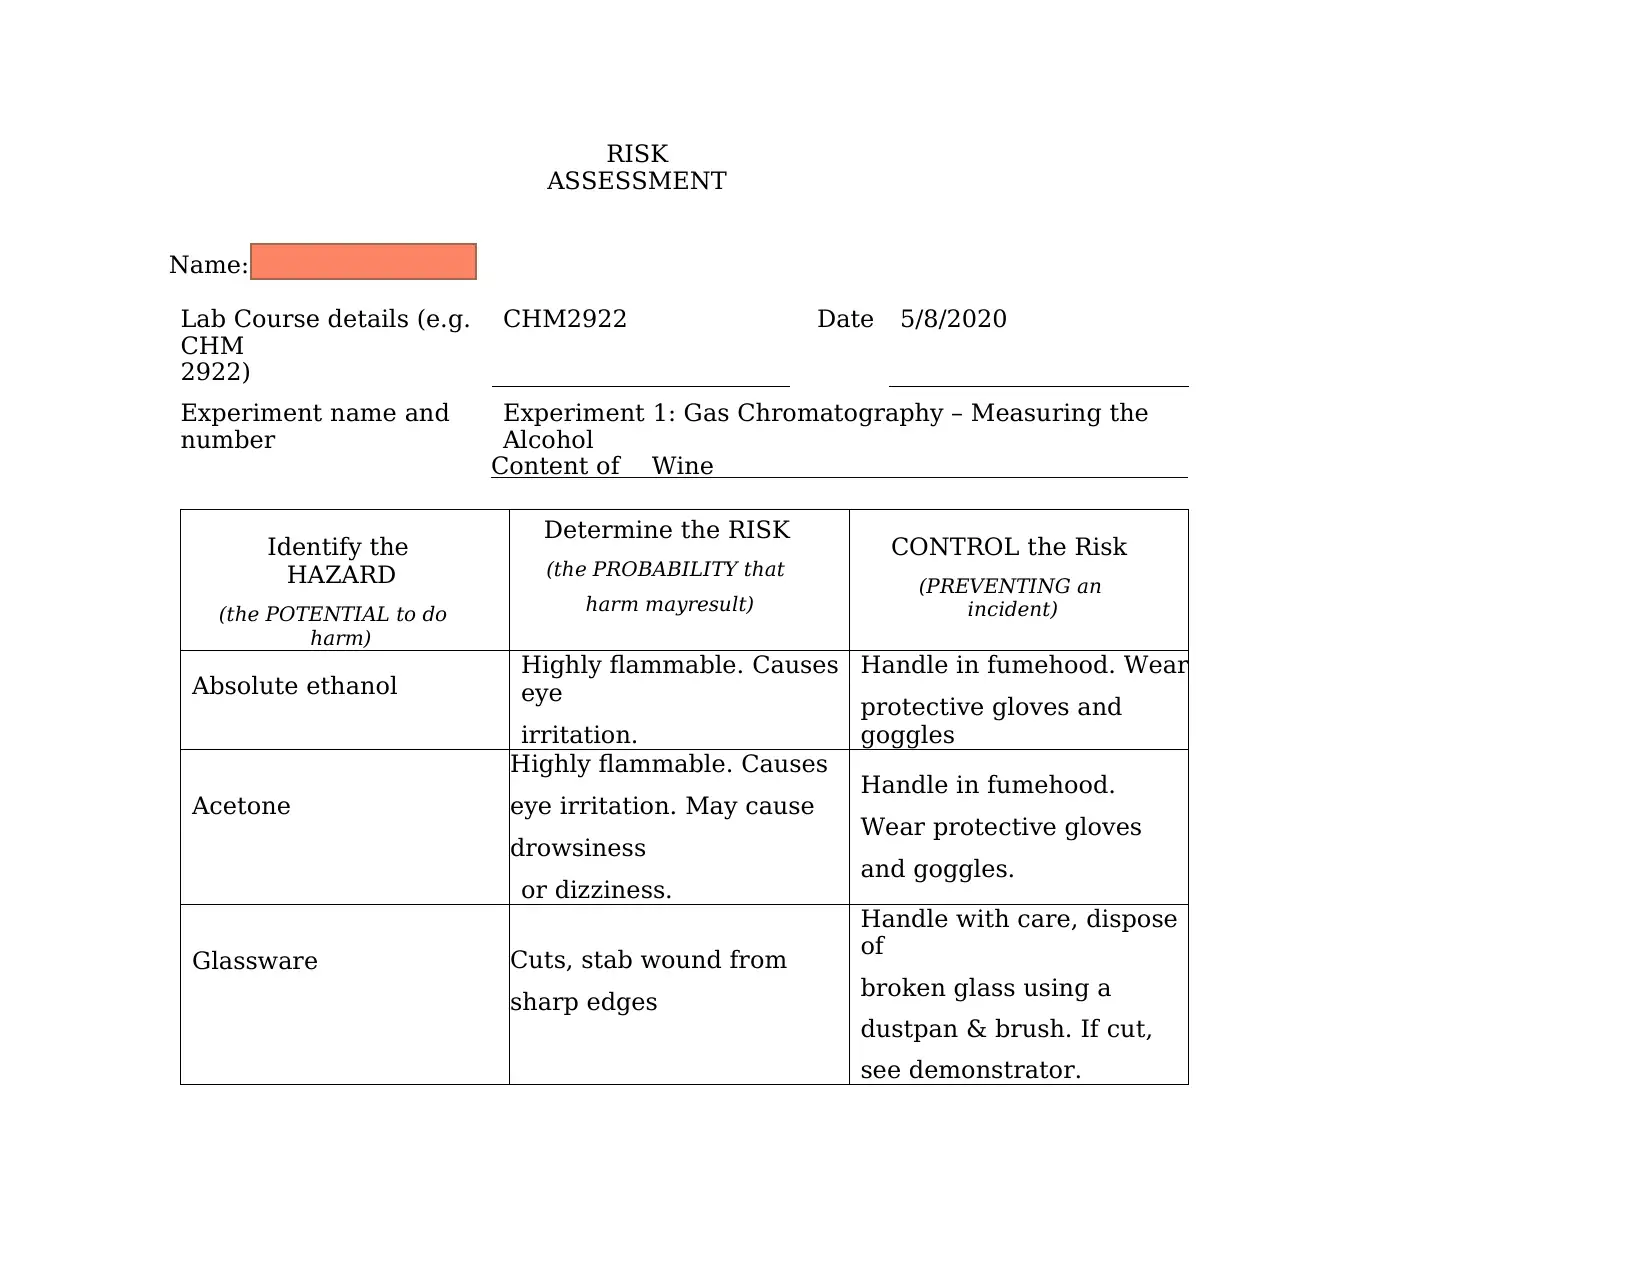
RISK
ASSESSMENT
Name: Nuramira Amran
Lab Course details (e.g.
CHM
2922)
CHM2922 Date 5/8/2020
Experiment name and
number
Experiment 1: Gas Chromatography – Measuring the
Alcohol
Content of Wine
Identify the
HAZARD
(the POTENTIAL to do
harm)
Determine the RISK
(the PROBABILITY that
harm mayresult)
CONTROL the Risk
(PREVENTING an
incident)
Absolute ethanol Highly flammable. Causes
eye
irritation.
Handle in fumehood. Wear
protective gloves and
goggles
Acetone
Highly flammable. Causes
eye irritation. May cause
drowsiness
or dizziness.
Handle in fumehood.
Wear protective gloves
and goggles.
Glassware Cuts, stab wound from
sharp edges
Handle with care, dispose
of
broken glass using a
dustpan & brush. If cut,
see demonstrator.
Document Page
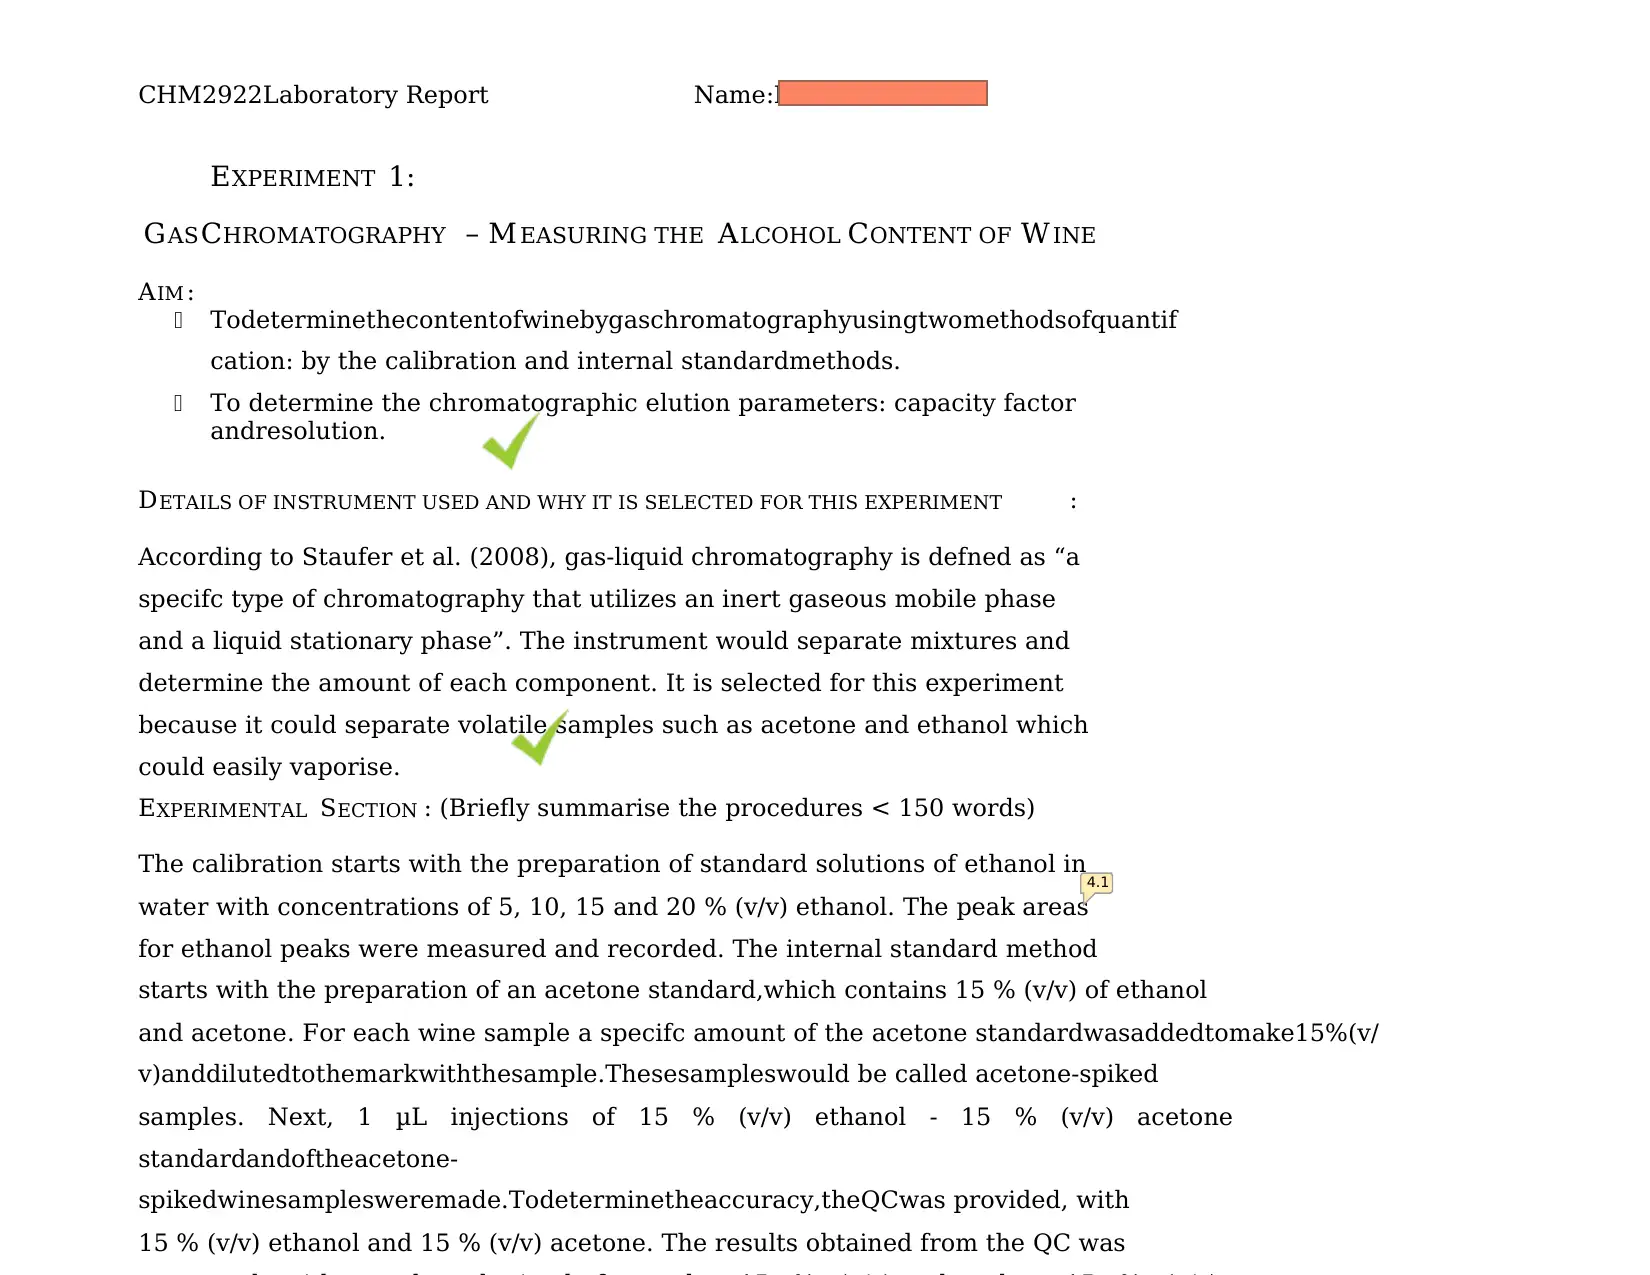
CHM2922Laboratory Report Name:NuramiraAmran
EXPERIMENT 1:
GASCHROMATOGRAPHY M EASURING THE ALCOHOL CONTENT OF W INE
AIM :
Todeterminethecontentofwinebygaschromatographyusingtwomethodsofquantif
cation: by the calibration and internal standardmethods.
To determine the chromatographic elution parameters: capacity factor
andresolution.
DETAILS OF INSTRUMENT USED AND WHY IT IS SELECTED FOR THIS EXPERIMENT :
According to Staufer et al. (2008), gas-liquid chromatography is defned as “a
specifc type of chromatography that utilizes an inert gaseous mobile phase
and a liquid stationary phase”. The instrument would separate mixtures and
determine the amount of each component. It is selected for this experiment
because it could separate volatile samples such as acetone and ethanol which
could easily vaporise.
EXPERIMENTAL SECTION : (Briefly summarise the procedures < 150 words)
The calibration starts with the preparation of standard solutions of ethanol in
water with concentrations of 5, 10, 15 and 20 % (v/v) ethanol. The peak areas
for ethanol peaks were measured and recorded. The internal standard method
starts with the preparation of an acetone standard,which contains 15 % (v/v) of ethanol
and acetone. For each wine sample a specifc amount of the acetone standardwasaddedtomake15%(v/
v)anddilutedtothemarkwiththesample.Thesesampleswould be called acetone-spiked
samples. Next, 1 μL injections of 15 % (v/v) ethanol - 15 % (v/v) acetone
standardandoftheacetone-
spikedwinesamplesweremade.Todeterminetheaccuracy,theQCwas provided, with
15 % (v/v) ethanol and 15 % (v/v) acetone. The results obtained from the QC was
4.1
Document Page
/
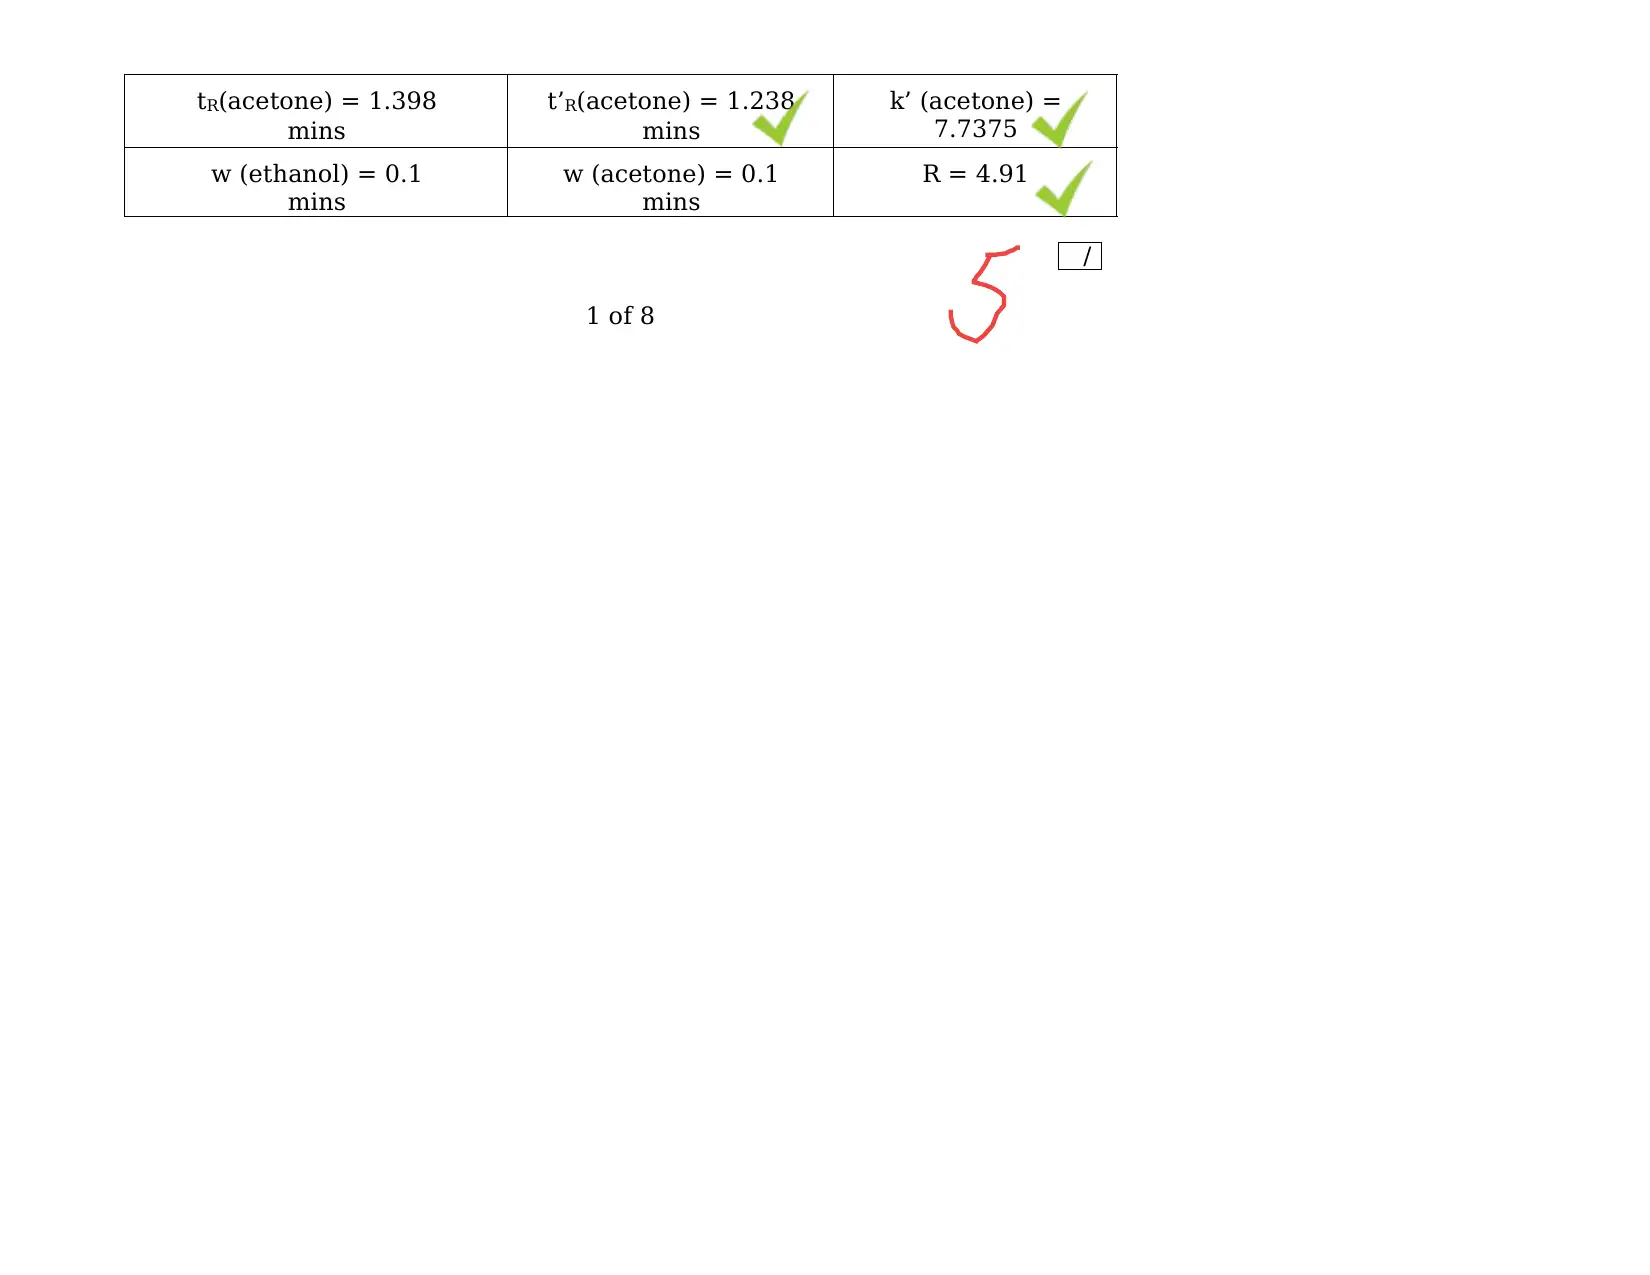
tR(acetone) = 1.398
mins
t’R(acetone) = 1.238
mins
k’ (acetone) =
7.7375
w (ethanol) = 0.1
mins
w (acetone) = 0.1
mins
R = 4.91
1 of 8

Paraphrase This Document

Need a fresh take? Get an instant paraphrase of this document with our AI Paraphraser
Document Page
/
/
Ethanol Concentration % (v/v)
2520051015
y = 743.41x - 142.45
R² = 0.9996
16000
14000
12000
10000
8000
6000
4000
2000
0
Calibration Graph of Peak Area vs Diferent
Concentration of Ethanol Standard Solution
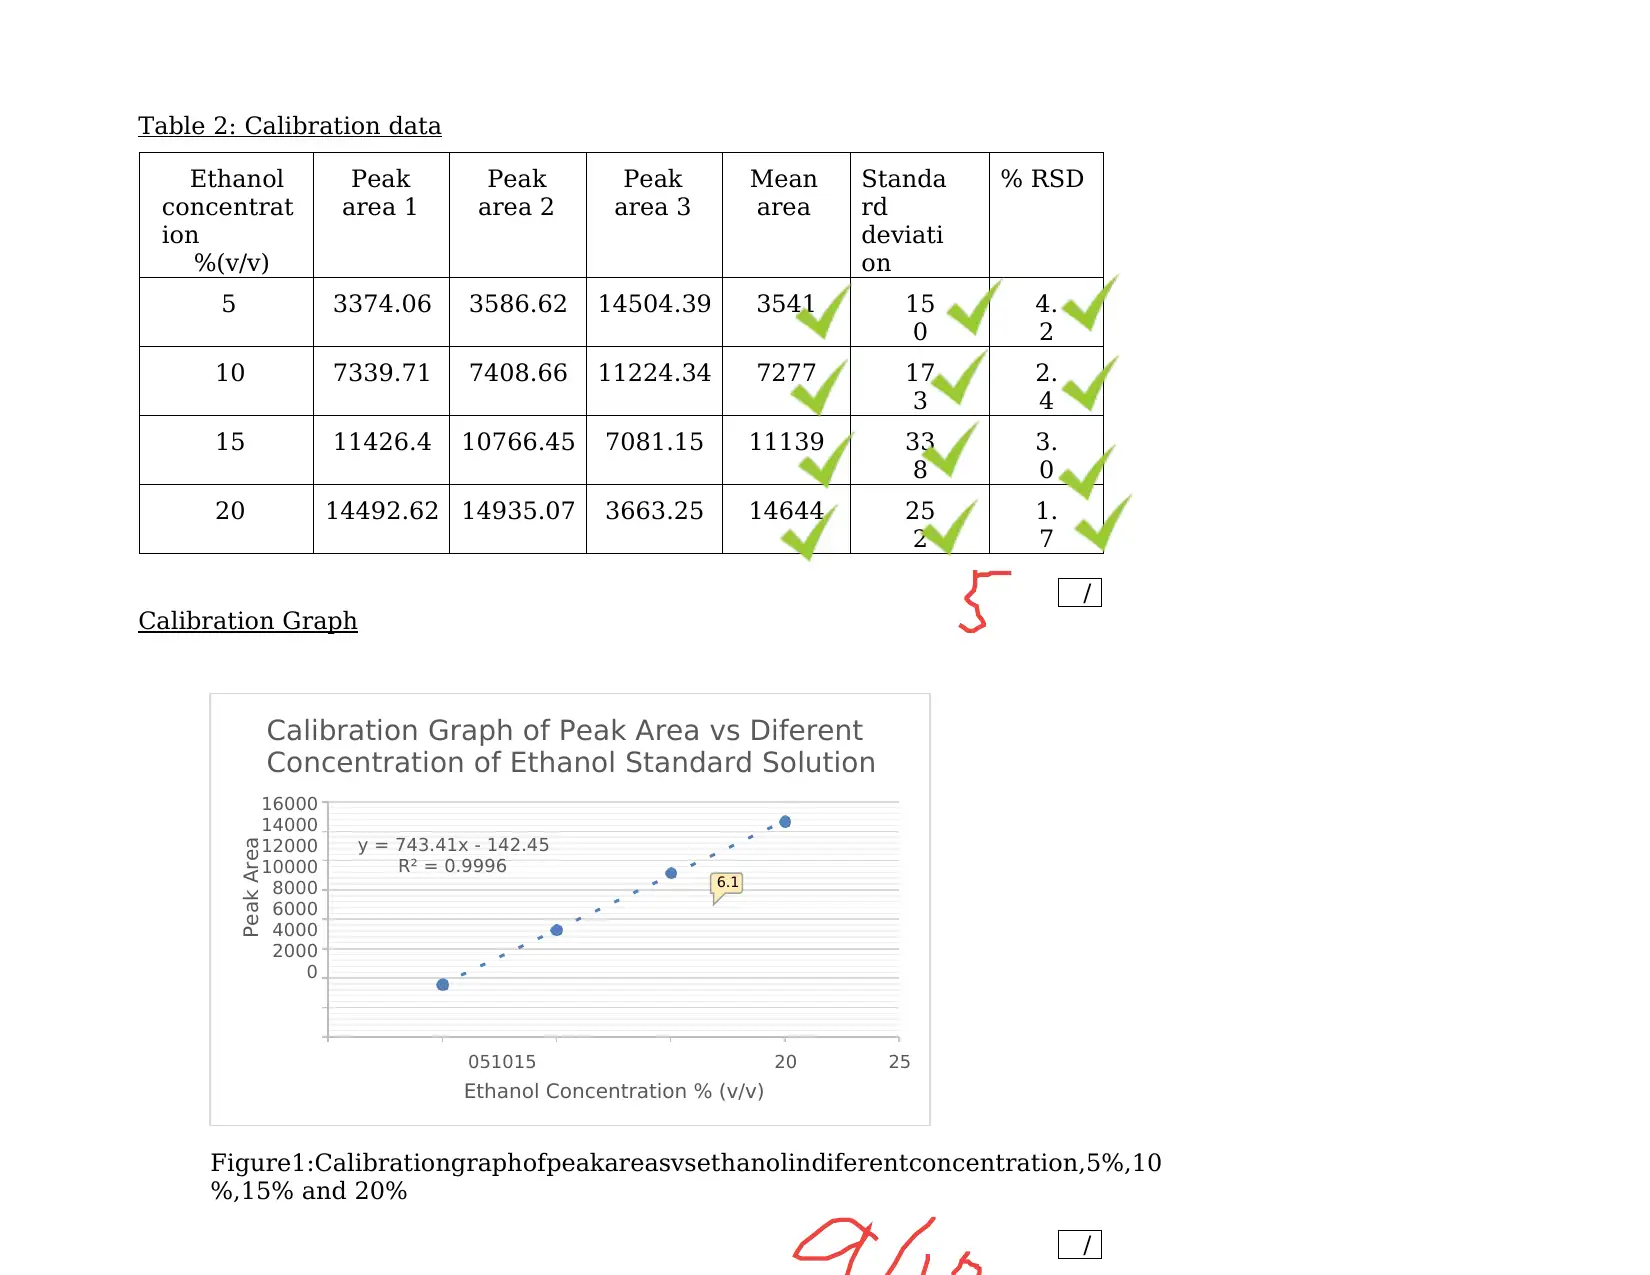
Table 2: Calibration data
Ethanol
concentrat
ion
%(v/v)
Peak
area 1
Peak
area 2
Peak
area 3
Mean
area
Standa
rd
deviati
on
% RSD
5 3374.06 3586.62 14504.39 3541 15
0
4.
2
10 7339.71 7408.66 11224.34 7277 17
3
2.
4
15 11426.4 10766.45 7081.15 11139 33
8
3.
0
20 14492.62 14935.07 3663.25 14644 25
2
1.
7
Calibration Graph
Figure1:Calibrationgraphofpeakareasvsethanolindiferentconcentration,5%,10
%,15% and 20%
Peak Area
6.1
Document Page
/
Table 3: Calibration method results
Wine Sample run
number
Peak area (Ethanol) Calculated
Ethanol
Concentration - %
(v/v)
1 8167.85 11.179
2 8065.78 11.041
3 8095.57 11.081
Average
concentration -
%(v/v)
11.1
Standard deviation 0.0706
04
Relative standard
deviation
(%)
0.6360
5
Table 4: Internal standard method (acetone spiked) results
Internal
standard
number
Peak area
(Acetone)
Peak area
(Ethanol)
1 24705 24999
2 24819 25131
3 24616 25131
Average area 24713.33 101.75
Standard
Deviation
25087 76.21
Document Page
/
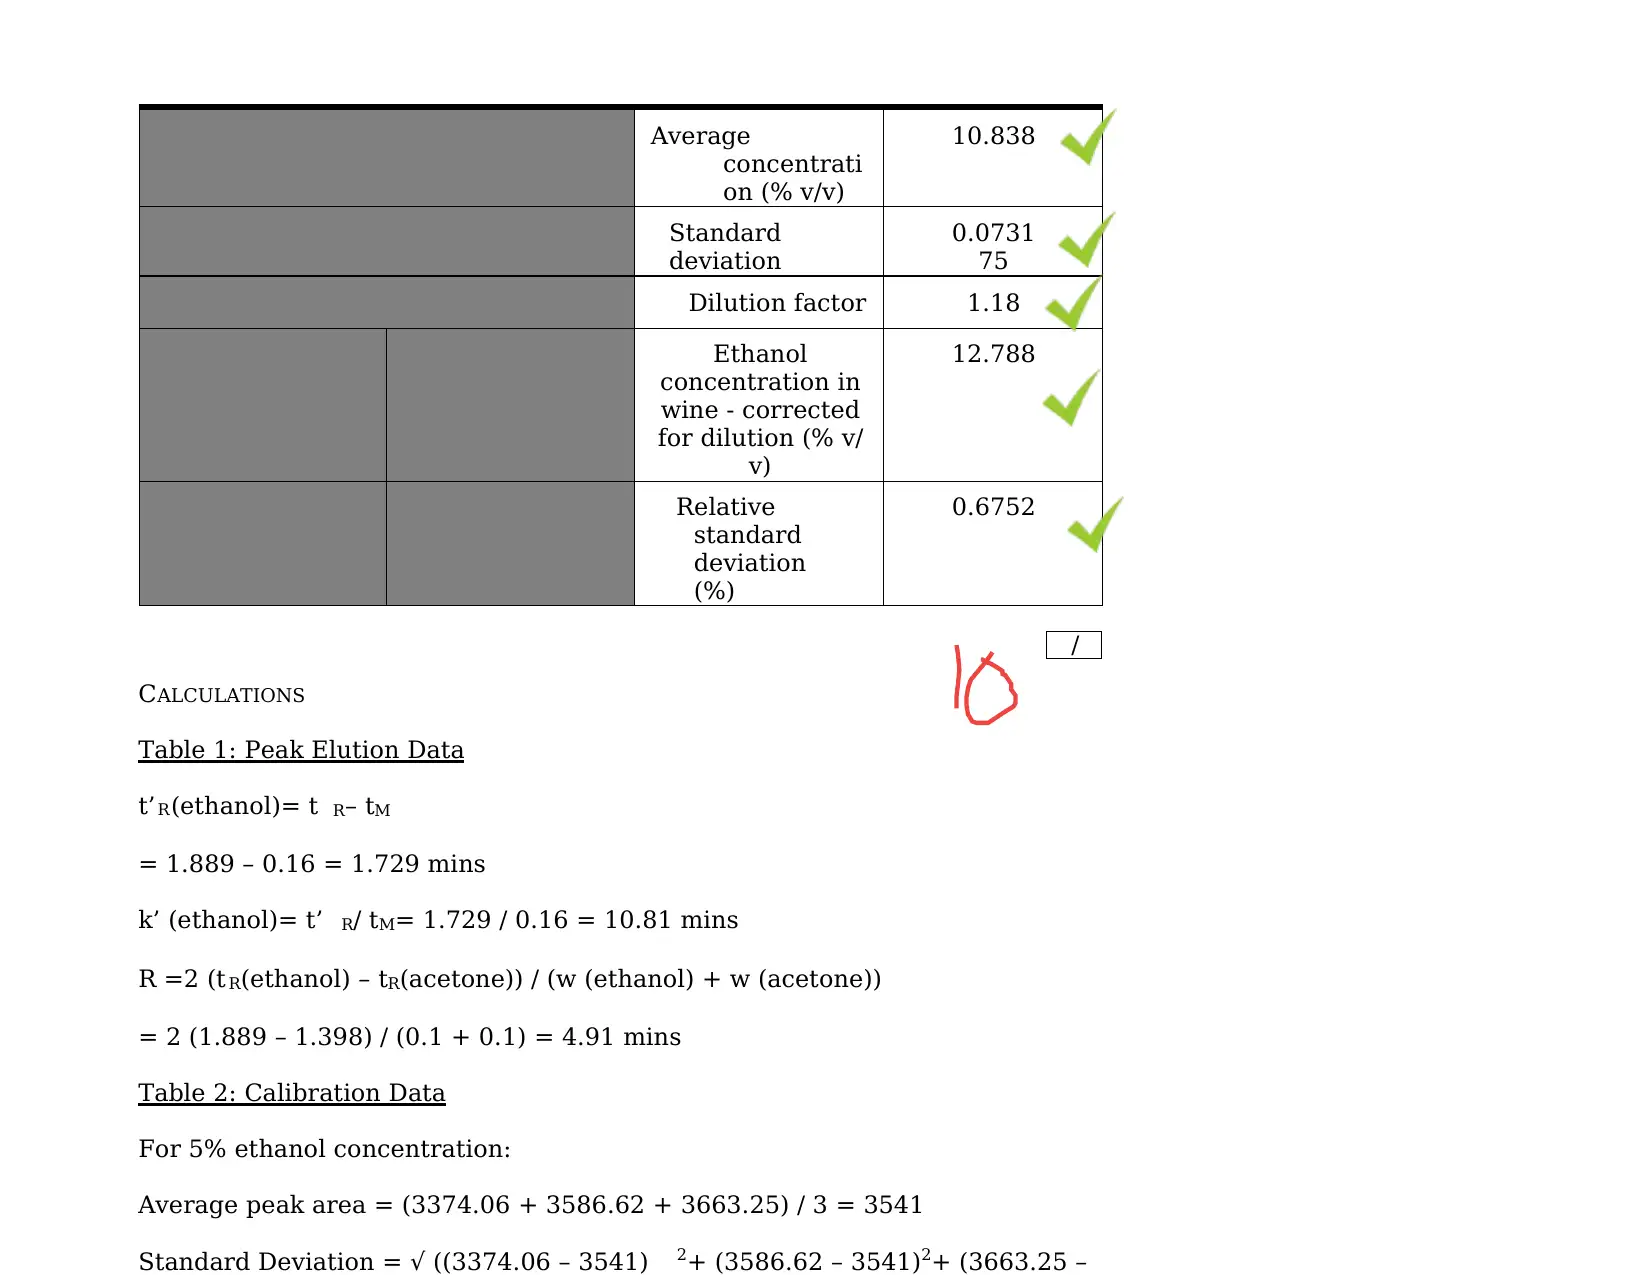
Average
concentrati
on (% v/v)
10.838
Standard
deviation
0.0731
75
Dilution factor 1.18
Ethanol
concentration in
wine - corrected
for dilution (% v/
v)
12.788
Relative
standard
deviation
(%)
0.6752
CALCULATIONS
Table 1: Peak Elution Data
t’R(ethanol)= t R tM
= 1.889 – 0.16 = 1.729 mins
k’ (ethanol)= t’ R/ tM= 1.729 / 0.16 = 10.81 mins
R =2 (t R(ethanol) – tR(acetone)) / (w (ethanol) + w (acetone))
= 2 (1.889 – 1.398) / (0.1 + 0.1) = 4.91 mins
Table 2: Calibration Data
For 5% ethanol concentration:
Average peak area = (3374.06 + 3586.62 + 3663.25) / 3 = 3541
Standard Deviation = √ ((3374.06 – 3541) 2+ (3586.62 – 3541)2+ (3663.25 –

Secure Best Marks with AI Grader

Need help grading? Try our AI Grader for instant feedback on your assignments.
Document Page
Peak Area = 8167.85
From the equation obtained by calibration graph: y = 743.41x – 142.45
Ethanol Concentration % (v/v)= (8167.85 + 142.45) / 743.41 = 11.179 % (v/v)
Document Page
/5
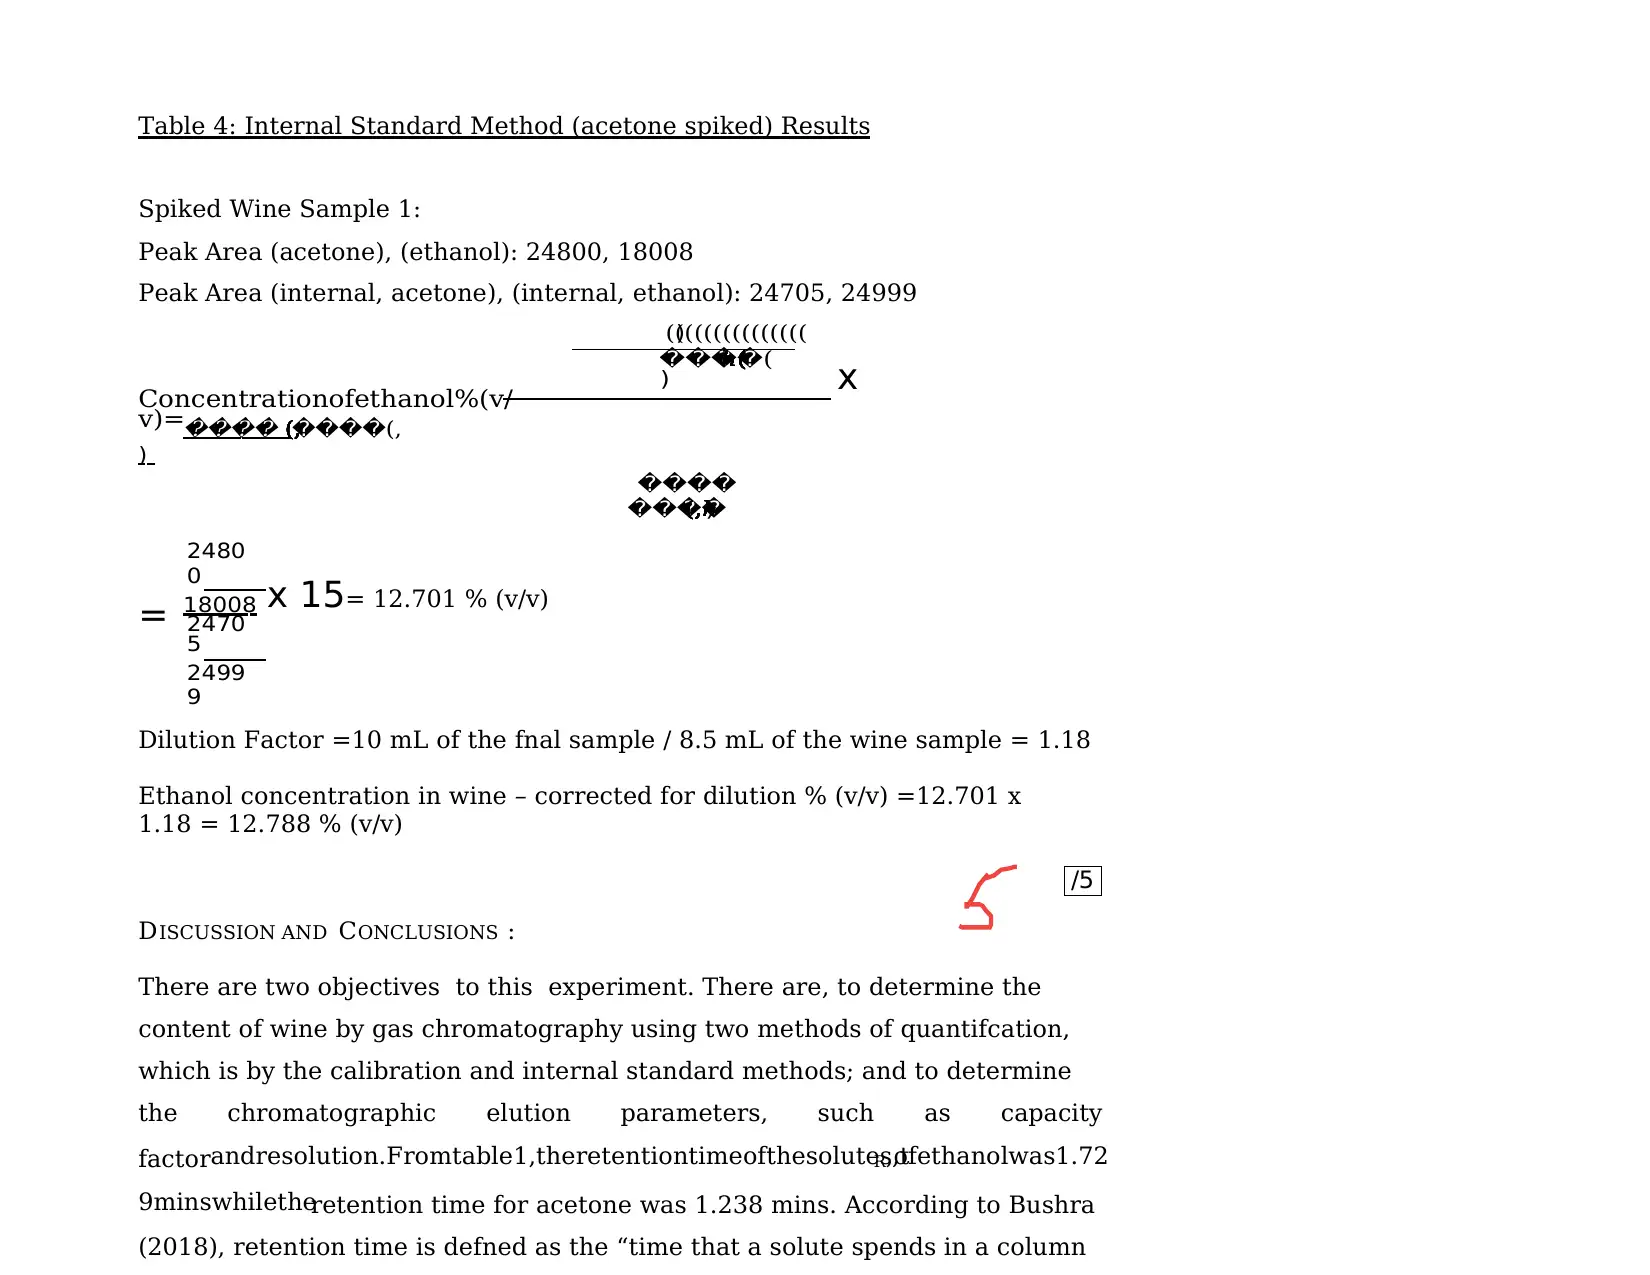
Table 4: Internal Standard Method (acetone spiked) Results
Spiked Wine Sample 1:
Peak Area (acetone), (ethanol): 24800, 18008
Peak Area (internal, acetone), (internal, ethanol): 24705, 24999
)(((((((((((((((
����(((((((((((((((
)
Concentrationofethanol%(v/
v)=���� ����(,(,(,(,(,(,(,(,(,(,(,(,(,(,(,
)
����
����)(,ℎ(,ℎ(,ℎ(,ℎ(,ℎ(,ℎ(,ℎ(,ℎ(,ℎ(,ℎ(,ℎ(,ℎ(,ℎ(,ℎ(,ℎ
2480
0
18008
2470
5
2499
9
x 15= 12.701 % (v/v)
Dilution Factor =10 mL of the fnal sample / 8.5 mL of the wine sample = 1.18
Ethanol concentration in wine – corrected for dilution % (v/v) =12.701 x
1.18 = 12.788 % (v/v)
DISCUSSION AND CONCLUSIONS :
There are two objectives to this experiment. There are, to determine the
content of wine by gas chromatography using two methods of quantifcation,
which is by the calibration and internal standard methods; and to determine
the chromatographic elution parameters, such as capacity
factorandresolution.Fromtable1,theretentiontimeofthesolutes,tR,ofethanolwas1.72
9minswhiletheretention time for acetone was 1.238 mins. According to Bushra
(2018), retention time is defned as the “time that a solute spends in a column
x
=
Document Page
According to Bushra (2018), the retention
factorisdefnedas“theratiooftimespentbythesoluteinthestationaryandmobilephase”.A
higher value of retention factor would indicate that the solute is much more polar
that the other. The resolution (R), is a parameter that is used to measure the degree
of peak separation. From table 1, it was determined that the resolution was 4.91.

Paraphrase This Document

Need a fresh take? Get an instant paraphrase of this document with our AI Paraphraser
Document Page
Based on the data in table 2, a calibration graph of peak areas against ethanol
in diferent concentrations, 5%, 10%, 15% and 20%, was plotted. From the
equation that was obtained from the
calibrationgraph,theconcentrationofethanolwasdetermined.Theaverageconcentra
tionofethanol
inallthreesamplesofwinewas11.179%(v/v).Thisconcentrationofethanolwasobtaine
dfromthe calibration technique. The results that were obtained from the internal
standard method is shown in table, whereby the average concentration of ethanol
was 12.788 % (v/v), after multiplying with the dilution factor. The diference in the
two concentration of ethanol is not big, rather it is a slight diference.
The precision of both results that were obtained from the two quantifcation
techniques can be determined using the %RSD. The %RSD of the ethanol
concentration, 5%, 10%, 15% and 20%, in table 2 were 4.2%, 2.4%, 3.0% and
1.7%, respectively. Since the %RSD that were calculated for the
concentrations were lower than 5%, it would mean that the values are precise.
The %RSD for the ethanol concentration determined in the wine samples for
the calibration method was 0.63605%, which is lower than 5%, making it
precise. The %RSD for the ethanol concentration that was determined using
the internal standard method was 0.6752. Since the %RSD for the ethanol
concentration determined using calibration method is lower, it would mean
that the method is much more precise that the other.
Inconclusion,thetwoobjectivesoftheexperimentwereachieved.Theconcentrationof
ethanolwas determined using two quantifcation methods, calibration and
internal standard. Through calibration
method,theconcentrationofethanolwasdeterminedtobe11.179%(v/v)whiletheconc
entrationof ethanol that was obtained through the internal standard method, was
Document Page
1 Whatefectwouldincreasingtheoventemperaturehavehadontheretentiontimeof
ethanoland acetone? (4marks)
The retention time would decrease when the oven temperature increases. This
is because the high
temperaturewouldexcitethesamplemoleculesanditwouldresultinthemoleculestovapori
zefaster. Hence, it would separate faster, but it could lead to poor separation since the
components would mainly be in the gas phase, decreasing the accuracy of the result
(Zuo, Yang, Huang and Xia,2013).
Document Page
/
2 Suggest why a column with a BP20 stationary phase was specifed for this
analysis? (4 marks)
ThecolumnwithaBP20stationaryphaseismadefrompolyethyleneglycolanditiscomm
onlyused as a polar stationary phase. This experiment separates ethanol and
acetone, and because ethanol is a higher polar component, it would be elutedlast.
3 Are the acetone and ethanol peaks sufciently resolved to enable the
proper use of theinternalstandardmethod? (3marks)
The resolution that was calculated was 4.91 which is higher than the baseline
resolution, which is at
1.5. This would indicate that the ethanol and acetone peaks are sufciently
resolved to enable the proper use of the internal standard method.
4 There have been cases where wine has been mistakenly adulterated with
ethylene glycol (1,2-ethanediol, bp760197.6 ˚C). As a forensic chemist,
suggest how would you use GLC to prove conclusively that ethylene glycol
was actually present? (4 marks)
The standard solution of ethylene glycol 1, 2-ethanediol and wine that
contains ethylene glycol 1,2- ethanediolthatarepreparedwouldbeinjectedinto
theGLCanditsretentiontimeandpeakareasare measured and recorded. The
retention time and peak areas are compared, and if the wine contains ethylene
glycol 1,2-ethanediol, it would have the same retention time and peak area as
the standard solution.
14.1
14.2

Secure Best Marks with AI Grader

Need help grading? Try our AI Grader for instant feedback on your assignments.
Document Page
/
REFERENCES :
Bushra,R., 2018. Functionalized Nanomaterials for
Chromatography. In: C. Hussain,
ed.,Nanomaterialsi n C h r o m a t o g r a p h y ,1 s t e d .
[ o n l i n e ] E l s e v i e r , p p . 4 0 3 - 4 1 4 . A v a i l a b l e a t :
<https://www.sciencedirect.com/book/9780128127926/nanomaterials-in-
chromatography#book-info> [Accessed 6 August 2020].
Staufer, E., Dolan, J. and Newman, R., 2008.Fire Debris Analysis. Boston,
Mass.: Academic Press, pp.235-293.
Zuo, H., Yang, F., Huang, W. and Xia, Z., 2013. Preparative Gas
Chromatography and Its Applications.Journal of Chromatographic Science,
[online] 51(7), pp.704-715. Available at:
<https://academic.oup.com/chromsci/article/51/7/704/474245> [Accessed 7
August2020].
Total ReportMark /
Document Page
Index of comments
4.1 what about the unknown wine sample?
6.1 error bars missing
12.1 you can discuss accuracy by comparing with QC ethanol in calibration method, and you should discuss
possible sources of error for each method, and you should discuss more on the merits of each method, give
your opinions which method is more preferable?
14.1 you should describe what kind of interaction of bonding is involved here
14.2 you should also describe how to set up your GC to accommodate boiling point of ethylene glycol
Document Page
SCHOOL OF SCIENCE
ASSESSMENT COVER SHEET
Student’s name (Surname) (Given names)
ID number Phone
Unit name Unit code
t
Note: If this is a group assignment, please include the names of all other group members.
Title of assignment
Lecturer/tutor
Is this an authorised group assignment? Yes No
Has any part of this assignment been previously submitted as part of another unit/course? Yes No
Tutorial/laboratory day & time
Due date Date submitted
All work must be submitted by the due date. If an extension of work is granted this must be specified with the signature of the
lecturer/tutor.
Extension granted until (date) ................................ Signature of lecturer/tutor .................................................
Please note that it is your responsibility to retain copies of your assessments.
Intentional plagiarism or collusion amounts to cheating under Monash University Statute 4.1 Student Discipline.
Plagiarism: Plagiarism means to take and use another person’s ideas and or manner of expressing them and to pass these off as
one’s own by failing to give appropriate acknowledgement, including the use of material from any source, staff, students or the
internet, published and unpublished works.
Collusion: Collusion means unauthorised collaboration on assessable written, oral or practical work with another person.
Where there are reasonable grounds for believing that intentional plagiarism or collusion has occurred, this will be reported to the
Associate Dean (Education) or nominee, who may disallow the work concerned by prohibiting assessment or refer the matter to
the Faculty Discipline Panel for a hearing.
Student Statement:
I have read the university’s Student Academic Integrity Policy and Procedures.
I understand the consequences of engaging in plagiarism and collusion as described in University Statute 4.1 Student
Discipline, Part 2 Misconduct http://adm.monash.edu/legal/legislation/statutes/statute4-1-student-discipline.pdf .
I have taken proper care to safeguard this work and made all reasonable efforts to ensure it could not be copied.
No part of this assignment has been previously submitted as part of another unit/course.
I acknowledge and agree that the assessor of this assignment may for the purposes of assessment, reproduce the assignment
and:

Paraphrase This Document

Need a fresh take? Get an instant paraphrase of this document with our AI Paraphraser
Document Page
RISK ASSESSMENT
Name: Nuramira Amran
Lab Course details (e.g. CHM
2922)
CHM2922 Date 13/8/2020
Experiment name and number Experiment 3: Measuring Iron in “Concrete Boots” using Atomic
Absorption Spectrometry
Identify the HAZARD
(the POTENTIAL to do harm)
Determine the RISK
(the PROBABILITY that harm may
result)
CONTROL the Risk
(PREVENTING an incident)
Hydrochloric Acid Causes severe skin burns and
eye damage. Toxin if inhaled.
Handle in fumehood. Wear
protective gloves and goggles
Aluminium Stock Solution Causes skin and serious eye
irritation.
Handle in fumehood. Wear
protective gloves and goggles.
Calcium Stock Solution Causes skin and serious eye
irritation.
Handle in fumehood. Wear
protective gloves and goggles.
Iron Stock Solution Causes skin and serious eye
irritation.
Handle in fumehood. Wear
protective gloves and goggles.
Glassware Cuts, stab wound from sharp
edges
Handle with care, dispose of
broken glass using a dustpan &
brush. If cut, see demonstrator.
Document Page
CHM2922 Laboratory Report Name: Nuramira Amran
ONLINE EXERCISE 2:
ANALYSIS OF IRON IN CONCRETE BOOTS BY ATOMIC ABSORPTION
SPECTROMETRY
Aim:
To learn the principles of atomic absorption spectroscopy
To determine the iron content of three cement samples and hence solve a murder case.
/2
PRELAB QUIZ:
Q1: Write a brief account (150 200 words) of the general principles and uses of atomic
absorption spectrometry for chemical analysis.
The atomic absorption spectrometry (AAS) is a technique that is based on the process called atomic
absorption. According to Sanz-Medel and Pereiro (2014), the process occurs when “ a ground-state
electron of the analyte absorbs energy, in the form of light of a given frequency. From an external
light source and so the electron is excited to an upper-energy-level state of the atom.” The technique
is used when analysing copper in food and beverages (Barberá et al., 2003) and used in forensic
science to determine the concentration or the presence of gunshot residue on a suspect’s hand (Salles
et al., 2012).
Q2: A series of five calibration standards 25, 50, 75 and 100 mg/L Fe is required to be made
from a 1000mg/L Fe standard solution. If the final volume of the calibration standards is 100
mL, what is the required volume of the 1000 mg/L Fe standard solution? Show your calculation.
M1 = concentration of standard solution (mg/L)
V1 = volume of standard solution (mL)
M2 = concentration of iron solution required (mg/L)
V2 = volume of standard flask (mL)
25 mg/L calibration solution: M1V1 = M2V2
3.1
Document Page
Table 1: The concentration of calibration solutions required, and the volume of Fe standard solution
added.
Concentration (mg/L) Volume of the 1000 mg/L Fe standard solution (mL)
25 2.5
50 5.0
75 7.5
100 10.0
Q3: Suggest a method to accurately make the above calibration standards
Firstly, in order to make sure that the calibration standards were made accurately, the apparatus that
is used must be clean and free from any contaminations. Secondly, an accurate amount of standard
solution must be pipetted into the volumetric flasks and when adding water for dilution, it should not
exceed the mark on the volumetric flask. Lastly, the absorbance readings should be done twice or
three times to avoid any errors and ensure that the calibration curve that is plotted would be accurate.
/10
/8
EXPERIMENTAL SECTION: (brief description; < 150 words)
Preparation of Calibration Solutions:
A series of five calibration standards of Fe were prepared in 100 mL volumetric flasks.
Extraction of Iron from cement by acid digestion
1. The cement sample was weighed onto a piece of filter paper, making sure that all the lumps
had been crushed into fine powder.
2. The cement was then carefully poured into a large test tube and the paper was reweighed to
determine the exact amount that was poured into the test tube.
3. Ten millilitre of 5.5 M hydrochloric acid was added to the test tube and agitated until the
cement is dissolved.

Secure Best Marks with AI Grader

Need help grading? Try our AI Grader for instant feedback on your assignments.
Document Page
SUMMARY OF RESULTS AND CALCULATIONS:
Table 2: Calibration Data
Concentration
(mg/L)
Abs 1 Abs 2 Abs 3 Mean Abs Std Deviation
0 -0.0035 -0.0032 -0.0024 -0.00303 0.000569
25 0.1451 0.1456 0.1448 0.14517 0.000404
50 0.2935 0.2935 0.293 0.29333 0.000289
75 0.4155 0.4155 0.4166 0.41587 0.000635
100 0.5487 0.587 0.5575 0.55163 0.005081
/5
Calibration Graph:
Figure 1: Standard calibration graph of iron concentration of standard solutions vs absorbance
at 372 nm.
y = 0.0055x + 0.0046
R² = 0.9986
-0.1
0
0.1
0.2
0.3
0.4
0.5
0.6
0 20 40 60 80 100 120
Absorbance at 372 nm
Iron concentration of standard solutions (mg/L)
Document Page
CALCULATIONS:
Table 2: Calibration Data
Volume of standard solution required:
For 10 mg/L calibration solution:
M1V1 = M2V2
(1000) x V1 = 100 x 100 = 10.0 mL
Mean absorbance:
= (0.5487 + 0.587 + 0.5575) / 3 = 0.55163
Standard Deviation
= √ ((0.5487 0.55163)2 + (0.587 0.55163)2 + (0.5575 0.55163)2) / 2
= 0.005081
Table 3: Sample Data
For sample Australian Builders 1:
Concentration (mg/L):
From the calibration graph:
y = 0.0055x + 0.0046
0.162 = 0.0055x + 0.0046
x = (0.162 0.0046) / 0.0055 = 28.62 mg/L
When converted to g/L, 28.62 / 1000 = 0.02862 g/L
Concentration (gFe/g) = (concentration (g/L) x 0.1) / mass of sample
= (0.2862 x 0.1) / 0.3922 = 0.007297 gFe/g sample
Concentration % (gFe/g) = concentration (gFe/g sample) x 100 %
= 0.07297 x 100 = 0.7297 %
%RSD = (standard deviation / average concentration) x 100
= (0.3558 / 6.886) x 100 = 5.168 %
Table 4: QC standard data
For (liquid) QA mg (Fe)/L:
Document Page
CHM2922 Laboratory Report Name: Nuramira Amran
5
Table 3: Sample data
Sample
Mass of sample
(g)
Mean
Abs
Conc
(mg/L)
Conc
(g/L)
Conc
gFe/g sample
Conc
%(m/m)
Mean
% (m/m) Std Dev %RSD
Australian Builders 1 0.3922 0.162 28.62 0.02862 7.297 x 10⁻³ 0.7297
Australian Builders 2 0.4029 0.1526 26.91 0.02691 6.679 x 10⁻³ 0.6679
Australian Builders 3 0.391 0.1483 26.13 0.02613 6.682 x 10⁻³ 0.6682 0.6886 0.03558 5.168
Melcann Grey 1 0.397 0.2172 38.65 0.03865 9.737 x 10⁻³ 0.9737
Melcann Grey 2 0.3988 0.2153 38.31 0.03831 9.606 x 10⁻³ 0.9606
Melcann Grey 3 0.4105 0.2204 39.24 0.03924 9.558 x 10⁻³ 0.9558 0.9634 0.009237 0.9589
Unknown 1 0.4135 0.2409 42.96 0.04296 0.01039 0.1039
Unknown 2 0.403 0.2242 39.93 0.03993 9.907 x 10⁻³ 0.9908
Unknown 3 0.3995 0.1926 34.18 0.03418 8.556 x 10⁻³ 0.8556 0.9618 0.09507 9.885
Cement (solid) QA 1 1.302 0.2723 48.67 0.04867 3.738 x 10⁻³ 0.3738
Cement (solid) QA 2 1.2729 0.2656 47.45 0.04745 3.728 x 10⁻³ 0.3728
Cement (solid) QA 3 1.225 0.2486 44.36 0.04436 3.622 x 10⁻³ 0.3662 0.3696 0.006467 1.750
(liquid) QA (85 mg/L) 0.4787 86.2
Table 4: QC standard data
Sample Mean (from above) QA value %Relative Error
Cement (solid) QA mg (Fe)/g sample 46.83 18 160.17 %
(liquid) QA mg (Fe)/L 86.2 85 1.412 %
OBSERVED FLAME COLOURS FOR:
Calcium: flame became red/pink. Aluminium: flame colour did not change, hence orange. Iron: Brownish orange /20
Document shared on https://www.docsity.com/en/spectroscopy-and-analytical-chemistry-chm2922-lab-reports/8957042/
Downloaded by: dongxiaoma666 (dongxiaoma666@gmail.com)

Paraphrase This Document

Need a fresh take? Get an instant paraphrase of this document with our AI Paraphraser
Document Page
CHM2922 Laboratory Report Name: Nuramira Amran
DISCUSSION AND CONCLUSIONS:
Comment on the accuracy using both your solid QA and liquid QA. Comment on the
reproducibility of your results:
Accuracy refers to how close is the measured values that have been obtained during the experiment
to the true value. To determine the accuracy the percentage relative error (%RE) was calculated using
the QC standard data in both solid and liquid in Table 4. The lower the % RE, the more accurate the
measured values are. The expected concentration that was given for liquid QC standard was 85 mg
(Fe)/L while the solid QC standard was 18 mg (Fe)/g. Using the concentration that was calculated,
the % RE for the QC standard in solid was 160.17 % while the QC standard in liquid is 1.412 %. The
high percentage in relative error for QC standard solid could be due to errors that had occurred during
the experiment, such as poor calibration of the AAS instrument. The high value would indicate that
the measured values are inaccurate.
Precision refers to how close are the measured values are to the values obtained when the procedure
was triplicated. The precision is determined calculating the relative standard deviation (% RSD) of
the samples. When the % RSD is low, this means that the measured values are precise. The percentage
value that is acceptable and is still considered precise is 20 %. If the % RSD exceeds 20%, the
measured value would be considered precise. The % RSD for the Australian Builders sample was
5.168 % while the % RSD for the Melcann Grey samples was 0.9589. The % RSD for the unknown
sample was 9.885 % while the %RSD for the solid QC was 1.750 %. The %RSD for all the samples
is below 20 %, meaning reproducibility is high.
Identify the most like sources of error in your experimental procedure:
There are many errors that could have occurred during the experiment, which would alter the result.
One of the most highly likely errors that could have happened was the cement samples getting stuck
on the filter paper that was used to weigh the cement samples. This could have affected the final
calculations of the concentration of iron in the sample. Another error that could have occurred, would
Document Page
What is the origin of the bright flame colour that is emitted when cement samples are
aspirated into the AAS?
The cement samples would be aspirated into the AAS through a nebulizer and then sprayed as an
aerosol. The cement samples would be mixed with fuel and oxidant gases inside the chamber and
then go to the burner head where combustion and atomization would occur. During atomization,
ground state atoms, which are in gaseous state, are formed. These atoms would absorb the energy
from the light source and become excited. This would make them go to a higher energy level and
when they return, they would emit energy in a form of a specific wavelength of light, which would
result in the flame having different colors (Viets and O'Leary, 1992). During this experiment, the
flame colors that was observed for calcium, aluminium and iron were red-pink, orange and brownish
orange, respectively.
How is it possible to measure the absorbance of iron in the AAS flame when there is also
an emission process occurring?
The presence of a rotating chopper would allow the measurement of iron in the AAS and the emission
process occurring at the same time. It is found in between the lamp, which is the light source, and the
atomizer, which is the flame. The chopper would rotate a half mirror, which, at one moment, would
block the light coming from the light source and allowing only the light emitted from the flame to be
read. At the next moment, the light emitted from the flame and from the light source would be read.
The signal processor would then subtract emission from the flame from the emission from the flame
and the light source (Sanz-Medel and Pereiro, 2014).
Can you identify the origin of the “concrete boots” cement from your results?
According to the results obtained from the experiment, it could be determined that the cement from
the “concrete boots” came from the Melcann Grey building. This is because the mean concentration
of iron that came from Melcann Grey building, which was 0.963 %, was close to the mean
concentration of iron of the unknown sample, which was 0.962 %.
CONCLUSION
9.1
9.2
Document Page
REFERENCE
Barberá, R., Farré, R. and Lagarda, M., 2003. Copper: Properties and Determination. In: B. Caballero,
ed., Encyclopedia of Food Sciences and Nutrition, 2nd ed. [online] Academic Press, pp.1634-1639.
Available at: <https://www.sciencedirect.com/science/article/pii/B012227055X002972> [Accessed
14 August 2020].
Salles, M., Naozuka, J. and Bertotti, M., 2012. A forensic study: Lead determination in gunshot
residues. Microchemical Journal, [online] 101, pp.49-53. Available at:
<https://www.sciencedirect.com/science/article/pii/S0026265X11001883> [Accessed 14 August
2020].
Sanz-Medel, A. and Pereiro, R., 2014. Atomic Absorption Spectrometry: An Introduction. 2nd ed.
New York: Momentum Press, LLC, pp.23-24.
Viets, J. and O'Leary, R., 1992. The role of atomic absorption spectrometry in geochemical
exploration. Journal of Geochemical Exploration, [online] 44(1-3), pp.107-138. Available at:
<https://www.sciencedirect.com/science/article/pii/037567429290049E> [Accessed 15 August
2020].
Total Report Mark /90

Secure Best Marks with AI Grader

Need help grading? Try our AI Grader for instant feedback on your assignments.
Document Page
Index of comments
3.1 more details on general principles
9.1 should mention how to separate emission and absorption wavelength
9.2 SD should be referred as well
Document Page
SCHOOL OF SCIENCE
ASSESSMENT COVER SHEET
Student’s name (Surname) (Given names)
ID number Phone
Unit name Unit code
t
Note: If this is a group assignment, please include the names of all other group members.
Title of assignment
Lecturer/tutor
Is this an authorised group assignment? Yes No
Has any part of this assignment been previously submitted as part of another unit/course? Yes No
Tutorial/laboratory day & time
Due date Date submitted
All work must be submitted by the due date. If an extension of work is granted this must be specified with the signature of the
lecturer/tutor.
Extension granted until (date) ................................ Signature of lecturer/tutor .................................................
Please note that it is your responsibility to retain copies of your assessments.
Intentional plagiarism or collusion amounts to cheating under Monash University Statute 4.1 Student Discipline.
Plagiarism: Plagiarism means to take and use another person’s ideas and or manner of expressing them and to pass these off as
one’s own by failing to give appropriate acknowledgement, including the use of material from any source, staff, students or the
internet, published and unpublished works.
Collusion: Collusion means unauthorised collaboration on assessable written, oral or practical work with another person.
Where there are reasonable grounds for believing that intentional plagiarism or collusion has occurred, this will be reported to the
Associate Dean (Education) or nominee, who may disallow the work concerned by prohibiting assessment or refer the matter to
the Faculty Discipline Panel for a hearing.
Student Statement:
I have read the university’s Student Academic Integrity Policy and Procedures.
I understand the consequences of engaging in plagiarism and collusion as described in University Statute 4.1 Student
Discipline, Part 2 Misconduct http://adm.monash.edu/legal/legislation/statutes/statute4-1-student-discipline.pdf .
I have taken proper care to safeguard this work and made all reasonable efforts to ensure it could not be copied.
No part of this assignment has been previously submitted as part of another unit/course.
I acknowledge and agree that the assessor of this assignment may for the purposes of assessment, reproduce the assignment
and:
Document Page
RISK ASSESSMENT
Name: Nuramira Amran
Lab Course details (e.g. CHM
2922)
CHM2922 Date 26/8/2020
Experiment name and number Experiment 6: Detecting gunshot discharge residues using UV-Vis
Spectrophotometry
Identify the HAZARD
(the POTENTIAL to do harm)
Determine the RISK
(the PROBABILITY that harm may
result)
CONTROL the Risk
(PREVENTING an incident)
Sodium Nitrate Causes severe skin burns and
eye damage.
Handle in fumehood. Wear
protective gloves and goggles
Sodium Nitrite Causes skin and serious eye
irritation. Toxic if swallowed.
Handle in fumehood. Wear
protective gloves and goggles.
N(1-naphthyl) ethylenediamine
dihydrochloride
Causes skin and serious eye
irritation.
Handle in fumehood. Wear
protective gloves and goggles.
Sulphanilamide Causes serious skin and eye
irritation. Harmful if inhaled
Handle in fumehood. Wear
protective gloves and goggles.
Hydrochloric Acid Causes severe skin burns and
eye damage. Toxic if inhaled.
Handle in fumehood. Wear
protective gloves and goggles.
Glassware Cuts, stab wound from sharp
edges
Handle with care, dispose of
broken glass using a dustpan &
brush. If cut, see demonstrator.

Paraphrase This Document

Need a fresh take? Get an instant paraphrase of this document with our AI Paraphraser
Document Page
CHM2922 Laboratory Report Name: Nuramira Amran
EXPERIMENT 6:
DETECTION OF GUNSHOT DISCHARGE RESIDUES BY UV-VIS SPECTROPHOTOMETRY
AIM:
To apply a suitable sampling method for collecting gunshot discharge residue from the hands
of a suspect.
To use spectrophotometry for the determination of nitrite in gunshot discharge or explosive
residues.
To determine who fired the weapon!
DETAILS OF INSTRUMENT USED AND WHY IT IS SELECTED FOR THIS EXPERIMENT:
According to Pentassuglia et al. (2018), UV-Vis spectrophotometry “is a type of absorption
spectroscopy in which UV-visible light is absorbed by the molecule, which would result in the
excitation of the electrons from lower to higher energy levels.” It is the chosen instrument for this
experiment because it is very versatile and has a high selectivity that it could detect every molecule
at a specific wavelength for a parameter.
/5
EXPERIMENTAL SECTION: (Describe briefly with about 150 words)
1. Prepare 100 μM nitrite standard solution by performing a serial dilution from the 10 mM
NaNO2 stock solution that was provided. From there, a set of five nitrite standards (0, 2.5, 5,
10 and 15 μM) was prepared.
2. Next, to prepare the Quality Control solution, add 1 mL of Diazotizing Reagent to each
standard solution and the Quality Control solution. Next, wait 5 minutes and then add 1 mL
of Coupling Reagent and then wait for another 10 minutes.
3. Next, add Diazotizing Reagent and Coupling Reagent to each diluted sample extract in the
same order and same reaction times as the standards. Wait for 10 minutes and then measure
3.1
3.2
Document Page
SUMMARY OF RESULTS AND CALCULATIONS:
Table 1: Calibration Data
Concentration
(μm)
Abs 1 Abs 2 Abs 3 Mean
Abs
Std Deviation % RSD
0 0.00 0.00 0.00 0.00 0.00 0.00
2.5 0.1021 0.102 0.1028 0.1023 4.36 x 10⁻⁴ 0.4261
5 0.2246 0.2186 0.2185 0.2206 3.493 x 10⁻³ 1.584
10 0.4259 0.4243 0.4248 0.425 8.19 x 10⁻⁴ 0.1926
15 0.672 0.6674 0.655 0.6648 8.793 x 10⁻³ 1.323
/5
Calibration Graph:
Figure 1: Calibration graph of absorbance at 542 nm against the concentration of nitrite standards
(μm)
y = 0.0441x - 0.0043
R² = 0.9991
-0.2
-0.1
0
0.1
0.2
0.3
0.4
0.5
0.6
0.7
0.8
0.9
-5 0 5 10 15 20
Absorbance at 545 nm
Concentration of nitrite standards (μm)
Calibration graph of absorbance at 542 nm vs.
concentration of nitrite standards (μm)
Document Page
Sample calculations
Table 1: Calibration Data
For Concentration at 2.5 μm
Mean Absorbance:
(0.1021 + 0.102 + 0.1028) / 3 = 0.1023
Standard Deviation:
= √ ((0.1021 – 0.1023)2 + (0.102 0.1023)2 + (0.1028 0.1023)2) / 2
= 4.36 x 10⁻⁴
% RSD = (standard deviation / average) x 100
= (4.36 x 10⁻⁴ / 0.1023) x 100 = 0.4261%
Table 2: Sample Data
For Blank 1:
Average Absorbance:
(-0.0069 + -0.009 + -0.0099) / 3 = -0.0086
Concentration (μm)
From the calibration curve: y = 0.0441x 0.0043
-0.0086 = 0.0441x 0.0043
x = (-0.0086 + 0.0043) / 0.0441 = -0.10
/5
5.1

Secure Best Marks with AI Grader

Need help grading? Try our AI Grader for instant feedback on your assignments.
Document Page
CHM2922 Laboratory Report Name: Nuramira Amran
4 of 8
Table 2: Sample data
Sample Abs1 Abs 2 Abs 3 Mean Abs Conc (μM) Mean Conc (μM) Standard Deviation % RSD
BLANK 1 -0.0069 -0.009 -0.0099 -0.0086 -0.10
BLANK 2 -0.0088 -0.0093 -0.0091 -0.0091 -0.11
BLANK 3 -0.009 -0.0094 -0.0095 -0.0093 -0.11 -0.106 0.008082 -7.601
QC Standard 0.0402 0.0388 0.0387 0.0392 0.99
SUSPECT 1, LEFT A 0.0088 0.0089 0.0096 0.0091 0.20
SUSPECT 1, LEFT B 0.0116 0.0078 0.0066 0.0087 0.29
SUSPECT 1, LEFT C 0.0046 0.0047 0.0044 0.0046 0.30 0.266 0.06 21
SUSPECT 1, RIGHT A -0.0102 -0.0093 -0.0098 -0.0098 -0.12
SUSPECT 1, RIGHT B -0.0102 -0.01 -0.0097 -0.0100 -0.13
SUSPECT 1, RIGHT C -0.0102 -0.0093 -0.0093 -0.0098 -0.12 -0.125 0.002618 -2.087
SUSPECT 2, LEFT A -0.0095 -0.0092 -0.0091 -0.0093 -0.11
SUSPECT 2, LEFT B -0.0096 -0.0098 -0.0099 -0.0098 -0.12
SUSPECT 2, LEFT C -0.008 -0.0087 -0.0099 -0.0089 -0.10 -0.113 0.010225 -9.019
SUSPECT 2, RIGHT A -0.0104 -0.0103 -0.0092 -0.0100 -0.13
SUSPECT 2, RIGHT B -0.0096 -0.0101 -0.0111 -0.0103 -0.14
SUSPECT 2, RIGHT C -0.0093 -0.0095 -0.0103 -0.0097 -0.12 -0.128 0.006428 -4.993
/20
6.1
Document shared on https://www.docsity.com/en/spectroscopy-and-analytical-chemistry-chm2922-lab-reports/8957042/
Downloaded by: dongxiaoma666 (dongxiaoma666@gmail.com)
Document Page
CHM2922 Laboratory Report Name: Nuramira Amran
STATISTICAL ANALYSIS
t-Test: Two-Sample Assuming Unequal Variances
Suspect 1, Left Suspect 2, Left
Mean 0.266 -0.113
Variance 0.00432 0.000208
Observations 2 2
Hypothesized Mean Difference 0
df 1
t Stat 7.59
P(T<=t) one-tail 0.0417
t Critical one-tail 6.31
P(T<=t) two-tail 0.0834
t Critical two-tail 12.7
t-Test: Two-Sample Assuming Unequal Variances
Suspect 1, Right Suspect 2, Right
Mean -0.125 -0.128
Variance 1.028 x 10⁻⁵ 8.256 x 10⁻⁵
Observations 2 2
Hypothesized Mean Difference 0
df 1
t Stat 0.3882
P(T<=t) one-tail 0.3821
t Critical one-tail 6.314
P(T<=t) two-tail 0.7642
t Critical two-tail 12.71
Test between hands of the apparently guilty suspect
t-Test: Two-Sample Assuming Unequal Variances
Guilty Suspect”
Right Hand
Guilty Suspect”
Left Hand
Mean -0.125 0.266
Variance 1.03 x 10⁻⁵ 0.004322
Observations 2 2
7.1
7.2
Document Page
CONCLUSIONS:
Is there any statistically significant difference, at the 95% confidence level for left- and right-
hand samples between suspects?
The null hypothesis of the t-test is Ho: μ12 = 0, which means that there is no difference between the
mean concentrations of nitrite obtained from the two suspects hands while the alternative hypothesis
is Ha: μ12 0, which means that there is a difference between the mean concentration of nitrite
obtained from the two suspects hands. The t-test for the left hand of the two suspects indicate that the
t-statistics is 7.59 and p-value is 0.042, which is smaller than the α = 0.05. And hence, the null
hypothesis is rejected, indicating that there is a difference between the mean concentration of nitrite
from the two suspects hands at 5% level of significance. The t-test for the right hand of the two
suspects determined that the t-statistics is 0.39 and the p-value is 0.38, which indicates that there is
no difference between the mean concentrations of nitrite from the two suspects. This is because the
p-value is larger than the α = 0.05, rejecting the alternative hypothesis. To conclude, at 95%
confidence level, there is a statistical difference between the two mean concentrations of nitrite
between the left hand of the two suspects but there is no statistical difference between the two mean
between the right hands of the two suspects.
Which, if any of your suspects should be charged? There should be statistical proof of guilt for a
charge to be laid.
Suspect 1 should be charged as guilty since the null hypothesis of the t-test for the left hands of the
two suspects was rejected, indicating that there is difference between the mean concentrations of
nitrite. Furthermore, the mean concentration of nitrite that was calculated using the regression
equation that was obtained from the calibration graph also shows that suspect 1’s left hand has the
highest amount of nitrite.
/15
QUESTIONS
1. Briefly describe two criteria you used in selecting the optimum wavelength for
absorbance measurements?
8.1
8.2

Paraphrase This Document

Need a fresh take? Get an instant paraphrase of this document with our AI Paraphraser
Document Page
2. Comment on the accuracy of your results.
Accuracy is defined as how close the obtained result is to the true result. It can be determined
by calculating the %RSD, the lower the value is the more accurate the data that was obtained.
For the calibration data, the %RSD for the concentrations, 0, 2.5, 5, 10 and 15, were 0.00%,
0.43%, 1.58%, 0.19% and 1.32% respectively. Since they are lower than 5%, it means that
the data for the concentration of the nitrite standard is accurate and close to its true value.
Since the calibration data is accurate, the concentration reading for the QC standard which is
determined using the regression equation is accurate as well. The concentration reading for
the QC standard was calculated to be 0.99 μM.
3. As a forensic scientist, you may be required to present and defend your results in court.
What additional (experimental) work could you undertake to ensure that a clever
barrister could not demolish your evidence?
Fingerprint analysis could be the additional work that would ensure that the clever barrister
could not demolish the evidence. This is because according to Hildebrandt et al. (2017),
fingerprint trace is formed by human secretions left by a finger touching a surface. This
would mean it has a part of a persons DNA and this would determine his/her identity.
4. Julian Cleverdrawers, SC, barrister for the defence, in cross examining you, says "You
found nitrite on the defendant's right and left hands, and on those of a number of other
suspects. I put it to you that your results are meaningless and cannot be used as evidence
that my client fired the pistol".
How would you defend the quality your data?
According to the t-test that was performed, it was found that the mean concentration of nitrite was
the highest on the suspect 1’s left hand. Furthermore, the t-test provided data to prove that the
alternative hypothesis, which is that the mean concentration of nitrite between the left hands of
the two suspects were different, was accepted. While the t-test that was performed for the right
hands of the two suspects, proved that the mean concentrations of nitrite are no different from
9.1
9.2
9.3
Document Page
REFERENCES:
Hildebrandt, M., Dittmann, J. and Vielhauer, C., 2017. Capture and Analysis of Latent Marks. In: M.
Tistarelli and C. Champod, ed., Handbook of Biometrics for Forensic Science. [online] Springer,
pp.19-35. Available at: <https://link.springer.com/book/10.1007%2F978-3-319-50673-9#toc>
[Accessed 29 August 2020].
Pentassuglia, S., Agostino, V. and Tommasi, T., 2018. EABElectroactive Biofilm: A
Biotechnological Resource. In: K. Wandelt, ed., Encyclopedia of Interfacial Chemistry. [online]
Elsevier, pp.110-123. Available at:
<https://www.sciencedirect.com/science/article/pii/B9780124095472134614> [Accessed 27 August
2020].
/4
Total Report Mark /90
10.1
Document Page
Index of comments
3.1 more details about UV-vis
mention wavelength
3.2 past tense
passive form
5.1 your abs has to deduct from reagent blank to obtain the actual sample reading
6.1 calculated conc is wrong as (problem as mentioned)
7.1 Incorrect p values
7.2 5/5
8.1 0/5
p value mentioned here doesnt correspond to your t-test table
your explanation is right but your reported value doesnt correspond to the value reported here
8.2 Again, your answer is right but your p value showing p>0.05
8.3 1/5
-signal to noise ratio?
9.1 0/5
RE calculation is based on 5uM standard and its absorbance (0.2179) reading obtained from UV and
calculated using your cal curve equation
9.2 2/5
-measure other components of gunshot residues (i.e. antimony)
-measure nitrate using another method?
9.3 0/5
-more statistical components required
-sampling population
10.1 2/4
at least 4 ref

Secure Best Marks with AI Grader

Need help grading? Try our AI Grader for instant feedback on your assignments.
Document Page
SCHOOL OF SCIENCE
ASSESSMENT COVER SHEET
Student’s name (Surname) (Given names)
ID number Phone
Unit name Unit code
t
Note: If this is a group assignment, please include the names of all other group members.
Title of assignment
Lecturer/tutor
Is this an authorised group assignment? Yes No
Has any part of this assignment been previously submitted as part of another unit/course? Yes No
Tutorial/laboratory day & time
Due date Date submitted
All work must be submitted by the due date. If an extension of work is granted this must be specified with the signature of the
lecturer/tutor.
Extension granted until (date) ................................ Signature of lecturer/tutor .................................................
Please note that it is your responsibility to retain copies of your assessments.
Intentional plagiarism or collusion amounts to cheating under Monash University Statute 4.1 Student Discipline.
Plagiarism: Plagiarism means to take and use another person’s ideas and or manner of expressing them and to pass these off as
one’s own by failing to give appropriate acknowledgement, including the use of material from any source, staff, students or the
internet, published and unpublished works.
Collusion: Collusion means unauthorised collaboration on assessable written, oral or practical work with another person.
Where there are reasonable grounds for believing that intentional plagiarism or collusion has occurred, this will be reported to the
Associate Dean (Education) or nominee, who may disallow the work concerned by prohibiting assessment or refer the matter to
the Faculty Discipline Panel for a hearing.
Student Statement:
I have read the university’s Student Academic Integrity Policy and Procedures.
I understand the consequences of engaging in plagiarism and collusion as described in University Statute 4.1 Student
Discipline, Part 2 Misconduct http://adm.monash.edu/legal/legislation/statutes/statute4-1-student-discipline.pdf .
I have taken proper care to safeguard this work and made all reasonable efforts to ensure it could not be copied.
No part of this assignment has been previously submitted as part of another unit/course.
I acknowledge and agree that the assessor of this assignment may for the purposes of assessment, reproduce the assignment
and:
Document Page
RISK ASSESSMENT
Name: Nuramira Amran
Lab Course details (e.g. CHM
2922)
CHM2922 Date 3/10/2020
Experiment name and number Experiment 7: Fluoride Analysis by Ion Selective Electrode
Identify the HAZARD
(the POTENTIAL to do harm)
Determine the RISK
(the PROBABILITY that harm may
result)
CONTROL the Risk
(PREVENTING an incident)
Al2(SO4)3 Causes eye irration Handle in fumehood. Wear
protective gloves and goggles
1 mg/L Fluoride QC standard Causes skin and eye irritation. Handle in fumehood. Wear
protective gloves and goggles.
0.1 M EDTA Causes serious eye irritation. Handle in fumehood. Wear
protective gloves and goggles.
4 M NaCl Causes skin and eye irritation. Handle in fumehood. Wear
protective gloves and goggles.
2M NaOH Causes severe skin burns and
eye damage.
Handle in fumehood. Wear
protective gloves and goggles.
Total Ionic Strength Buffer
(TISAB) Causes eye damage. Handle in fumehood. Wear
protective gloves and goggles.
Glassware Cuts, stab wound from sharp
edges
Handle with care, dispose of
broken glass using a dustpan &
brush. If cut, see demonstrator.
Document Page
Name: Nuramira Amran
Session: 2PM
Date: 20/9/2020
Provide explanations for your observations below. Total mark/20
1. Effect of adding Al2(SO4)3, followed by the addition of EDTA Mark/5
2. Effect of adding NaCl Mark/5
3. Effect of adding 2M NaOH Mark/5
Initially, the potential of the QC standard was 80 and then after adding the aluminium sulphate, the potential incre
seconds after the addition of aluminium sulphate, the potential decreased to 150. It later dropped even more to 90 a
of aluminium ions causes an interference for the fluoride determination and EDTA is used to lower the interferenc
potential.
The potential decreased from 80 to -50 after the addition of NaOH. This is because OH- is a major
The potential increased from 79 to 95 after the addition of NaCl. The addition of NaCl is not supposed to have a inte
fluoride electrode is from the OH ions.
3.1
3.2
3.3
3.4

Paraphrase This Document

Need a fresh take? Get an instant paraphrase of this document with our AI Paraphraser
Document Page
4. TISAB buffer is a solution made up of CDTA (a compound similar to EDTA but with faster kinetics), 4M NaCl, and has a pH of 5 - 5.5. What are the rea
measuring Fluoride concentration using an ISE? Mark /5
Reference
Švarc-Gajić, J., Stojanović, Z., Vasiljević, I. and Kecojević, I., 2013. Determination of fluorides in pharmaceutical products for o
Journal of Food and Drug Analysis, [online] 21(4), pp.384-389.
Available at: <https://www.sciencedirect.com/science/article/pii/S1021949813000537> [Accessed 27 September 2020].
Total ionic strength adjustment buffer, also known as TISAB, reduces the interference that are from OH- ions by ad
formation between H+ and F- in acidic solutions". It would also be used to reduce the interference that are from po
Vasiljević and Kecojević, 2013).
4.1
Document Page
Name: Mark breakdown:
Session: 2PM Date:
Cal curve R2 Value /4
Calibration - Enter mean values to check calibration %RSD of samples /9
Standard Number
[F-] (M) log [F-] Mean E (mV)
1 1.0E-02 -2.00 -40.0 %RE of QC /9
2 1.0E-03 -3.00 16.7 ALL POINTS 1.E-05 M
3 1.0E-04 -4.00 75.7 Slope = -42.5 -56.2 Calculation of F in toothpaste /10
4 1.0E-05 -5.00 127.7 Intercept = -108.1 -151.7
5 1.0E-06 -6.00 154.0 r2 = 0.949 0.999 Answer to question /8
6 1.0E-07 -7.00 164.7
Samples - Enter sample data to calculate concentrations
ALL DATA POINTS
Sample Mean E Mean [F-] mgF-/L
QC 76.33 4.57E-05 0.87 Remember to show below how you calculated:
Tap Water 90.33 2.14E-05 0.41 1. a concentation from an E value
Unknown 10.00 1.66E-03 31.57 2. the %error in the standard reference material (QC)
Experiment 7 - ISE Student proforma Parts 2 & 3: Data Analysis.
Marked /40
Nuramira Amran
y = -42.495x - 108.12
R² = 0.9493
y = -56.201x - 151.7
R² = 0.9994
-100.0
-50.0
0.0
50.0
100.0
150.0
200.0
250.0
-8.00 -7.00 -6.00 -5.00 -4.00 -3.00 -2.00 -1.00 0.00
Potential difference (V)
log[F-]
Chart Title
5.1
5.2
Document shared on https://www.docsity.com/en/spectroscopy-and-analytical-chemistry-chm2922-lab-reports/8957042/
Downloaded by: dongxiaoma666 (dongxiaoma666@gmail.com)
Document Page
Seawater 10.00 1.66E-03 31.57 3. the %RSD from your replicates
Toothpaste 58.67 1.19E-04 2.3 4. the % of F in toothpaste
EXCL <1.E-05
Sample Mean E Mean [F-] mgF-/L Remember to answer the question below
QC 76.33 8.76E-05 1.66
Tap Water 90.33 4.94E-05 0.94
Unknown 10.00 1.33E-03 25.21
Seawater 10.00 1.33E-03 25.21 undiluted
Toothpaste 58.67 1.81E-04 3.4 343.2131964
Your calculations:
Standards
[F] reading 1 reading 2 reading 3 mean std
1x10
-2 M -39 -43 -38 -40 2.645751311
1x10
-3 M 17 19 14 16.66666667 2.516611478
1x10
-4 M 73 75 79 75.66666667 3.055050463
1x10
-5 M 130 126 127 127.6666667 2.081665999
1x10⁻⁶ M 151 152 159 154 4.358898944
1x10
-7 M 166 163 165 164.6666667 1.527525232
QC 75 76 78 76.33333333 1.527525232
Tapwater 90 92 89 90.33333333 1.527525232
Toothpaste 60 55 61 58.66666667
QC 1.00E-04
F- 1 F- 2 F- 3 Mean Standard Deviation %RSD
QC 4.91773E-05 4.65838E-05 4.18E-05 4.58537E-05 3.74244E-06 8.161702472
Tapwater 2.18184E-05 1.95778E-05 2.30331E-05 2.14765E-05 1.75285E-06 8.161702472
Toothpaste 0.000110842 0.000145329 0.000104997 0.00012039 2.17953E-05 18.1039765
F- 1 F- 2 F- 3 Mean Standard Deviation %RSD % F SRM
QC 9.25222E-05 8.88082E-05 8.18213E-05 8.77172E-05 5.43325E-06 6.19405007 1.23E+01
Tapwater 5.00434E-05 4.61063E-05 5.21363E-05 4.94287E-05 3.06164E-06 6.19405007
Toothpaste 0.000171059 0.000209948 0.000164192 0.000181733 2.4675E-05 13.57761417 0.343213196
Measured electrode potential (mV)
All Data Points
EXCL < 1.E-0.5
One of them shows the calibration graph that is
between the log of the concentration value and
the potential differences for the different
concentration values of fluoride standard
solutions. While the other shows the calibration
graph that complies with the Nernst equation by
having concentrations of 10-5, 10-6 and 10-7
removed.
Answers to question:
Why are two calibration curves drawn?
6.1
Document shared on https://www.docsity.com/en/spectroscopy-and-analytical-chemistry-chm2922-lab-reports/8957042/
Downloaded by: dongxiaoma666 (dongxiaoma666@gmail.com)

Secure Best Marks with AI Grader

Need help grading? Try our AI Grader for instant feedback on your assignments.
Document Page
Questions to Parts 2 and 3
Question 1 Mark
Discuss the calibaration curve in terms of the Nernst equation. What is the signifiance of the gradient?
List three factors which would contribute to departure from Nernstian behaviour.
/10
Question 2
Provide as many error sources in your calibration of the ISE as you can (up to five).
/10
The calibration graph does adheres to the Nernst equation because the plot for the concentrations
of 10-2 to 10-5 shows linearity while the plot for the concentrations of 10-6 and 10-7 would be
away from the trendline. Furthermore, the r2 for the calibration graph is 0.9994. The Nernst
equation that was used during this experiment was: E(mv) = k - 59.2log [F-] in the form of y =
mx + c. According to the equation, a negative gradient is expected to be observed. This is also
observed in the regression equation that is obtained from the calibration graph. The equation that
was obtained was y = -56.201x - 151.7. The factor that would contribute to the departure from
Nernstian behaviour would be when the electrode potential does not obey the Nernst equation
when the concentration changes. This can be detected when the concentration that is plotted is
away from the trendline.
One possible source of error could be stirring the sample using the electrode, which would affect
the ion selective membrane and hence disrupting the reading.
7.1
7.2
Document shared on https://www.docsity.com/en/spectroscopy-and-analytical-chemistry-chm2922-lab-reports/8957042/
Downloaded by: dongxiaoma666 (dongxiaoma666@gmail.com)
Document Page
Question 3
Compare your determined value of fluoride with the manufacturer's claimed value. Discuss sources of error
/10
Total /30
According to the toothpaste manufacturer, the fluoride content is 1000 ppm, which is
equivalent to 1000 mg F/L. The amount that was calculated during the experiment was
343.21 mg F/L. This is much lower than the value that was provided from the
manufacturer. The difference might not be accurate because the %RE was 12.28%,
which would suggest that there might be some discrepancies.
Powered by TCPDF (www.tcpdf.org)
8.1
Document shared on https://www.docsity.com/en/spectroscopy-and-analytical-chemistry-chm2922-lab-reports/8957042/
Downloaded by: dongxiaoma666 (dongxiaoma666@gmail.com)
Document Page
Index of comments
3.1 10/20
3.2 3/5
The description of causes an interference is too general. How Al3+ interfere? It binds to which ions? Same goes to EDTA, what does it bind to and lead to what kind
of changes? Discuss the kinetics of EDTA reaction as well.
3.3 0/3
Again, the explanation is too general. Explain about the ionic effect NaCl was added. How does it change the E?
3.4 3/5
mention the size of OH- and how does it interfere F-?
4.1 4/5
how about the role of CDTA?
5.1 17/30
5.2 - %RSD of sample should be <5%
- %RE? Where is the calculation?
- show the calculation for % [F]
6.1 So which curve is correct? explain the curvature and detection limit of ISE.
7.1 - how about the effect of temperature?
7.2 Give 4 more sources of error
8.1 discuss what are the possible reasons that caused the error
Powered by TCPDF (www.tcpdf.org)
Document shared on https://www.docsity.com/en/spectroscopy-and-analytical-chemistry-chm2922-lab-reports/8957042/
Downloaded by: dongxiaoma666 (dongxiaoma666@gmail.com)

Paraphrase This Document

Need a fresh take? Get an instant paraphrase of this document with our AI Paraphraser
Document Page
SCHOOL OF SCIENCE
ASSESSMENT COVER SHEET
Student’s name (Surname) (Given names)
ID number Phone
Unit name Unit code
t
Note: If this is a group assignment, please include the names of all other group members.
Title of assignment
Lecturer/tutor
Is this an authorised group assignment? Yes No
Has any part of this assignment been previously submitted as part of another unit/course? Yes No
Tutorial/laboratory day & time
Due date Date submitted
All work must be submitted by the due date. If an extension of work is granted this must be specified with the signature of the
lecturer/tutor.
Extension granted until (date) ................................ Signature of lecturer/tutor .................................................
Please note that it is your responsibility to retain copies of your assessments.
Intentional plagiarism or collusion amounts to cheating under Monash University Statute 4.1 Student Discipline.
Plagiarism: Plagiarism means to take and use another person’s ideas and or manner of expressing them and to pass these off as
one’s own by failing to give appropriate acknowledgement, including the use of material from any source, staff, students or the
internet, published and unpublished works.
Collusion: Collusion means unauthorised collaboration on assessable written, oral or practical work with another person.
Where there are reasonable grounds for believing that intentional plagiarism or collusion has occurred, this will be reported to the
Associate Dean (Education) or nominee, who may disallow the work concerned by prohibiting assessment or refer the matter to
the Faculty Discipline Panel for a hearing.
Student Statement:
I have read the university’s Student Academic Integrity Policy and Procedures.
I understand the consequences of engaging in plagiarism and collusion as described in University Statute 4.1 Student
Discipline, Part 2 Misconduct http://adm.monash.edu/legal/legislation/statutes/statute4-1-student-discipline.pdf .
I have taken proper care to safeguard this work and made all reasonable efforts to ensure it could not be copied.
No part of this assignment has been previously submitted as part of another unit/course.
I acknowledge and agree that the assessor of this assignment may for the purposes of assessment, reproduce the assignment
and:
Document Page
RISK ASSESSMENT
Name: Nuramira Amran
Lab Course details (e.g. CHM
2922)
CHM2922 Date 18/10/2020
Experiment name and number Experiment 4: Measuring Chloride in Marine Water Using
Fluorescence Quenching
Identify the HAZARD
(the POTENTIAL to do harm)
Determine the RISK
(the PROBABILITY that harm may
result)
CONTROL the Risk
(PREVENTING an incident)
Sulfuric Acid Causes severe skin burns and
serious eye damage.
Handle in fumehood. Wear
protective gloves and goggles
Quinine Sulphate
Causes skin, serious eye
irritation and respiratory
irritation.
Handle in fumehood. Wear
protective gloves and goggles.
Chloride Harmful if swallowed or
inhaled.
Handle in fumehood. Wear
protective gloves and goggles.
NaCl Causes skin irritation and eye
damage.
Handle in fumehood. Wear
protective gloves and goggles.
Glassware Cuts, stab wound from sharp
edges
Handle with care, dispose of
broken glass using a dustpan &
brush. If cut, see demonstrator.
Document Page
CHM2922 Laboratory Report Name
EXPERIMENT 4:
PROFORMA FOR MEASURING CHLORIDE IN MARINE WATER BY FLUORESCENCE
QUENCHING
AIM:
To determine the concentration of chloride in a marine water sample using fluorescence
quenching of quinine sulphate.
Investigate if pH changes affect the quantitative analysis of quinine sulphate content and if
so, how you can improve the accuracy of measurements.
/1
OUTLINE OF THE METHOD:
To prepare the standard solution, 0.1000 g quinine sulphate was dissolved with water in a 1L
volumetric flask and then was sonicated for a few minutes to assist dissolution of the solid. Next,
10mg/L quinine sulphate standard solution was prepared using the correct amount of sulfuric acid,
making sure that the solution has a pH of 3. The fluorescence cell was filled not to the brink. In order
to measure the chloride in seawater samples, six solutions containing 0, 50, 100, 300, 1000 and 2000
mg/L chloride, 5 mg/L quinine sulphate and the correct amount of 0.05 M sulfuric acid was prepared.
Next, 5 mL of unknown chloride solution was pipetted into a 100 mL volumetric flask, also ensuring
that the solution also contains 5 mg/L quinine sulphate and the correct amount of 0.05 M sulfuric
acid. It is then diluted to the mark with deionized water. This procedure was repeated triplicated. The
fluorescence emission spectrum was recorded for one of the triplicates. Once the spectra were
measured at each of the [Cl-] conditions, use the point measurement function for the other two
replicate solutions. The instrument must be zeroed before each reading or run a control measurement
of the fluorescence of a sulfuric acid solution at pH 3 under the same conditions and subtract any
3.1

Secure Best Marks with AI Grader

Need help grading? Try our AI Grader for instant feedback on your assignments.
Document Page
ANSWER THE FOLLOWING QUESTIONS: /12
Q1. For a quinine solution (exposed to air) vs that of the similar solution which has been
bubbled with nitrogen gas for several minutes, is there any difference in the fluorescence
readings? Why?
No, because according to Lakowicz (1999), fluorescence quenching “refers to any process which
decreases the fluorescence intensity of a sample”. Bubbling nitrogen through the solution when
measuring the fluorescence would avoid the quenching effect of oxygen (Williams and Bridges,
1964).
VIDEO: Watch the video on fluorescence and answer the following question.
http://www.youtube.com/watch?v=CcssdJf0pKQ (First 5 minutes, but the rest is interesting,
too.).
Q2. Explain why the UV and green lasers produced fluorescence when shone through the
yellow dye but the red laser did not.
The fluorescence is produced when the energy of the light that is emitted has a lower energy than the
light that is absorbed. The red laser did not shine through the yellow because it needs light of higher
energy like violet and green for it to glow. This is because the yellow light has a higher energy when
compared to the red light and so it can’t excite the dye. The UV light can shine through the yellow
dye because it’s the highest easily accessible light and so it could activate most dyes.
Q3. How do you measure quinine sulphate concentration using fluorescence method? What is
the one important factor that you need to control in order to obtain accurate result?
In order to obtain an accurate result, the optimum pH of the solution must be maintained at 3. This is
because the fluorescence spectrum for quinine sulphate is pH dependent and if the pH increases, then
the lambda max of the spectrum would be lower than when it is pH 3, which is when the fluorescence
intensity is the highest.
4.1
4.2
4.3
Document Page
SUMMARY OF RESULTS AND CALCULATIONS
1: Attach the spectra of quinine sulphate emission in presence of Cl- (including title and
correctly labelled axes) (Choose one without chloride and one with chloride)
/2
Figure 1: Spectra of quinine sulphate emission without the presence of Cl-
0
200
400
600
800
1000
1200
300 350 400 450 500 550 600 650
Intensity
Wavelength (nm)
Triplicate runs 0 mg Cl added to 5.0 mg/L Quinine sulphate at pH 3
0 mg rep 2 0mg rep 1 0 mg rep 3
300
400
500
600
700
800
Intensity
Triplicate runs 50 mg Cl added to 5.0 mg/L Quinine sulphate at pH 3
Document Page
2: Calibration data
pH of the standard solutions:
Cl- Conc
(mol/L)
Cl- Conc
(mg/L)
Reading
1
Reading
2
Reading
3
Mean F SD %RSD Fo/F Error in
Fo/F
0.0000
0 977.9 971.9 971.7 973.8 3.5 0.4 1.0 0.0
0.0014
50 663.4 669.2 668.6 667.1 3.2 0.5 1.5 9.0 x 10⁻³
0.0028
100 466.3 469.2 468.0 467.8 1.5 0.3 2.1 0.01
0.0085
300 274.6 274.8 276.8 275.4 1.2 0.4 3.5 0.02
0.0282
1000 105.7 106.9 106.8 106.5 0.7 0.6 9.1 6.6 x 10⁻²
0.0563
2000 57.8 58.3 57.6 57.9 0.7 0.6 16.8 0.1
Sea Water 1 107.9 105.9 107.7 107.2 1.1 1.0 9.1 9.9 x 10⁻²
Sea Water 2 129.9 127.8 125.8 127.8 2.1 1.6 7.6 0.1
Quality Control 51.2 50.8 50.9 51.0 0.2 0.4 19.1 0.1
/15
3: Stern-Volmer Plot:
y = 279.47x + 1.1473
R² = 0.9996
4.000
6.000
8.000
10.000
12.000
14.000
16.000
18.000
Fo/F

Paraphrase This Document

Need a fresh take? Get an instant paraphrase of this document with our AI Paraphraser
Document Page
4: Calculation of Stern-Volmer Constant KSV, quenching constant kq, and [Cl-]:
Calculate KSV from the gradient of your S-V plot. Remember to take care of units! (Hint:
Express units as M-1.)
Converting concentration of Cl- from mg/L to mol/L:
For 50 mg/L of Cl-:
50 mg/L = (0.05 g/ 1L) x (1/35.5 gmol-1) = 0.0014 mol/L
Regression equation from plot: y = 279.47x + 1.1473
KSV = 279.47 mol/L
/8
Calculate kq from KSV using the fluorescence lifetime of quinine. Again, take care of units!
KSV = kqt0
KSV = 279.47 mol/L
t0 = 18.9 x 10⁻⁹ seconds
279.47 = kq x 18.9 x 10⁻⁹
kq = (279.47/18.9 x 10-9) = 1.48 x 10¹⁰ L/mol s-1
/8
Calculate the [Cl-] in seawater sample and the Quality Control sample using the gradient of
your S-V plot. Remember to take care of units!
Using the regression equation from Figure 1:
y = 279.47x + 1.1473
F0/F = 279.47 x (Concentration of chloride in seawater sample) + 1.1473
For Seawater Sample 1:
9.1 = 279.47 x (Concentration of chloride) + 1.1473
Concentration of chloride = (9.1 1.1473) / 279.47 = 0.028 mol/L
7.1
Document Page
What is the %RE of the quenching method?
Known concentration of chloride in QC = 2000 mg/L
Converting mg/L to molarity = 2 x (1/35.5) = 0.05633 mol/L
% RE = ((measured concentration original concentration) / original concentration) x 100 =
= ((0.064 0.056) / 0.056) x 100 = 14.29 %
The %RE is quite high, which would indicate that the measurement is not very accurate. This might
be due to some errors that might have happened during the experiment.
/9
References:
Lakowicz, J., 1999. Principles Of Fluorescence Spectroscopy. New York, NY: Springer, pp.237-265.
Williams, R. T., & Bridges, J. W., 1964. Fluorescence of solutions: a review. Journal of clinical
pathology, 17(4), 371394. https://doi.org/10.1136/jcp.17.4.371
/2
Total Mark /90
PLEASE COMPLETE RISK ASSESSMENTS AND ATTACHED A RISK ASSESSMENT FORM AT THE END OF
THIS REPORT. 3 MARKS WILL BE DEDUCTED FOR NOT DOING SO.
8.1
Document Page
Index of comments
3.1 at what wavelength?
4.1 O2 has quenching effect thus reducing the reading
4.2 UV and green lasers have sufficient energy to excite electronically the dye molecule to excited state(s) which
can relax to ground state to give colour of lower energy (yellow light) ( 2 marks)
4.3 First a calibration plot is prepared using standard quinine sulphate solutions, and the fluorescence intensity at
450 nm (or any wavelenght near to it) is measued (using 350 nm as excitation wavelength). The fluorescence
of the unknown solution at the same pH is measured which can then be used to dtermine its concentration ( 2
marks).
7.1 wrong units
8.1 at least 2 refs

Secure Best Marks with AI Grader

Need help grading? Try our AI Grader for instant feedback on your assignments.
Document Page
SCHOOL OF SCIENCE
ASSESSMENT COVER SHEET
Student’s name (Surname) (Given names)
ID number Phone
Unit name Unit code
t
Note: If this is a group assignment, please include the names of all other group members.
Title of assignment
Lecturer/tutor
Is this an authorised group assignment? Yes No
Has any part of this assignment been previously submitted as part of another unit/course? Yes No
Tutorial/laboratory day & time
Due date Date submitted
All work must be submitted by the due date. If an extension of work is granted this must be specified with the signature of the
lecturer/tutor.
Extension granted until (date) ................................ Signature of lecturer/tutor .................................................
Please note that it is your responsibility to retain copies of your assessments.
Intentional plagiarism or collusion amounts to cheating under Monash University Statute 4.1 Student Discipline.
Plagiarism: Plagiarism means to take and use another person’s ideas and or manner of expressing them and to pass these off as
one’s own by failing to give appropriate acknowledgement, including the use of material from any source, staff, students or the
internet, published and unpublished works.
Collusion: Collusion means unauthorised collaboration on assessable written, oral or practical work with another person.
Where there are reasonable grounds for believing that intentional plagiarism or collusion has occurred, this will be reported to the
Associate Dean (Education) or nominee, who may disallow the work concerned by prohibiting assessment or refer the matter to
the Faculty Discipline Panel for a hearing.
Student Statement:
I have read the university’s Student Academic Integrity Policy and Procedures.
I understand the consequences of engaging in plagiarism and collusion as described in University Statute 4.1 Student
Discipline, Part 2 Misconduct http://adm.monash.edu/legal/legislation/statutes/statute4-1-student-discipline.pdf .
I have taken proper care to safeguard this work and made all reasonable efforts to ensure it could not be copied.
No part of this assignment has been previously submitted as part of another unit/course.
I acknowledge and agree that the assessor of this assignment may for the purposes of assessment, reproduce the assignment
and:
Document Page
RISK ASSESSMENT
Name: Nuramira Amran
Lab Course details (e.g. CHM
2922)
CHM2922 Date 25/10/2020
Experiment name and number Experiment 5: Identifying Adulterants and Contaminants in Food and
Drugs Using FTIR and Raman Spectroscopy
Identify the HAZARD
(the POTENTIAL to do harm)
Determine the RISK
(the PROBABILITY that harm may
result)
CONTROL the Risk
(PREVENTING an incident)
Salicylic Acid Harmful if swallowed. Causes
serious eye damage.
Handle in fumehood. Wear
protective gloves and goggles
Paracetamol Harmful if swallowed. Causes
skin and serious eye irritation.
Handle in fumehood. Wear
protective gloves and goggles.
Methyl Salicylate Harmful if swallowed. Causes
eye and skin irritation.
Handle in fumehood. Wear
protective gloves and goggles.
Caffeine Harmful if swallowed. Handle in fumehood. Wear
protective gloves and goggles.
Aspirin Harmful if swallowed. Causes
skin and serious eye irritation.
Handle in fumehood. Wear
protective gloves and goggles.
Glassware Cuts, stab wound from sharp
edges
Handle with care, dispose of
broken glass using a dustpan &
brush. If cut, see demonstrator.
Document Page
CHM2922 Laboratory Report Name
Experiment 5: Identifying Adulterants and Contaminants in Food
and Drugs using FTIR and Raman Spectroscopy
Aim:
Identify contaminants in aspirin and paracetamol sold in supermarkets.
/2
OBJECTIVES:
According to Olubiyi et al. (2015), Raman spectroscopy is a spectroscopic technique used to detect
vibrational, rotational and other states in a molecular system, capable of probing the chemical
compositions of materials.
According to Jadhav et al. (2013), infrared spectroscopy (FTIR) is defined as chemically specific
analysis technique that identifies the chemical bonding or molecular structure of materials, based on
absorption in the infrared region of the electromagnetic spectrum.
/2
SUMMARY OF RESULTS
Table 1: IR and Raman band assignments of Salicylic acid
IR(cm-1) Raman (cm-1) Assignment
3050 (m), 3080(m)
1652 (m)
1030 (m)
757 (s)
3228 (s, br)
3032 (s), 3068 (vs)
1631 (m)
1032 (vs)
772 (vs)
3077 (w)
v (CH)
v (C=O)
(CH)
(=C-H)
v (O-H)
a Relative intensities: v very; s strong; m medium; w weak; sh shoulder; br broad.
3.1

Paraphrase This Document

Need a fresh take? Get an instant paraphrase of this document with our AI Paraphraser
Document Page
Table 2: IR and Raman band assignments for Aspirin
IR(cm-1) Raman (cm-1) Assignment
1083 (s)
1752 (s)
3281 (m)
755 (m)
1045 (s)
1751 (w)
3096 (m)
784 (m)
v (C-O)
v (C=O)
v (CH)
(=C-H)
Table 3: IR and Raman band assignments for Paracetamol
IR(cm-1) Raman (cm-1) Assignment
3159 (br, m), 3108 (m)
1610 (m)
3321 (m)
1226 (s)
3105 (m), 3065 (m)
1610 (m)
1238 (s)
v (C-H)
(N-H)
v (O-H)
v (C-O)
Table 4: IR and Raman band assignments for Caffeine
IR(cm-1) Raman (cm-1) Assignment
1480 (m)
1239 (mw)
744 (vs)
1646 (s)
1361 (vs)
1329 (s)
740 (m)
1697 (mw)
v (-C-H)
v (C-N)
(=C-H)
v (C=O)
Table 5: IR and Raman band assignments for Acetyl Salicylate
4.1
4.2
4.3
Document Page
Table 6: IR and Raman band assignments for Methyl Salicylate
IR(cm-1) Raman (cm-1) Assignment
3179 (br)
1674 (vs)
1211 (vs), 1194 (s)
1440 (mw)
2963 (w)
1677 (mw)
1252 (m)
1440 (w)
v (O-H)
(C=O)
v (C-O)
v (C=C)
/36
Table 7: IR and Raman band for Unknown 1
IR(cm-1) Raman (cm-1) Mode
1681 (m)
1606 (s)
1185 (vs)
916 (vs)
1648 (mw)
1608 (s)
1169 (m)
858 (vs)
v

v
v
Table 8: IR and Raman band for Unknown 2:
IR(cm-1) Raman (cm-1) Mode
1650 (s)
1185 (vs)
837 (s)
745 (vs)
1607 (s)
1169 (m)
858 (s)
785 (s)
v
v

v
Table 9: IR and Raman band assignments for Unknown 3
IR(cm-1) Raman (cm-1) Mode
5.1
5.2
5.3
5.4
5.5
Document Page
CONTENTS OF THE THREE UNKNOWN MIXTURES (with a brief explanation)
/12
Unknown 1 was found to be a mixture of alkyl halide (C-F), alkene (=C-H & C=C) and amide (N-H)
that contains carbonyl because the peaks at 1185 cm-1, 916 cm-1, 1606 cm-1 and 1681 cm-1 , are within
the range of characteristic absorptions, matches the type of vibration and the intensity of the mixture
of the functional groups.
Unknown 2 was found to be a mixture of alkene (=C-H), alkyl halide (C-Cl), ether (C-O) and amide
(C=O) that contains carbonyl because the peaks on IR spectrum at 837 cm-1, 745 cm-1, 1185 cm-1 and
1650 cm-1 , are within the range of characteristic absorptions, matches the type of vibration and the
intensity of the mixture of the functional groups.
Unknown 3 was found to be a mixture of alkene (=C-H), aromatic ring (C=C), amide (C=O), alkyl
halide (C-Cl) and amine (C-N) because the peaks on the IR spectrum at 756 cm -1, 1440 cm-1, 1651
cm-1, 658 cm-1 and 1185 cm-1 are within the range of characteristic absorptions. It also coincides with
the type of vibration and the intensity of the functional groups.
QUESTIONS /8
1. Analgesics do not contain just an active ingredient but may contain other materials as
well. How will you argue that a particular peak on an IR or Raman spectrum belongs
to a suspected contaminant rather than to a legitimate ingredient?
There are two regions in an IR spectrum, a functional group region and the fingerprint region. The
fingerprint region, which is a range in the IR spectrum (1500 400 cm-1) that represents the
characteristic of molecular symmetry or combination bands. The functional group region is a region
(4000 1500 cm-1) that is unique to a specific kind of functional group. A legitimate ingredient would
have peaks in these regions, which would distinguish them from the contaminants.
2. Besides IR and Raman spectroscopy, briefly describe an analytical method that would
6.1
6.2

Secure Best Marks with AI Grader

Need help grading? Try our AI Grader for instant feedback on your assignments.
Document Page
REFERENCE
Argenta, D., Martelli, S. and Caon, T., 2019. Dendrimer as a platform for drug delivery in the skin.
In: A. Holban and A. Grumezescu, ed., Materials for Biomedical Engineering. [online] Elsevier,
pp.331-367.
Jadhav N., Yan M., Vetter C.A., Kasisomayajula S.V., Gelling V.J., 2013. Infrared Spectroscopy
(IR). In: Wang Q.J., Chung YW. (eds) Encyclopedia of Tribology. Springer, Boston, MA.
https://doi.org/10.1007/978-0-387-92897-5_1226
Olubiyi, O., Lu, F., Calligaris, D., Jolesz, F. and Agar, N., 2015. Advances in Molecular Imaging for
Surgery. In: A. Golby, ed., Image-Guided Neurosurgery. [online] Academic Press, pp.407-439.
Available at: <https://www.sciencedirect.com/science/article/pii/B9780128008706000170>
[Accessed 26 October 2020].
Total Mark /90
PLEASE COMPLETE RISK ASSESSMENTS AND ATTACHED A RISK ASSESSMENT FORM AT THE END OF
THIS REPORT. 3 MARKS WILL BE DEDUCTED FOR NOT DOING SO.
Document Page
Index of comments
3.1 IR
1291-1030: v(C-O)
4.1 1 more IR peak required.
2500-3350: v(OH)
4.2 IR
3322: v(NH)
3350-3000: v(OH)
1610: v(C=C)
4.3 1 more IR peak required.
1480: d(CH3)
1646: v(C=N)
4.4 1 more IR peak required.
1183: v(C-O)
5.1 IR
1439: d(CH)
5.2 missing some important bands
5.3 1562.7
5.4 missing some important bands
5.5 missing some important bands
5.6 missing some important bands
5.7 missing some important bands
6.1 You should identify the name of compound (e.g. does it contain aspirin? paracetamol? etc.), not the structure
that present in the compound.
6.2 4/4
6.3 2/4
Before MS analysis, the dissolved drug samples can be separated through LC first.
1 out of 66
circle_padding
hide_on_mobile
zoom_out_icon
[object Object]

Your All-in-One AI-Powered Toolkit for Academic Success.

Available 24*7 on WhatsApp / Email

[object Object]