Analyzing the Impact of Climate Change on Global Economies
VerifiedAdded on 2020/07/22
|35
|5829
|59
AI Summary
This case study delves into the consequences of climate change on global economies. It explores the relationship between rising temperatures, extreme weather events, and economic growth, highlighting the need for sustainable policies to mitigate these effects.
Contribute Materials
Your contribution can guide someone’s learning journey. Share your
documents today.
SPSS ANALYSIS
Secure Best Marks with AI Grader
Need help grading? Try our AI Grader for instant feedback on your assignments.
TABLE OF CONTENTS
Relationship between anxiety and cognitive inhibition control in case of yound and elderly
adults1
Anxiety level and Simon task......................................................................................................1
Anxiety level and Go, no go........................................................................................................2
Anxiety level and Stroop.............................................................................................................3
High anxiety will cause poorer cognitive inhibition........................................................................5
Coorelation interpretation................................................................................................................5
APPENDIX......................................................................................................................................7
...................................................................................................................................................10
Relationship between anxiety and cognitive inhibition control in case of yound
and elderly adults
Simon task
Anxiety level and Simon task
Simon task is the test that is conducted to identify rate at which response given by an
individual in respect to stimulus factors in accurate manner. By considering anxiety factor rate of
response is measured in respect to stimulus in terms of accuracy. Means that impact on anxiety
on response time and accuracy level is measured by using this test.
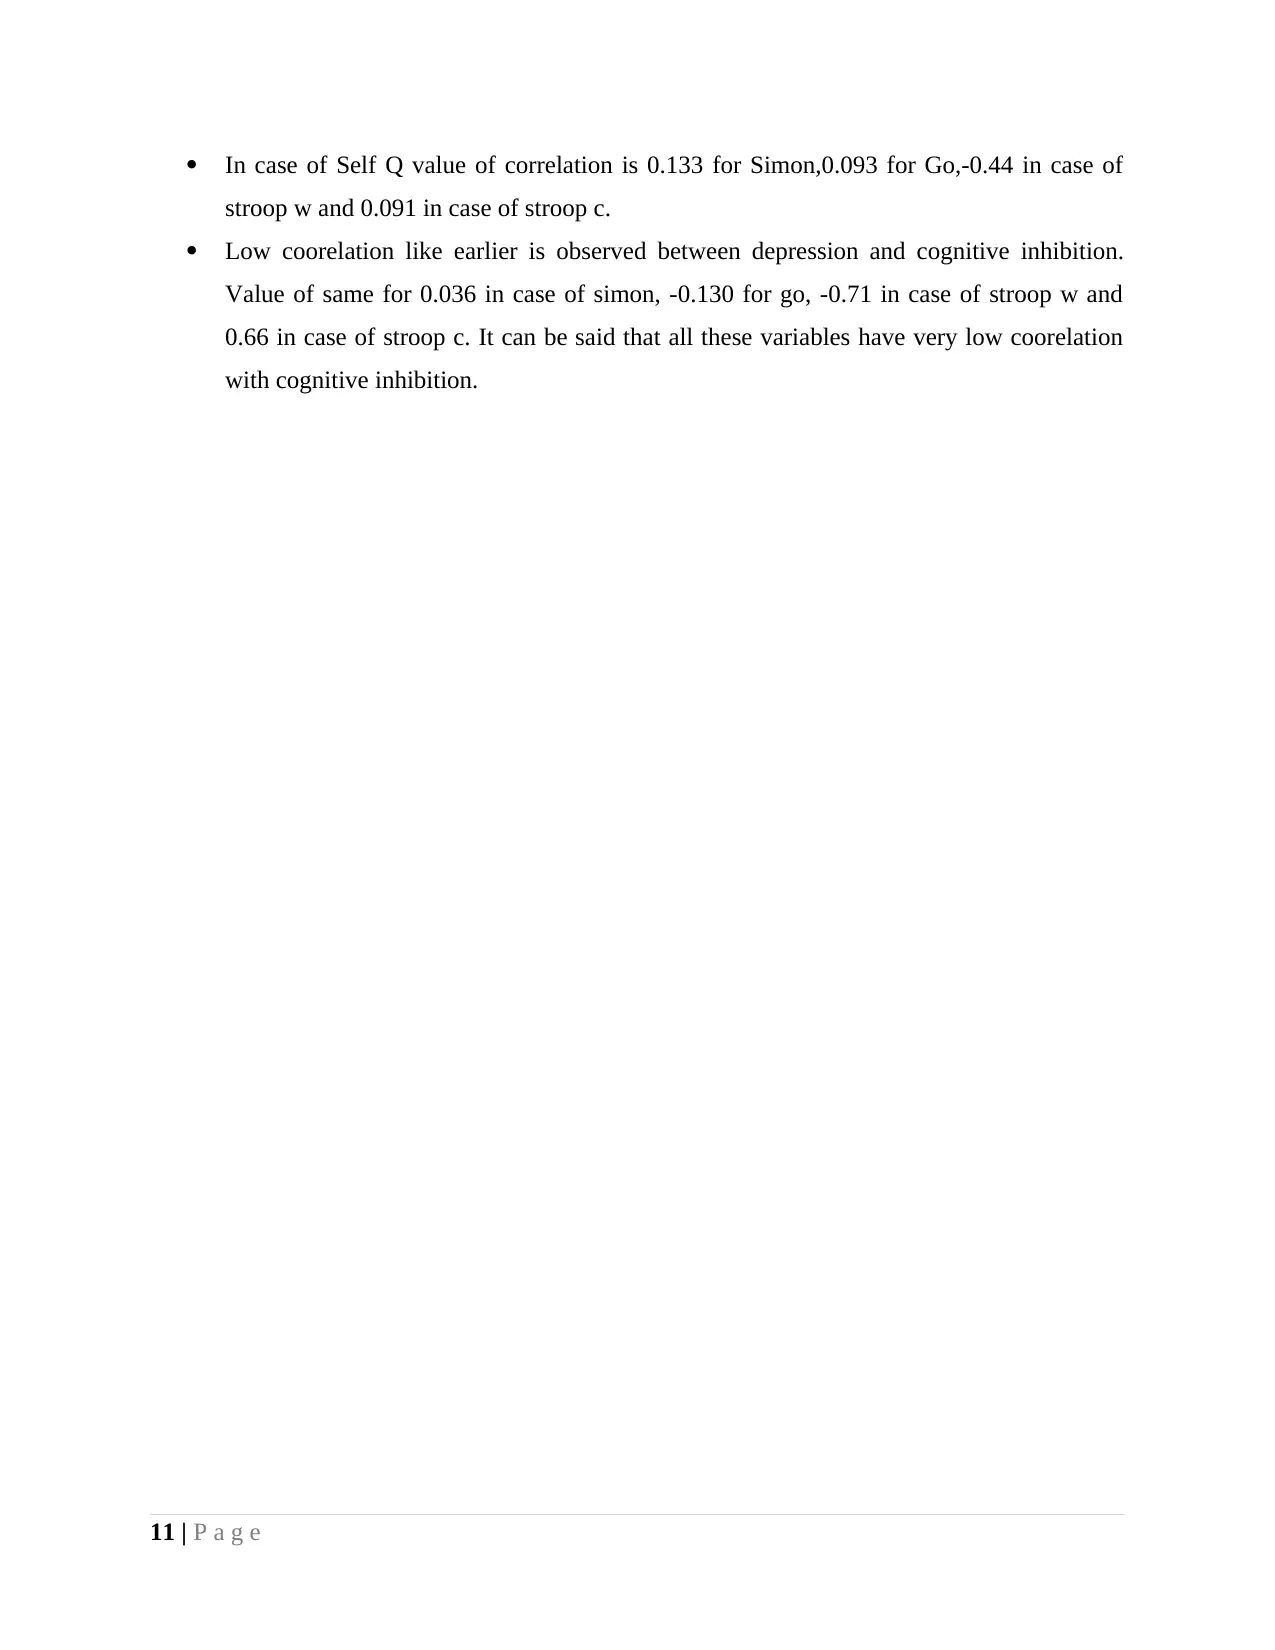
Descriptive statistics
Mean value in case of Simon group is (M=35.22) and standard devation is followed by
compatible and incompatible category where mean and standard deviation is (M=552.19,
SD=113.710) and (M=587.19, SD=113.710). Values deviate at same rate across compatible and
incompatible category.
ANNOVA
Difference among old and young people in respect to go test
Compatible group
H0: There is no significent mean difference between old and young age group in terms of
compatible category.
H1: There is significent mean difference between old and young age group in terms of
compatible category.
1 | P a g e
and elderly adults
Simon task
Anxiety level and Simon task
Simon task is the test that is conducted to identify rate at which response given by an
individual in respect to stimulus factors in accurate manner. By considering anxiety factor rate of
response is measured in respect to stimulus in terms of accuracy. Means that impact on anxiety
on response time and accuracy level is measured by using this test.
Descriptive statistics
Mean value in case of Simon group is (M=35.22) and standard devation is followed by
compatible and incompatible category where mean and standard deviation is (M=552.19,
SD=113.710) and (M=587.19, SD=113.710). Values deviate at same rate across compatible and
incompatible category.
ANNOVA
Difference among old and young people in respect to go test
Compatible group
H0: There is no significent mean difference between old and young age group in terms of
compatible category.
H1: There is significent mean difference between old and young age group in terms of
compatible category.
1 | P a g e
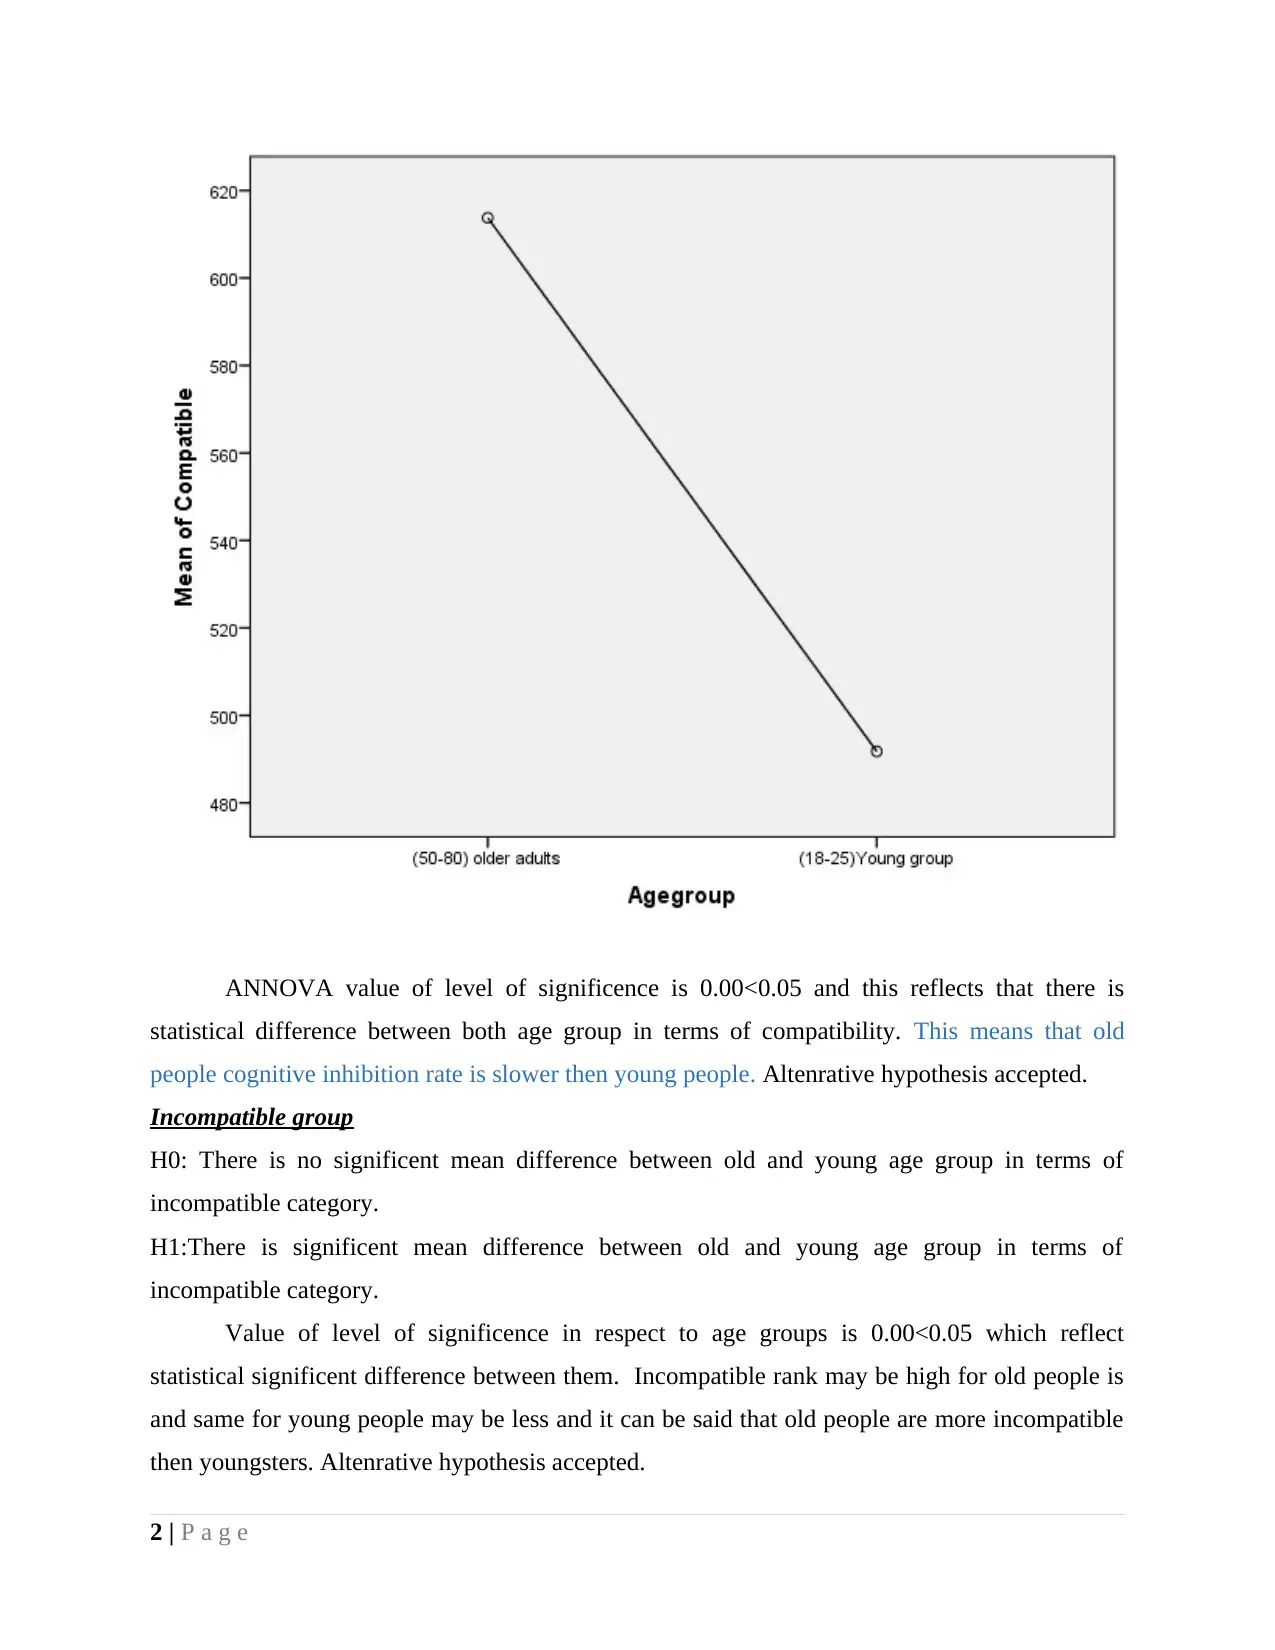
ANNOVA value of level of significence is 0.00<0.05 and this reflects that there is
statistical difference between both age group in terms of compatibility. This means that old
people cognitive inhibition rate is slower then young people. Altenrative hypothesis accepted.
Incompatible group
H0: There is no significent mean difference between old and young age group in terms of
incompatible category.
H1:There is significent mean difference between old and young age group in terms of
incompatible category.
Value of level of significence in respect to age groups is 0.00<0.05 which reflect
statistical significent difference between them. Incompatible rank may be high for old people is
and same for young people may be less and it can be said that old people are more incompatible
then youngsters. Altenrative hypothesis accepted.
2 | P a g e
Paraphrase This Document
Need a fresh take? Get an instant paraphrase of this document with our AI Paraphraser
Simon column is considered for performing calcualtion and it is reflecting accuracy level
of individuals when they respond to stimulus factor. Data points that are in column of Simon are
reflecting how accurately respondents respond to stimuli.
Komogorov Smirnov test
Value of test is greater then 0.05 which indicate that variables are normally distributed
and justified application of parametric test.
Old male, female comparison in terms of compatible, incompatible and simon
H0: Old male and females are not significently different in terms of factors compatible,
incompatible and simon.
H1: Old male and females are significently different in terms of factors compatible, incompatible
and simon.
Value of level of significence is 0.560>0.05 for compatible, 0.475>0.05 for incompatible
and 0.933>0.05 for simon. All these facts reflects that there is no significent mean difference
between old male and female in terms of these factors.
Kolmogorov test is reflecting that data is normally distributed as its value is more then
0.05 across all categories.
Young male and female comparison in terms of compatible, incompatible and simon
H0: Young male and females are not significently different in terms of factors compatible,
incompatible and simon.
H1: Young male and females are significently different in terms of factors compatible,
incompatible and simon.
Value of level of significence is greater then 0.05 in case of simon tast and same is less
then 0.05 in case of compatible and incompatible category. It can be said that there is no
significent mean difference between young male and female in case of simon tast but difference
terms of compatible, incompatible. Means that in respect to simon test any big difference is not
observed in accuracy level of young male and female. But in case of compatible and
incompatible category it is identified that accuracy level of both groups was different.
Go/NoGo task
3 | P a g e
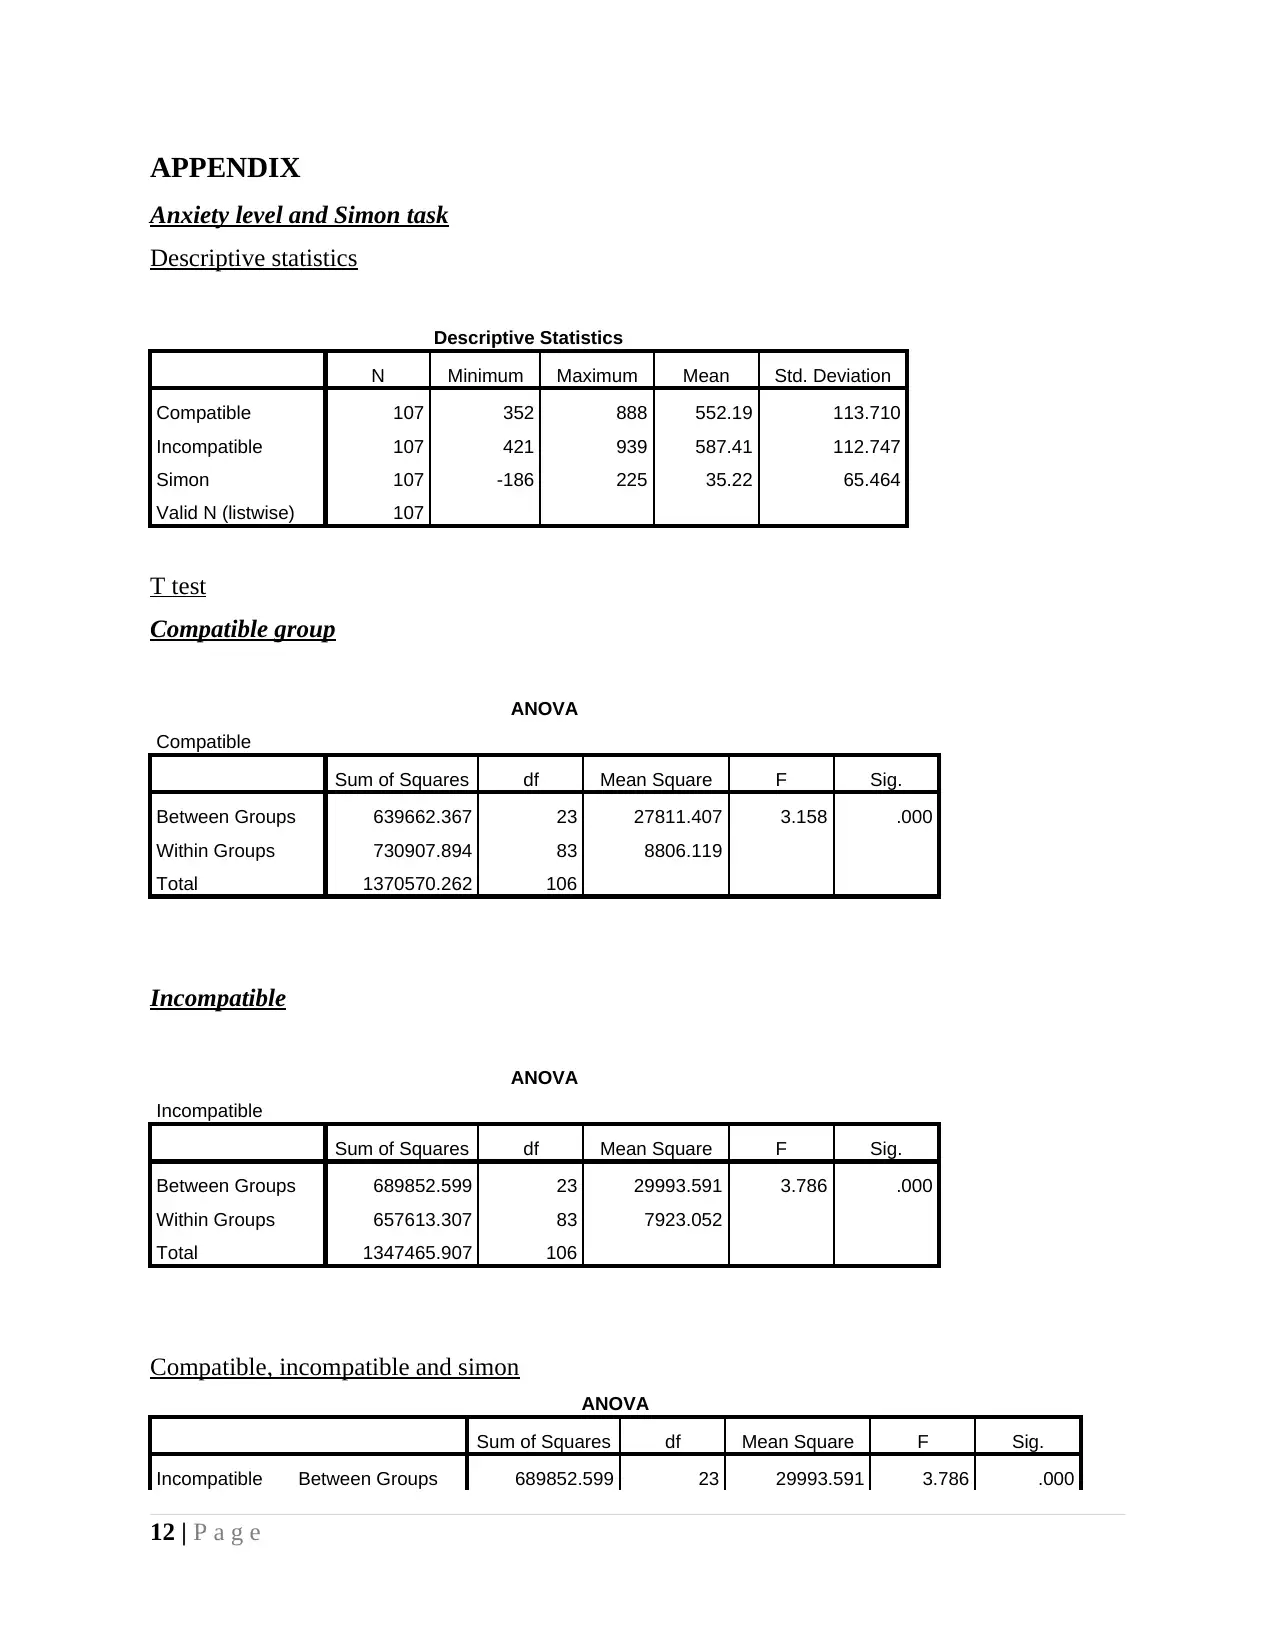
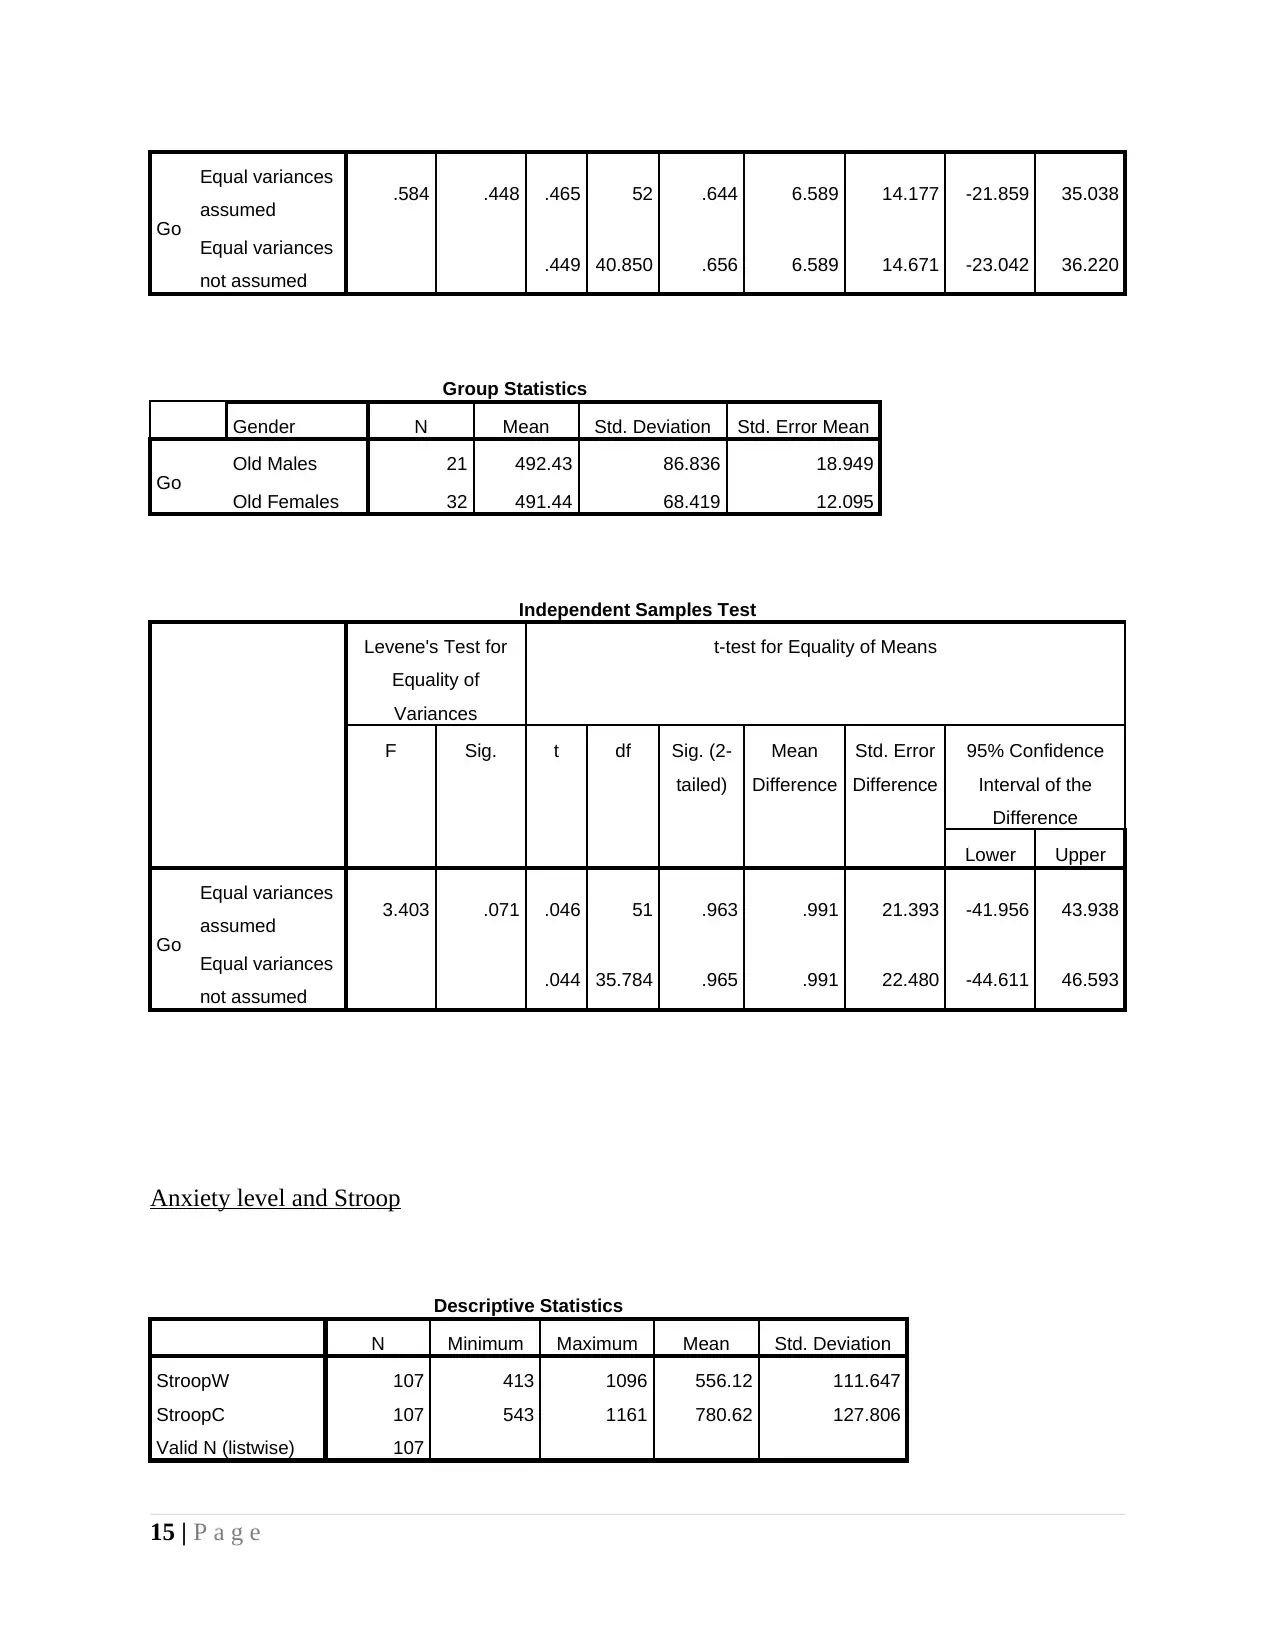
Anxiety level and Go, no go
Go and no go task is the test under which stimuli is presented before respondent and it
have to binary decision on each stimulus. In experiment partcipant make motor response (go)
and withhold a response (no go). Rate at which individual respond to stimuli is measured in this
task and same is analyzed by considering anxiety factor across different groups.
Descriptive statistics
Mean and standard deviation is (M=455.07,SD=73.74) in case of go test and same is
2000 and 0.00 in case of no go category. It can be said that value of go test is less but deviate
more in comparison to no go.
Kolmorov test
Value of level of significence is 0.200>0.05 which means data is normally distributed for
gender and agr groups. Parametric test will be applied on dataset.
Difference among old and young people in respect to go test
H0: There is no significent mean difference between old and youngsters in respect to go test
values.
H1: There is significent mean difference between old and youngsters in respect to go test values.
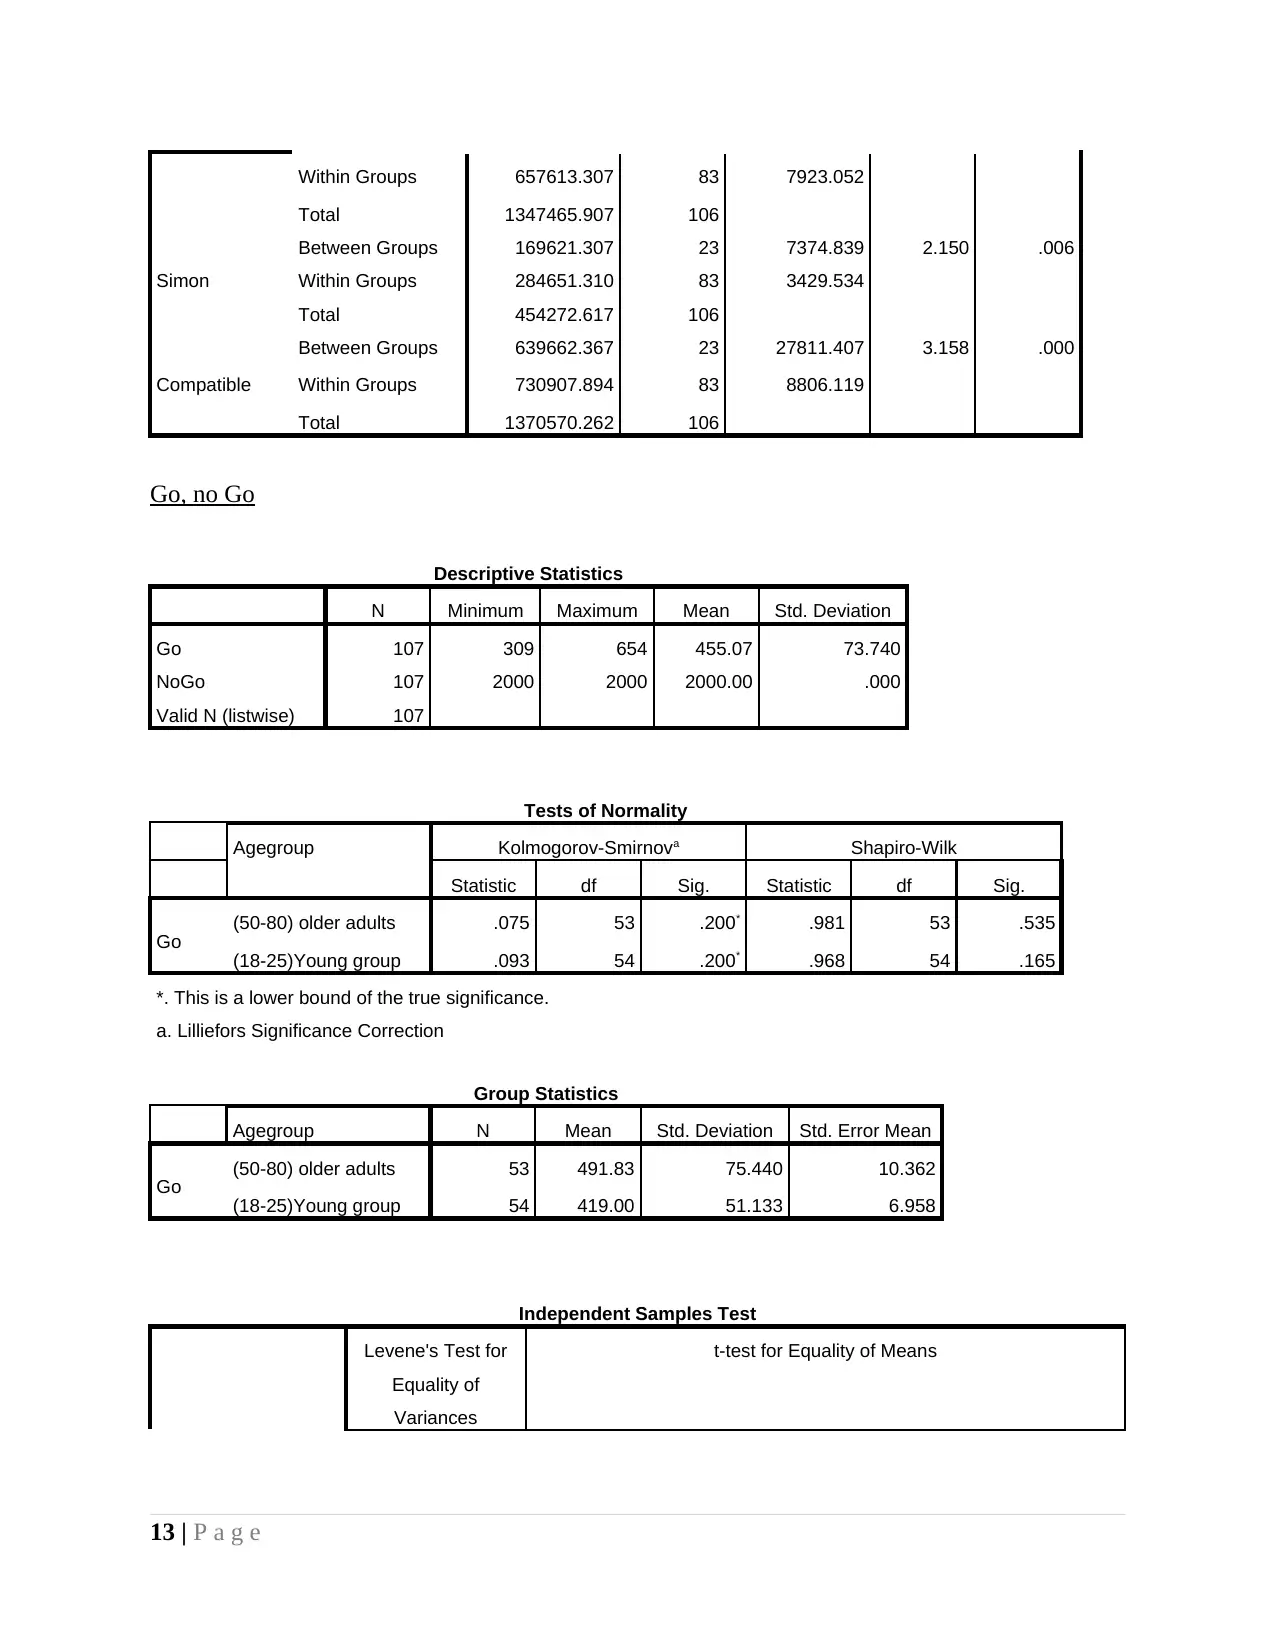
Value of level of significence is 0.00<0.05 and mean standard deviation in case of
youngsters is (M=419,SD=51) and same for old adults is (M=491,SD=75). Hence, alternative
hypothesis accepted.
Difference among young male and female in respect to go test
H0: There is no significent mean difference between young male and female in respect to go test
values.
H1: There is significent mean difference between young male and female in respect to go test
values.
Value of level of significence is 0.644 which reflect that there is no significent mean
difference between both groups in terms of go test values. Thus, null hypothesis accepted.
Difference among old male and old female in respect to go test
4 | P a g e
Go and no go task is the test under which stimuli is presented before respondent and it
have to binary decision on each stimulus. In experiment partcipant make motor response (go)
and withhold a response (no go). Rate at which individual respond to stimuli is measured in this
task and same is analyzed by considering anxiety factor across different groups.
Descriptive statistics
Mean and standard deviation is (M=455.07,SD=73.74) in case of go test and same is
2000 and 0.00 in case of no go category. It can be said that value of go test is less but deviate
more in comparison to no go.
Kolmorov test
Value of level of significence is 0.200>0.05 which means data is normally distributed for
gender and agr groups. Parametric test will be applied on dataset.
Difference among old and young people in respect to go test
H0: There is no significent mean difference between old and youngsters in respect to go test
values.
H1: There is significent mean difference between old and youngsters in respect to go test values.
Value of level of significence is 0.00<0.05 and mean standard deviation in case of
youngsters is (M=419,SD=51) and same for old adults is (M=491,SD=75). Hence, alternative
hypothesis accepted.
Difference among young male and female in respect to go test
H0: There is no significent mean difference between young male and female in respect to go test
values.
H1: There is significent mean difference between young male and female in respect to go test
values.
Value of level of significence is 0.644 which reflect that there is no significent mean
difference between both groups in terms of go test values. Thus, null hypothesis accepted.
Difference among old male and old female in respect to go test
4 | P a g e
H0: There is no significent mean difference between old male and old female in respect to go test
values.
H1: There is significent mean difference between old male and old in respect to go test values.
Value of level of significence is 963>0.05 and this reflect that there is no mean difference
between both groups in respect to go test. Hence, null hypothesis accepted.
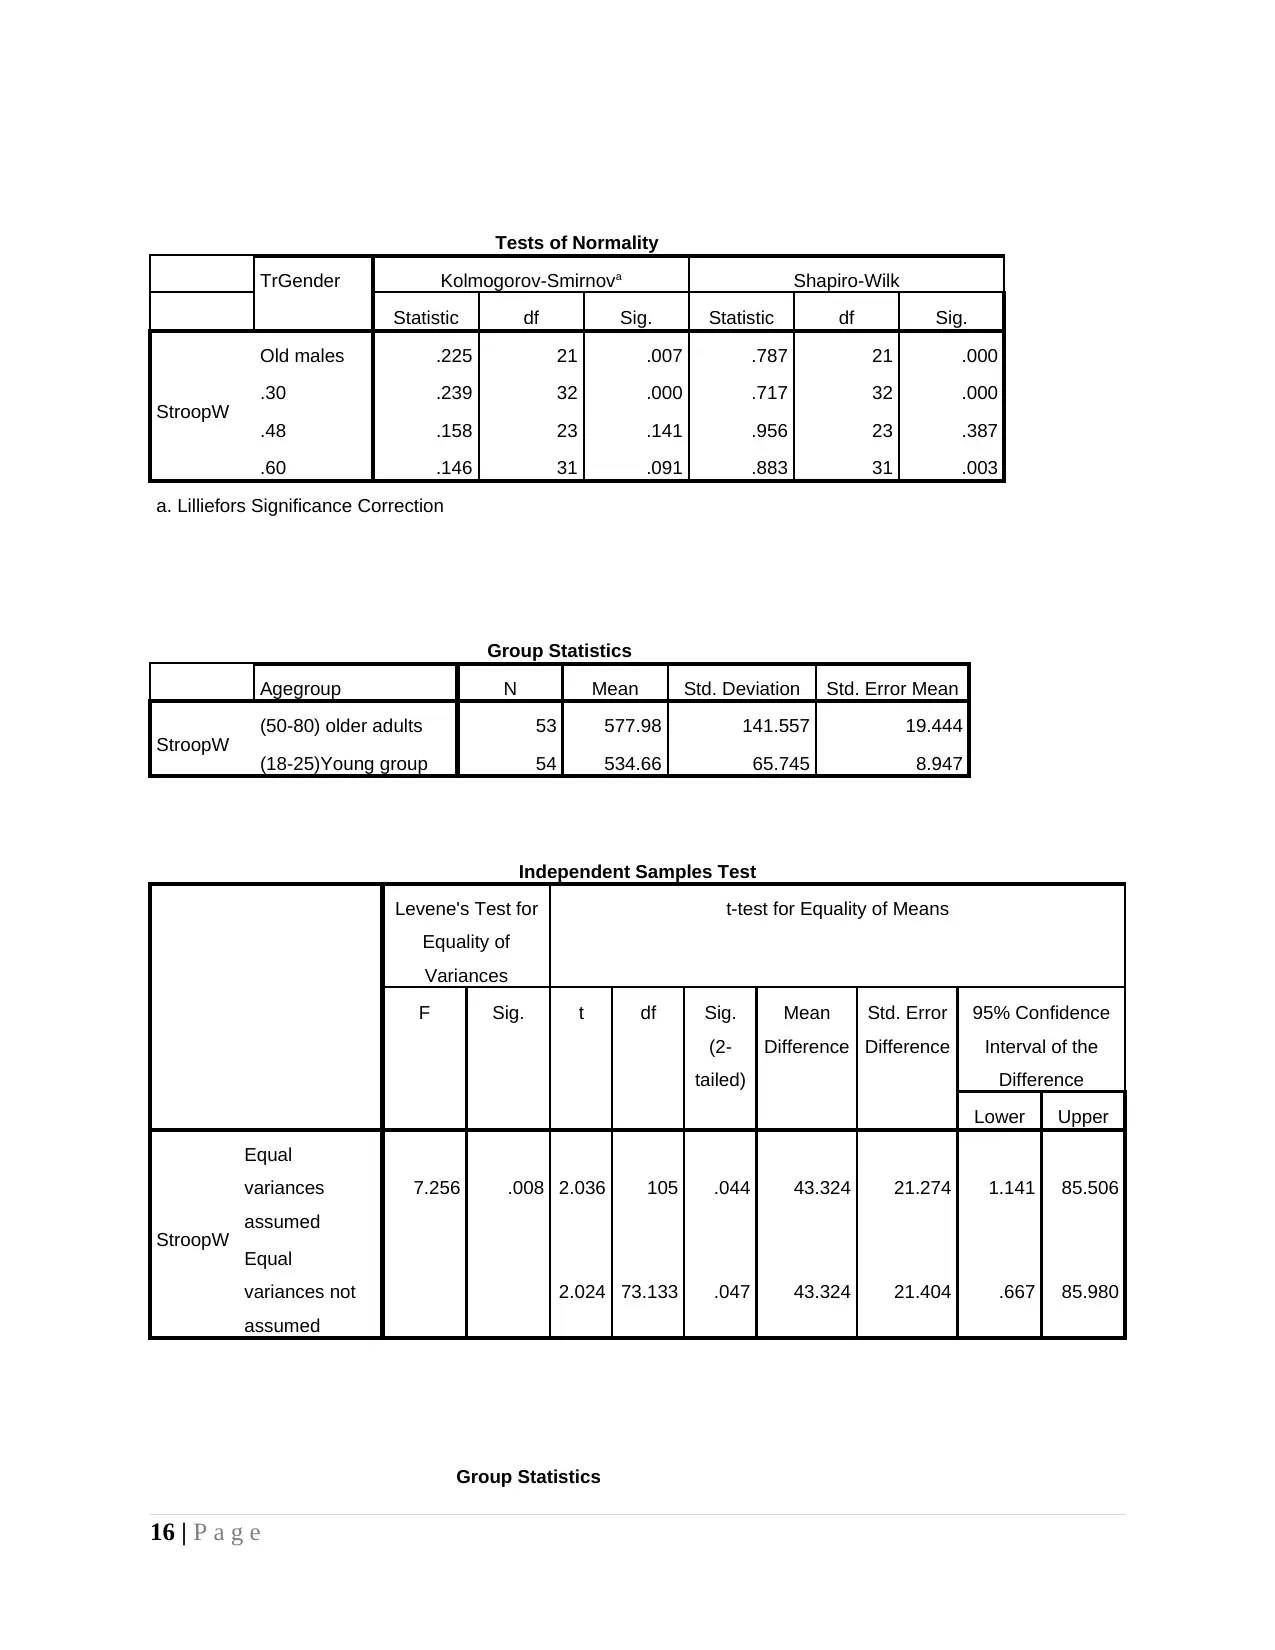
Stroop Task
Anxiety level and Stroop
Under stroop test reaction time is measured like other tests. In this test different colour
are given and same are labelled by varied colour. By doing so accuracy level and reaction time is
meausred. In present research anxiety factor and stroop results are considered for analysis
purpose.
Descriptive statistics
Mean and standard deviation for stroop w is (M=566,SD=111) and same for stroop c is
(M=780,SD127). It can be said that score in case of latter one is higher and deviate more then
former one.
Kolmorov test
Value of level of significence is greater then 0.05 and data is normally distributed.
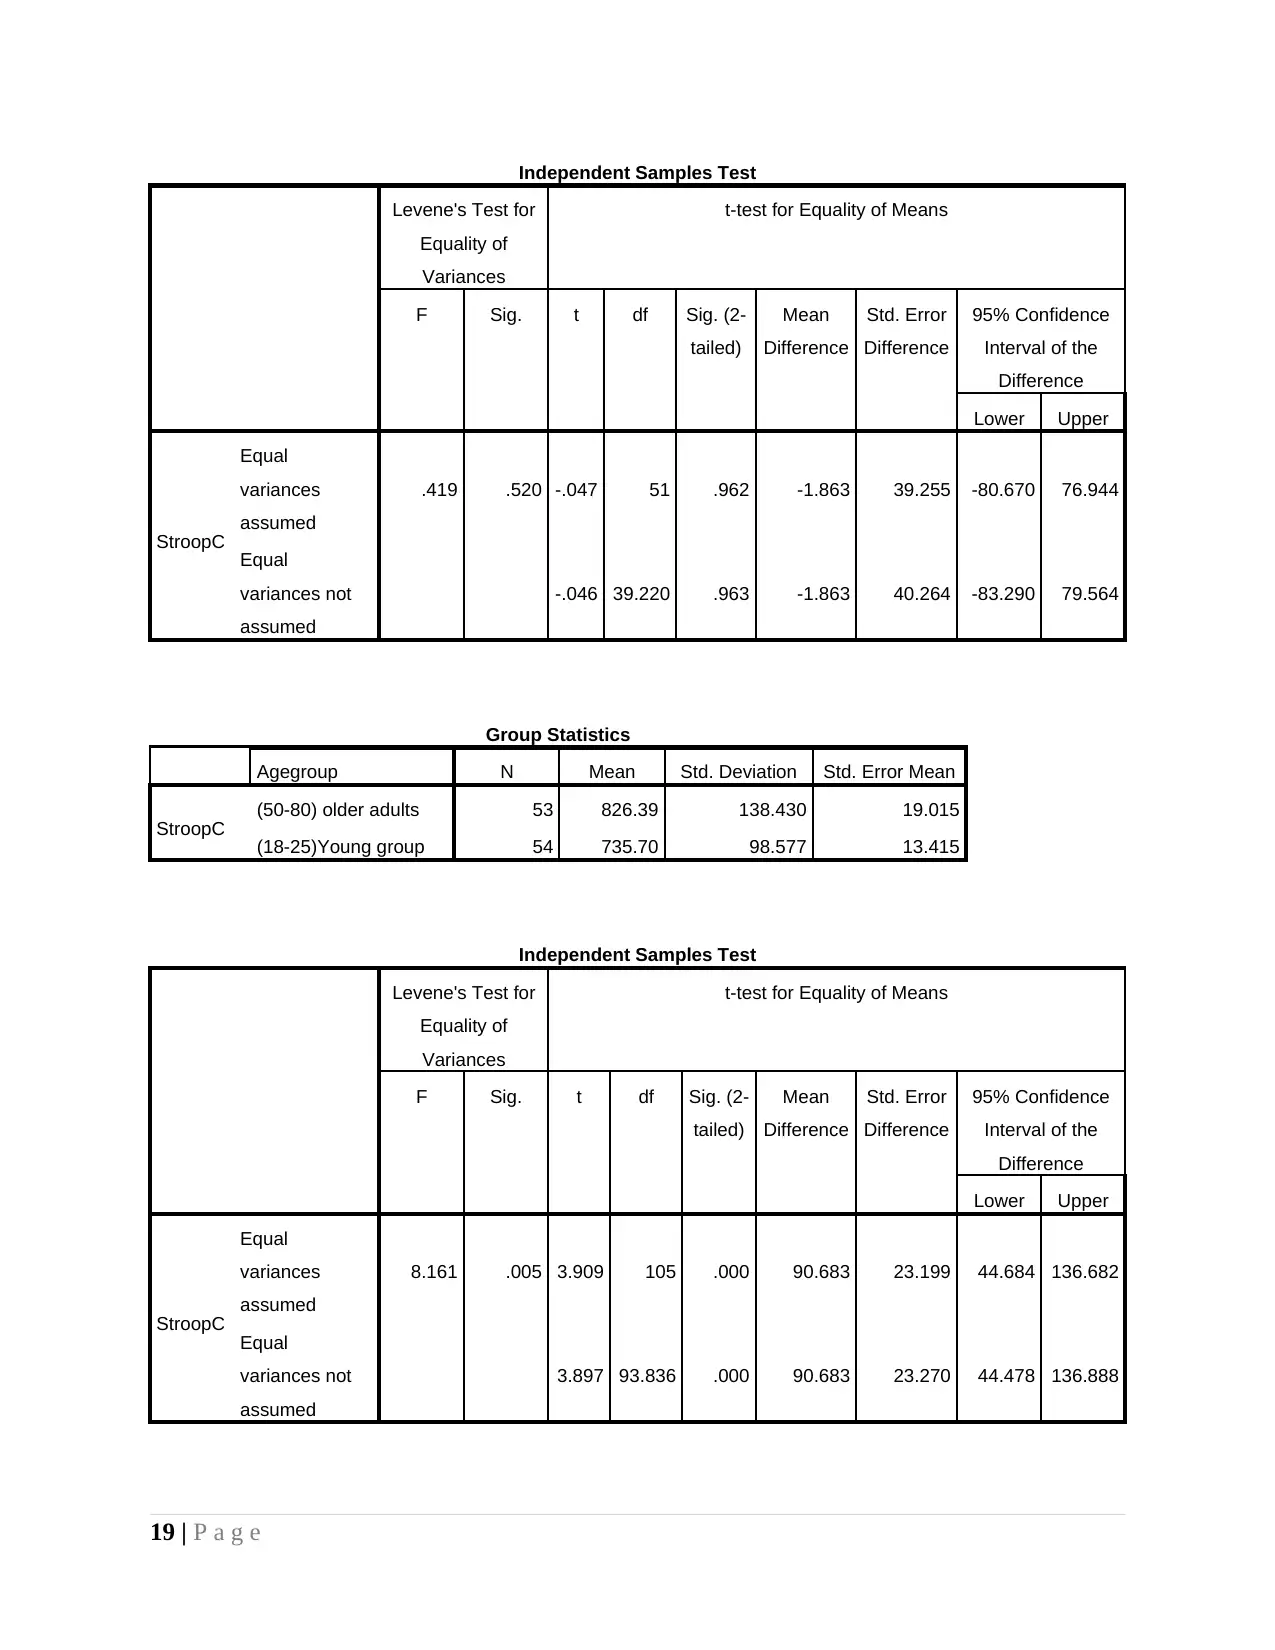
Difference among old and young people in respect to stroop test
H0: There is no significent mean difference between old and youngsters in respect to stroop w
and c test values.
H1: There is significent mean difference between old and youngsters in respect to stroop w and c
test values.
Value of level of significence is 0.04<0.05 in case of stroop w and 0.00<0.05 in case of
stroop c which means that stroop w and c results are different in case of both groups. Hence, null
hypothesis is accepted. It can be said that cognitive inhibitory control is older adult group is
slower then young group.
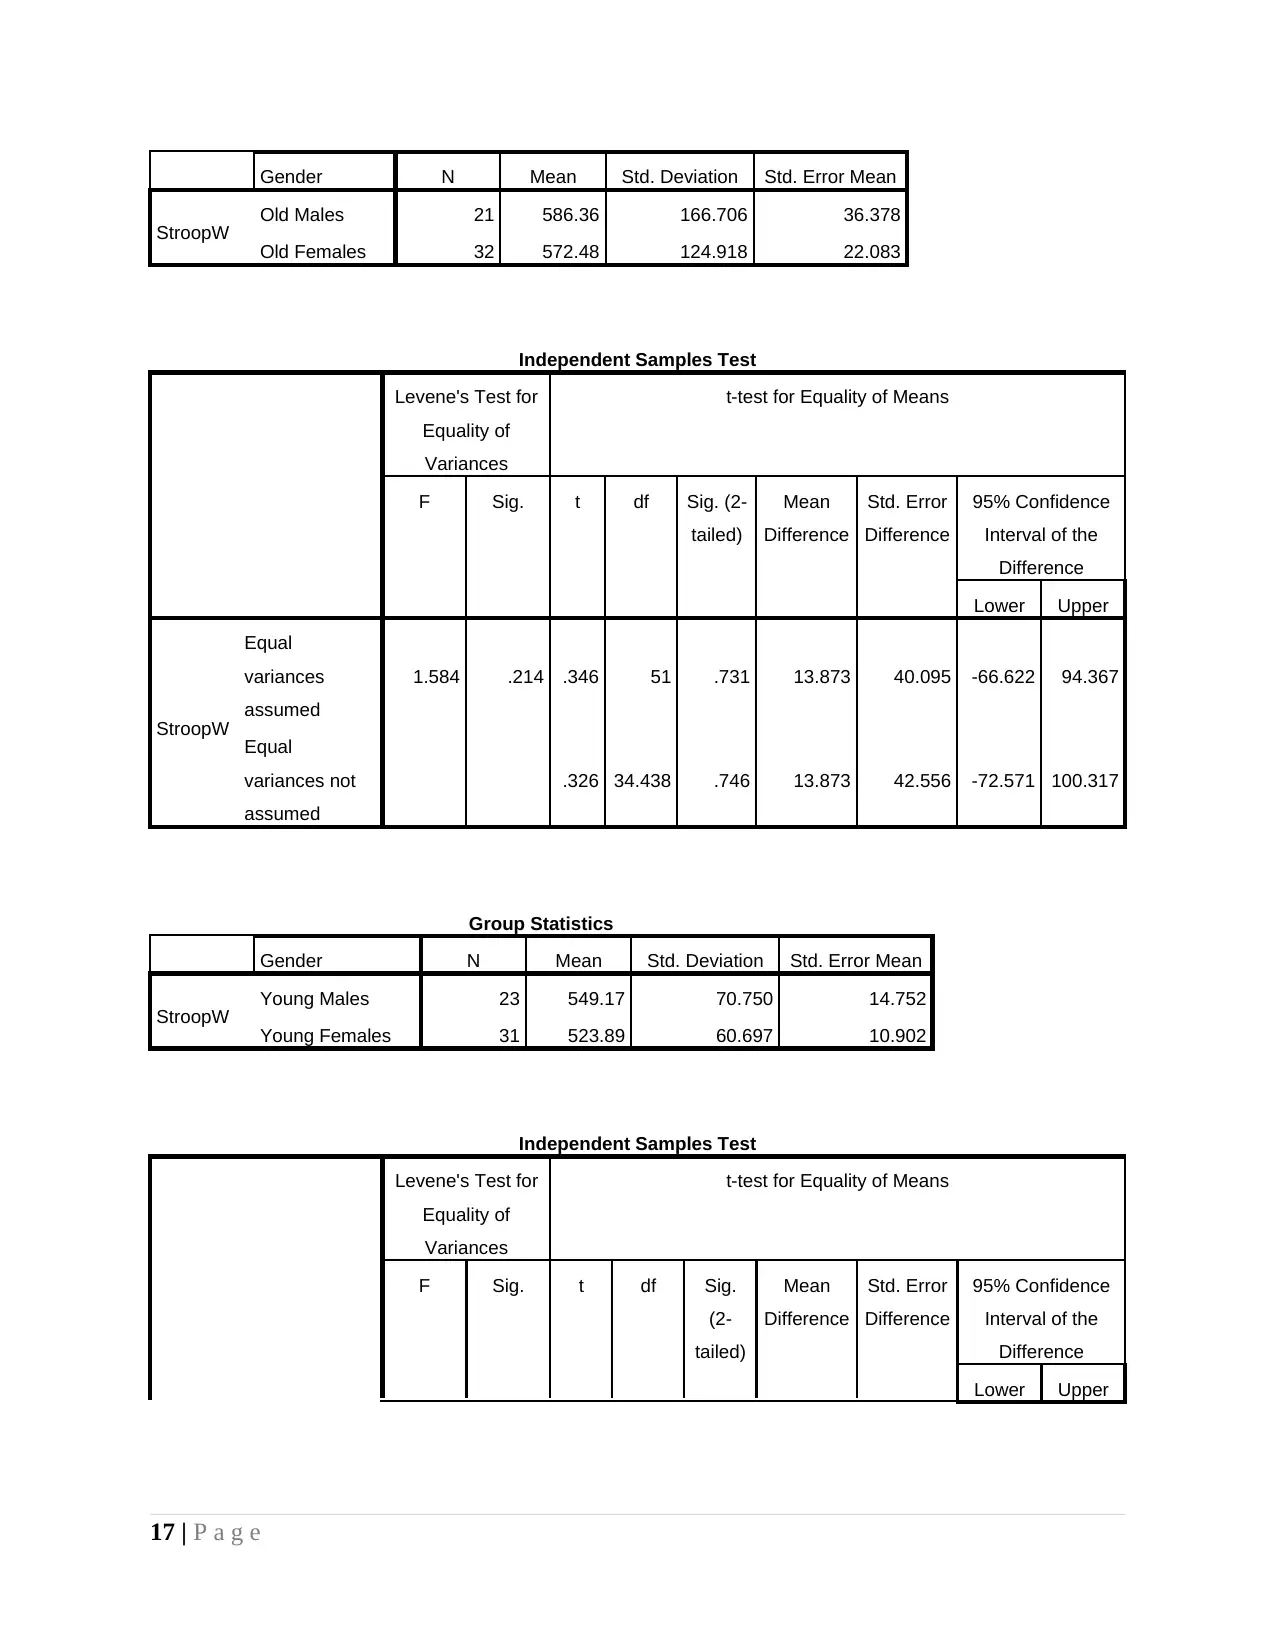
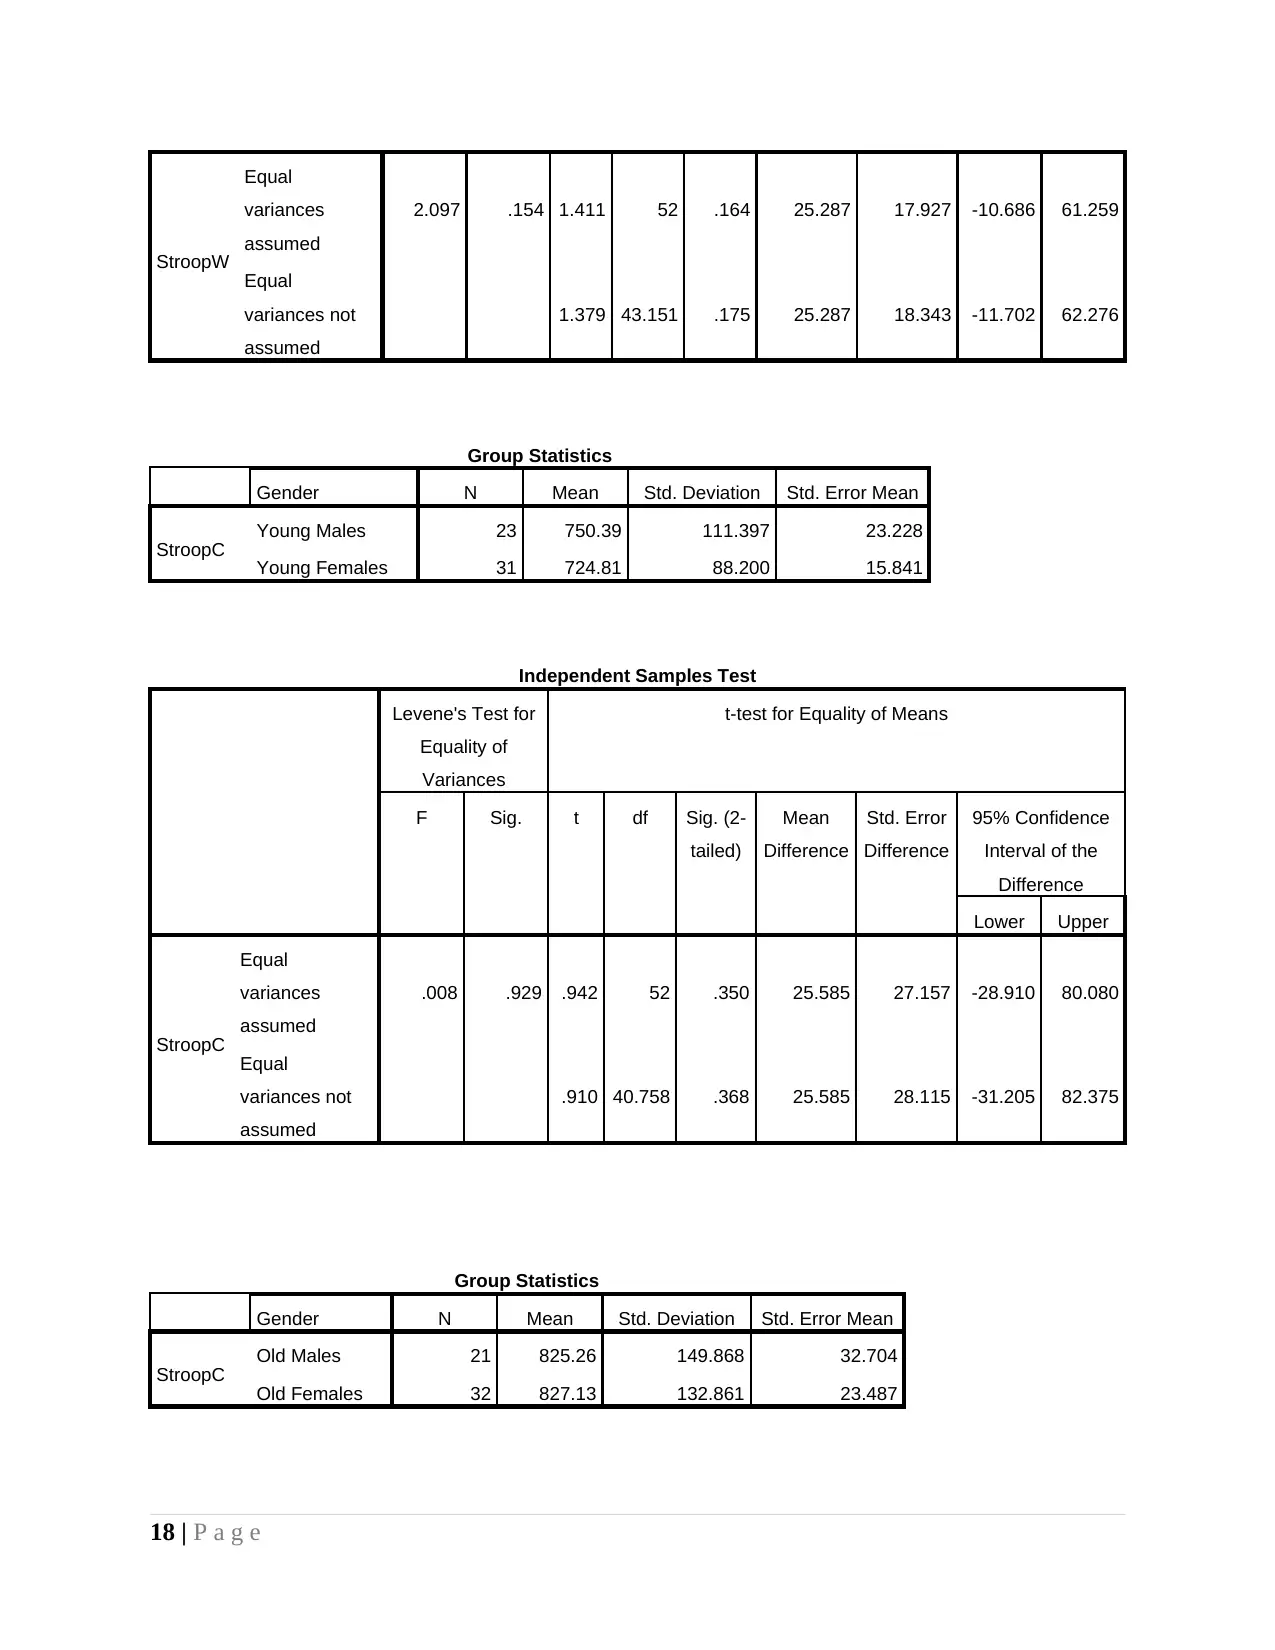
Difference among young male and female in respect to stroop w and c test
H0: There is no significent mean difference between young male and female in respect to stroop
w and c test values.
5 | P a g e
values.
H1: There is significent mean difference between old male and old in respect to go test values.
Value of level of significence is 963>0.05 and this reflect that there is no mean difference
between both groups in respect to go test. Hence, null hypothesis accepted.
Stroop Task
Anxiety level and Stroop
Under stroop test reaction time is measured like other tests. In this test different colour
are given and same are labelled by varied colour. By doing so accuracy level and reaction time is
meausred. In present research anxiety factor and stroop results are considered for analysis
purpose.
Descriptive statistics
Mean and standard deviation for stroop w is (M=566,SD=111) and same for stroop c is
(M=780,SD127). It can be said that score in case of latter one is higher and deviate more then
former one.
Kolmorov test
Value of level of significence is greater then 0.05 and data is normally distributed.
Difference among old and young people in respect to stroop test
H0: There is no significent mean difference between old and youngsters in respect to stroop w
and c test values.
H1: There is significent mean difference between old and youngsters in respect to stroop w and c
test values.
Value of level of significence is 0.04<0.05 in case of stroop w and 0.00<0.05 in case of
stroop c which means that stroop w and c results are different in case of both groups. Hence, null
hypothesis is accepted. It can be said that cognitive inhibitory control is older adult group is
slower then young group.
Difference among young male and female in respect to stroop w and c test
H0: There is no significent mean difference between young male and female in respect to stroop
w and c test values.
5 | P a g e
Secure Best Marks with AI Grader
Need help grading? Try our AI Grader for instant feedback on your assignments.
H1: There is significent mean difference between young male and female in respect to stroop w
and c test values.
Value of level of significence is 0.164>0.05 for stroop w and 0.34>0.05 for stroop c this
again reflect that young make and female does not have different score in stoop w test. Null
hypothesis accepted.
Difference among old male and old female in respect to stroop w and c test
H0: There is no significent mean difference between old male and old female in respect to stoop
w and c test values.
H1: There is significent mean difference between old male and old in respect to stroop w and c
test values.
Value of level of significence is more then 0.05 in case of stroop w and c which means
there is no significent difference between old male and female. Thus, null hypothesis is accepted.
6 | P a g e
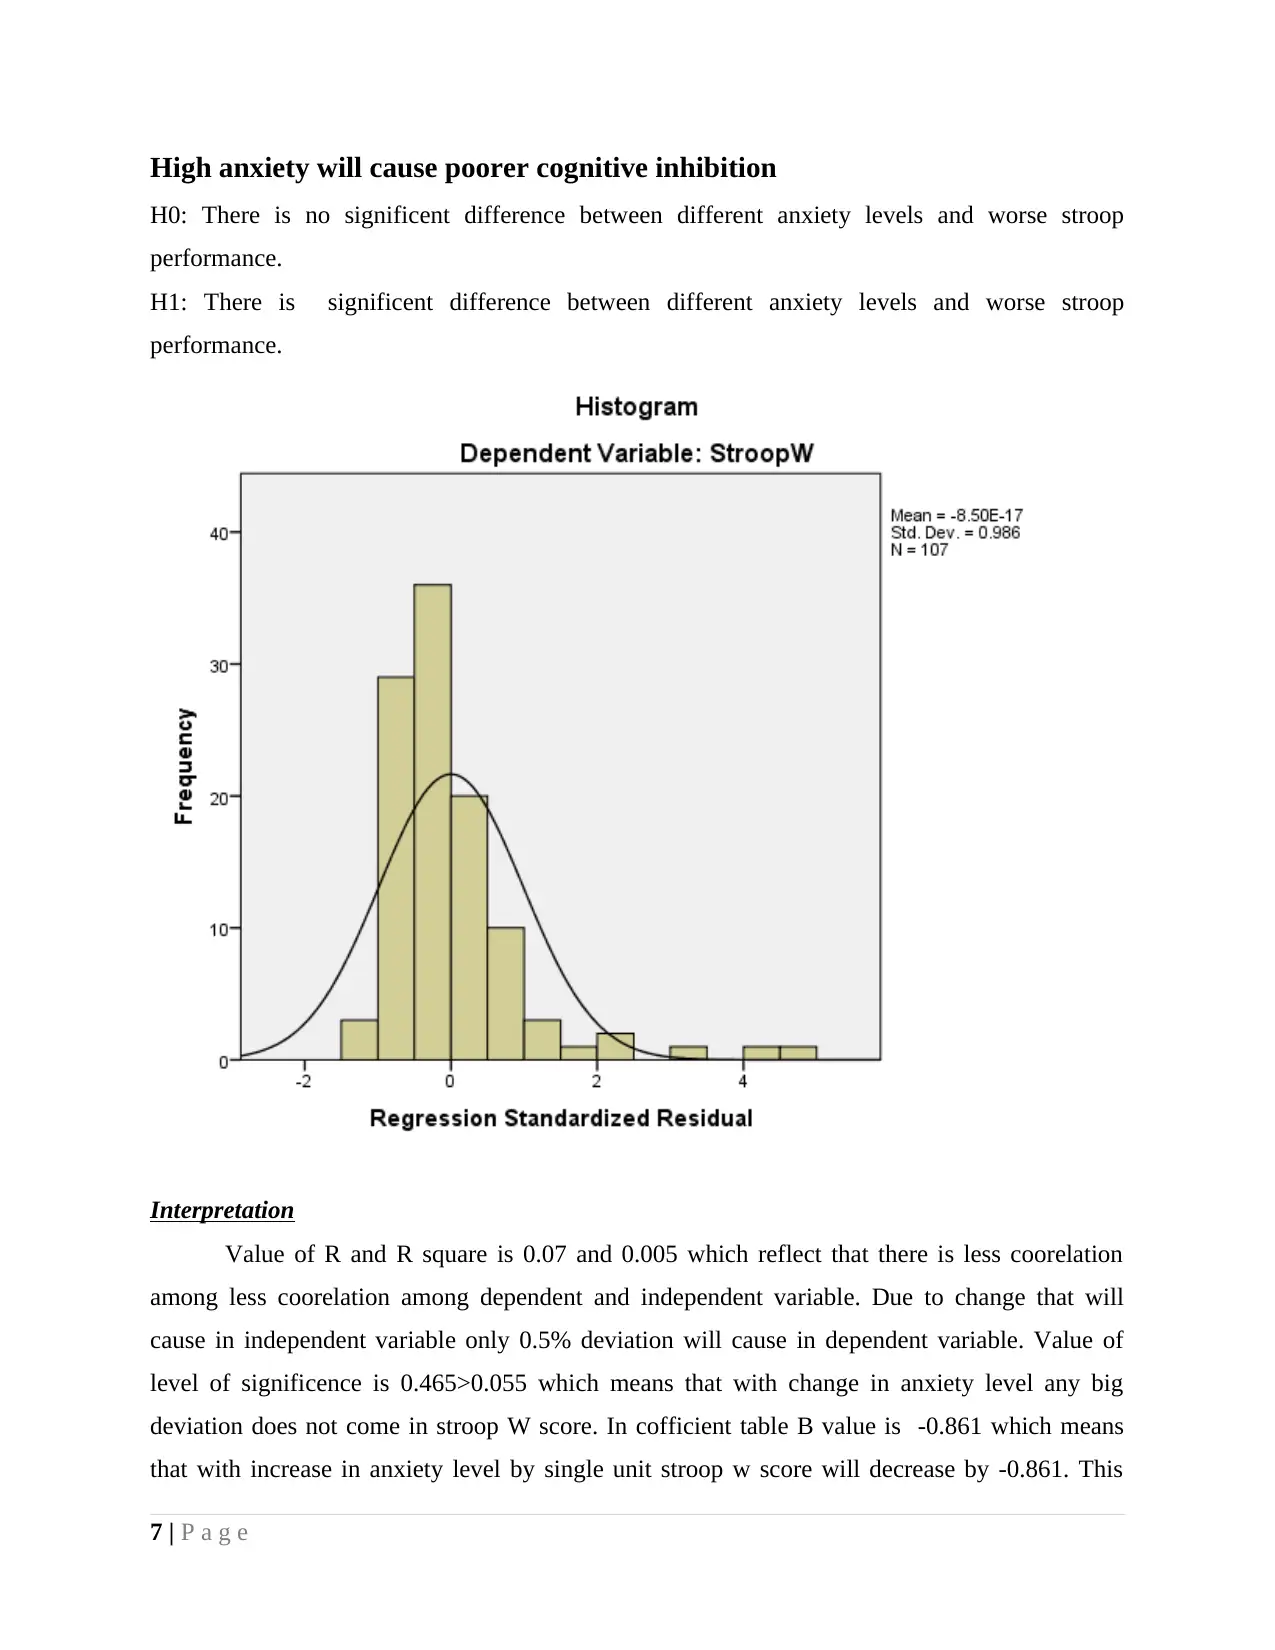
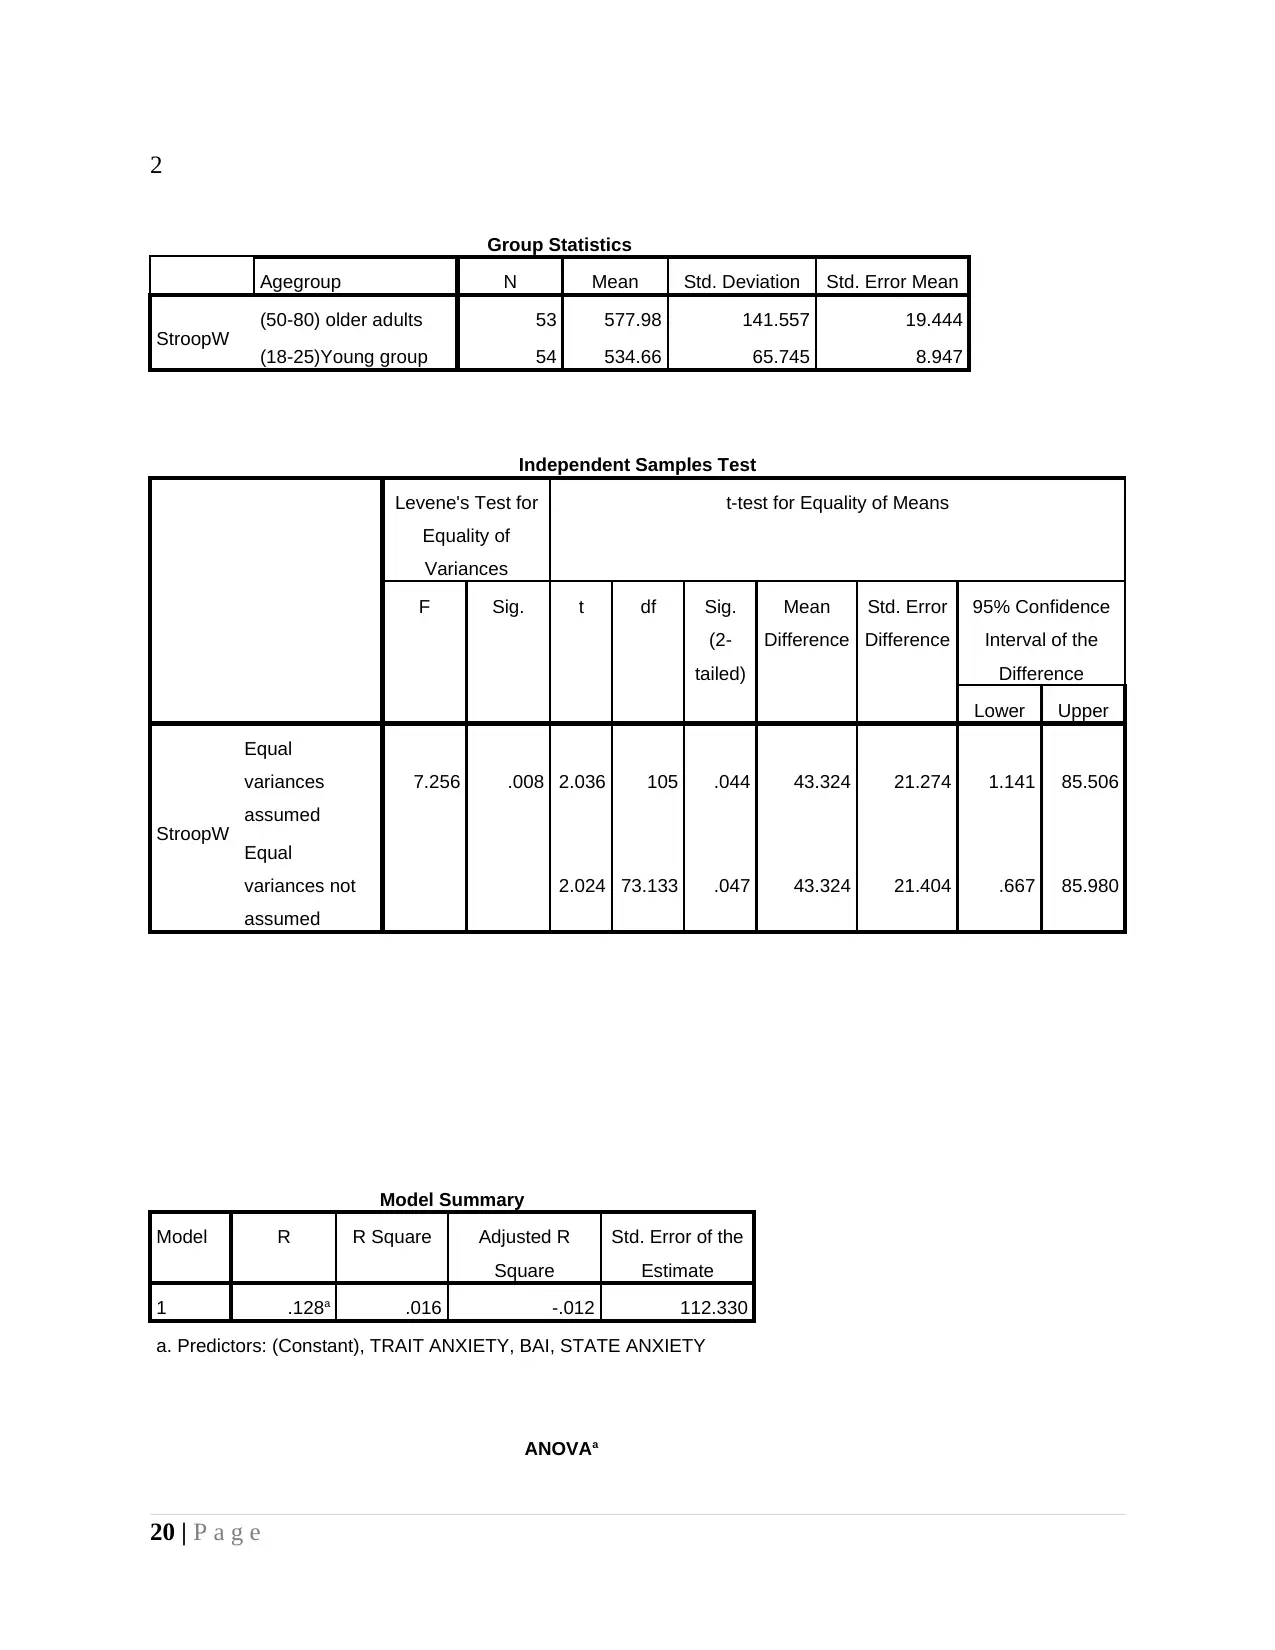
High anxiety will cause poorer cognitive inhibition
H0: There is no significent difference between different anxiety levels and worse stroop
performance.
H1: There is significent difference between different anxiety levels and worse stroop
performance.
Interpretation
Value of R and R square is 0.07 and 0.005 which reflect that there is less coorelation
among less coorelation among dependent and independent variable. Due to change that will
cause in independent variable only 0.5% deviation will cause in dependent variable. Value of
level of significence is 0.465>0.055 which means that with change in anxiety level any big
deviation does not come in stroop W score. In cofficient table B value is -0.861 which means
that with increase in anxiety level by single unit stroop w score will decrease by -0.861. This
7 | P a g e
reflects that anxiety score does not have big impact on cognitive inhibition but latter one reduce
with increase in former value.
Worse stroop performance across young and older adults
H0: Worse stroop performance is different across young and old age people.
H1: There is no significent difference between young and old age people in terms of worse
stroop performance.
Interpretation
It can be seen from the table that is in appendix (Anxity level and stroop category) that
mean and standard deviation is 577.98(141.55) and same for young age group people is
534.66(65.74). Facts are clearly reflecting that there is difference in stroop w score and rate of
failure is low in case of youngsters then old people. Moreover, standard deviation is higher in
case of old people then youngsters. Hence, it can be said that stroop performance is poor in case
of old then young people. Value of level of significence is 0.04<0.05 and this reflect that there is
significent mean difference between both age group people in terms of stroop performance.
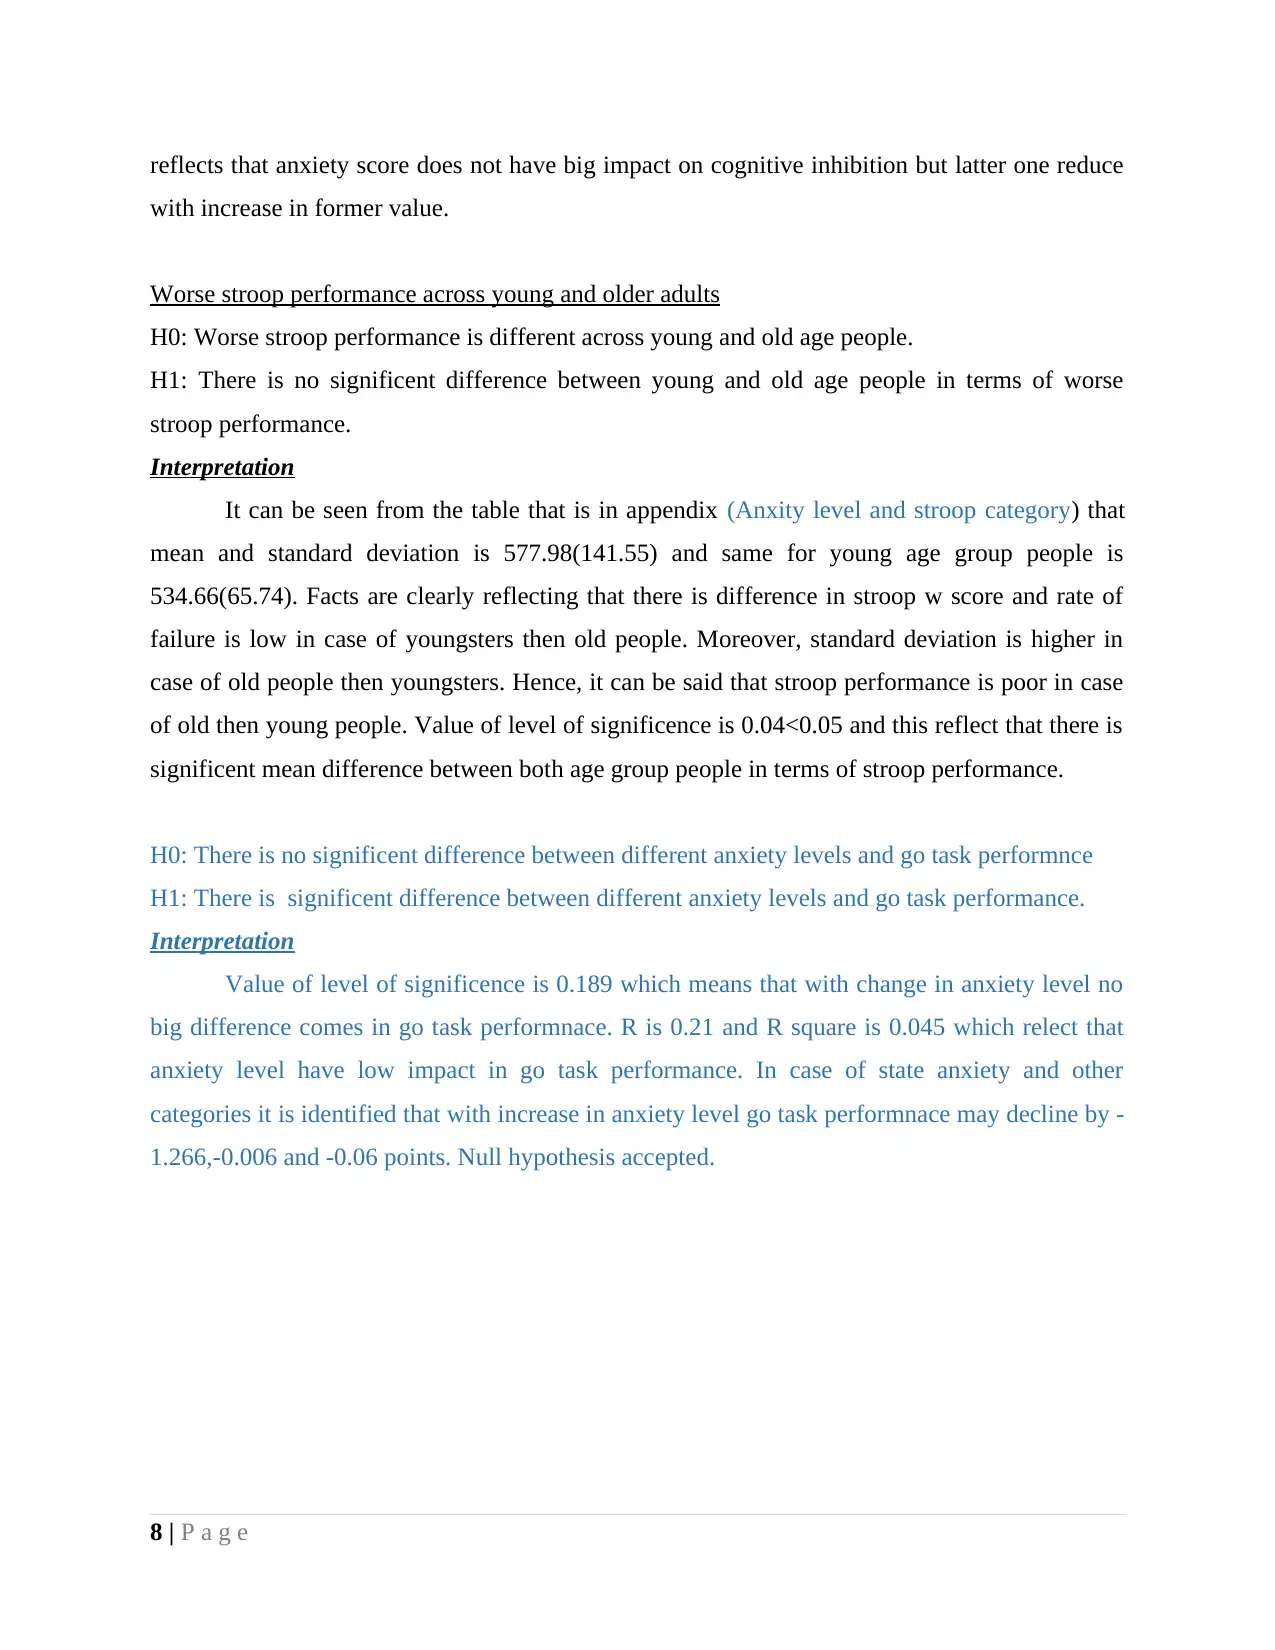
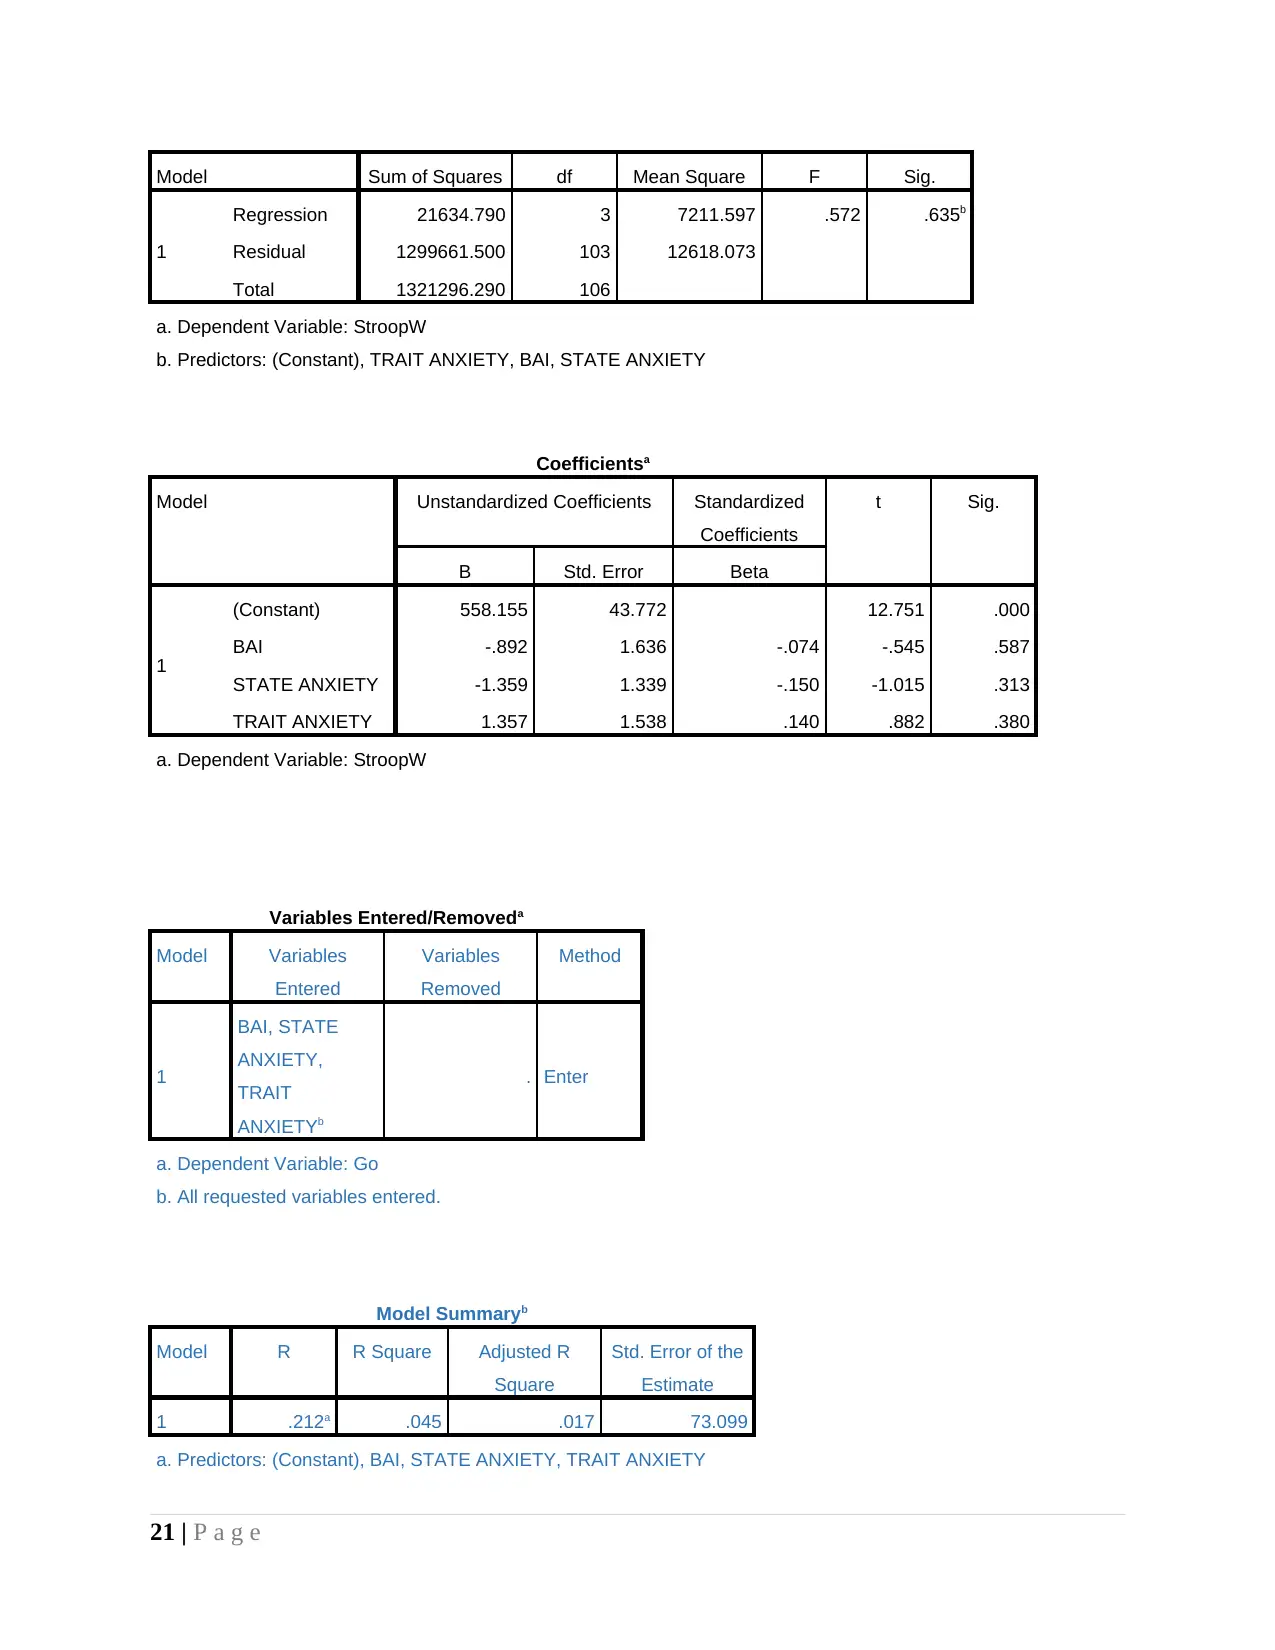
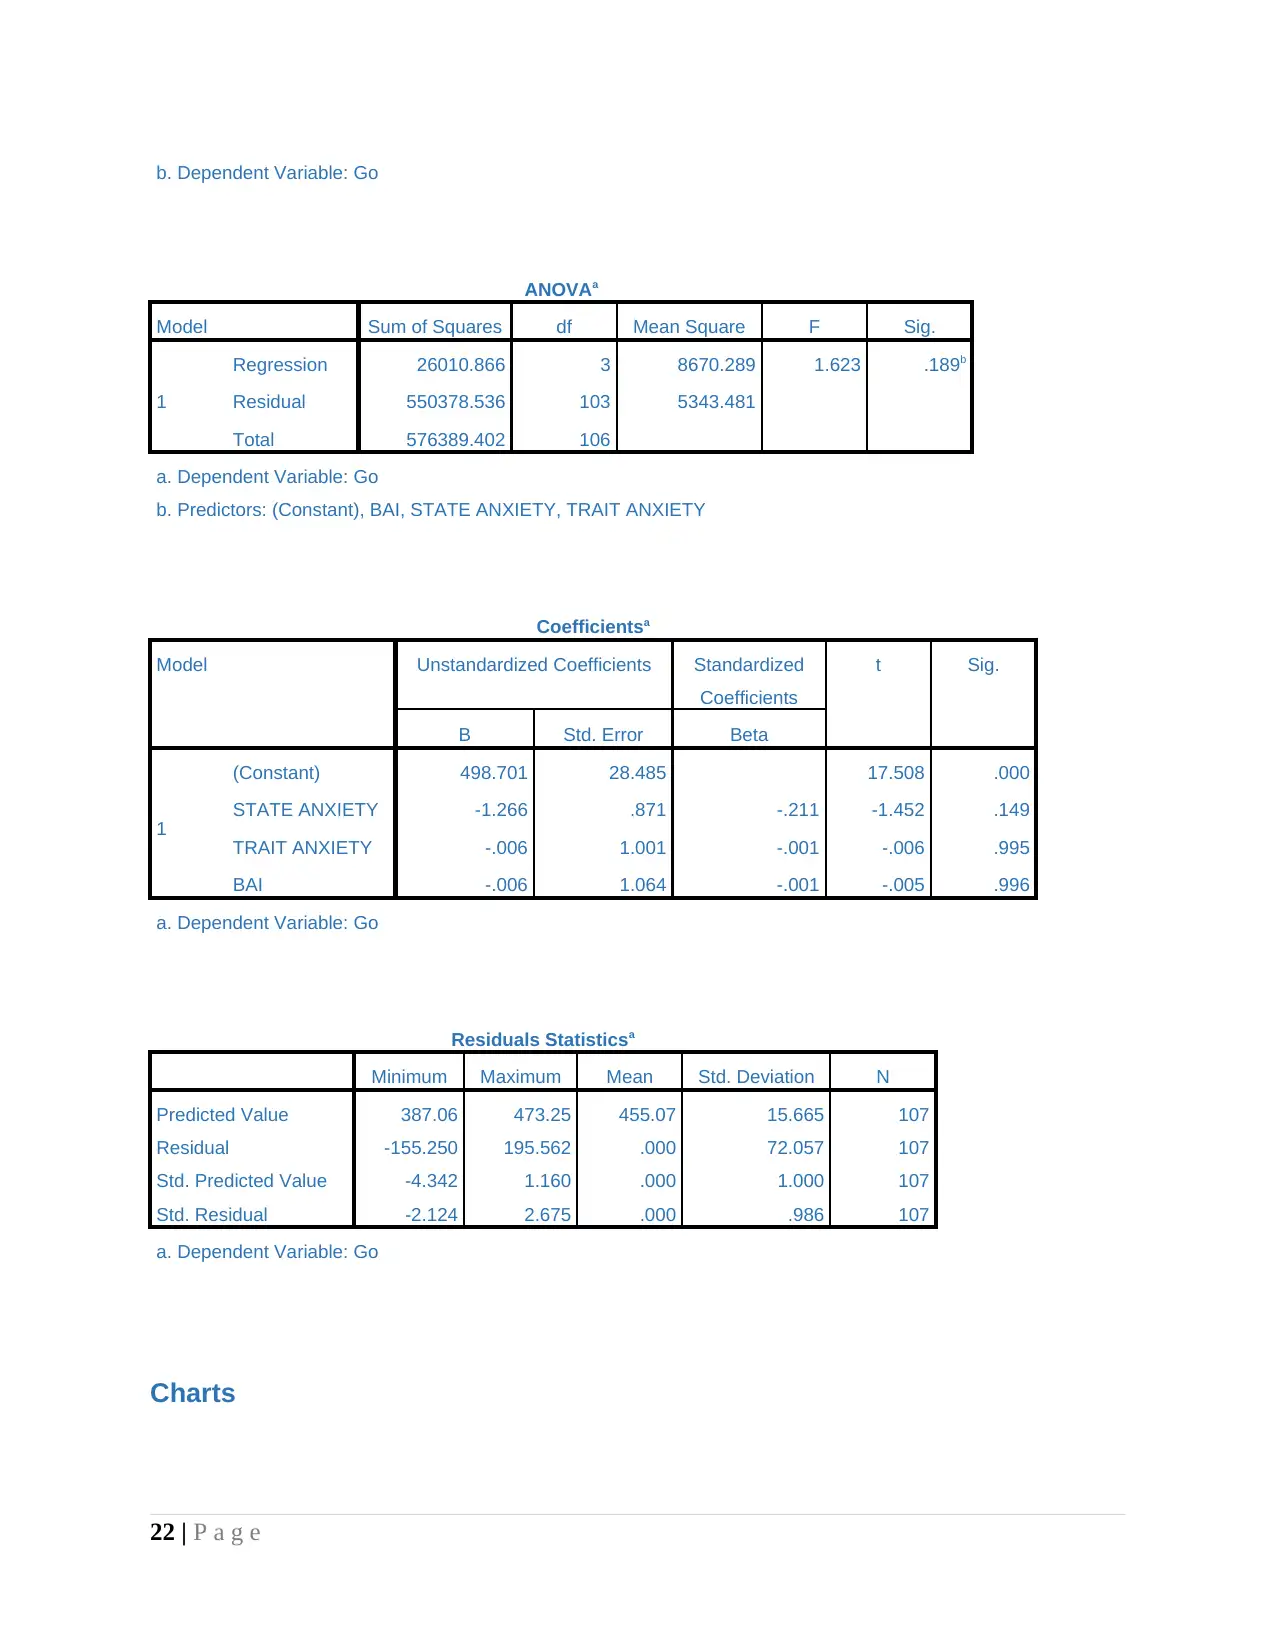
H0: There is no significent difference between different anxiety levels and go task performnce
H1: There is significent difference between different anxiety levels and go task performance.
Interpretation
Value of level of significence is 0.189 which means that with change in anxiety level no
big difference comes in go task performnace. R is 0.21 and R square is 0.045 which relect that
anxiety level have low impact in go task performance. In case of state anxiety and other
categories it is identified that with increase in anxiety level go task performnace may decline by -
1.266,-0.006 and -0.06 points. Null hypothesis accepted.
8 | P a g e
with increase in former value.
Worse stroop performance across young and older adults
H0: Worse stroop performance is different across young and old age people.
H1: There is no significent difference between young and old age people in terms of worse
stroop performance.
Interpretation
It can be seen from the table that is in appendix (Anxity level and stroop category) that
mean and standard deviation is 577.98(141.55) and same for young age group people is
534.66(65.74). Facts are clearly reflecting that there is difference in stroop w score and rate of
failure is low in case of youngsters then old people. Moreover, standard deviation is higher in
case of old people then youngsters. Hence, it can be said that stroop performance is poor in case
of old then young people. Value of level of significence is 0.04<0.05 and this reflect that there is
significent mean difference between both age group people in terms of stroop performance.
H0: There is no significent difference between different anxiety levels and go task performnce
H1: There is significent difference between different anxiety levels and go task performance.
Interpretation
Value of level of significence is 0.189 which means that with change in anxiety level no
big difference comes in go task performnace. R is 0.21 and R square is 0.045 which relect that
anxiety level have low impact in go task performance. In case of state anxiety and other
categories it is identified that with increase in anxiety level go task performnace may decline by -
1.266,-0.006 and -0.06 points. Null hypothesis accepted.
8 | P a g e
Paraphrase This Document
Need a fresh take? Get an instant paraphrase of this document with our AI Paraphraser
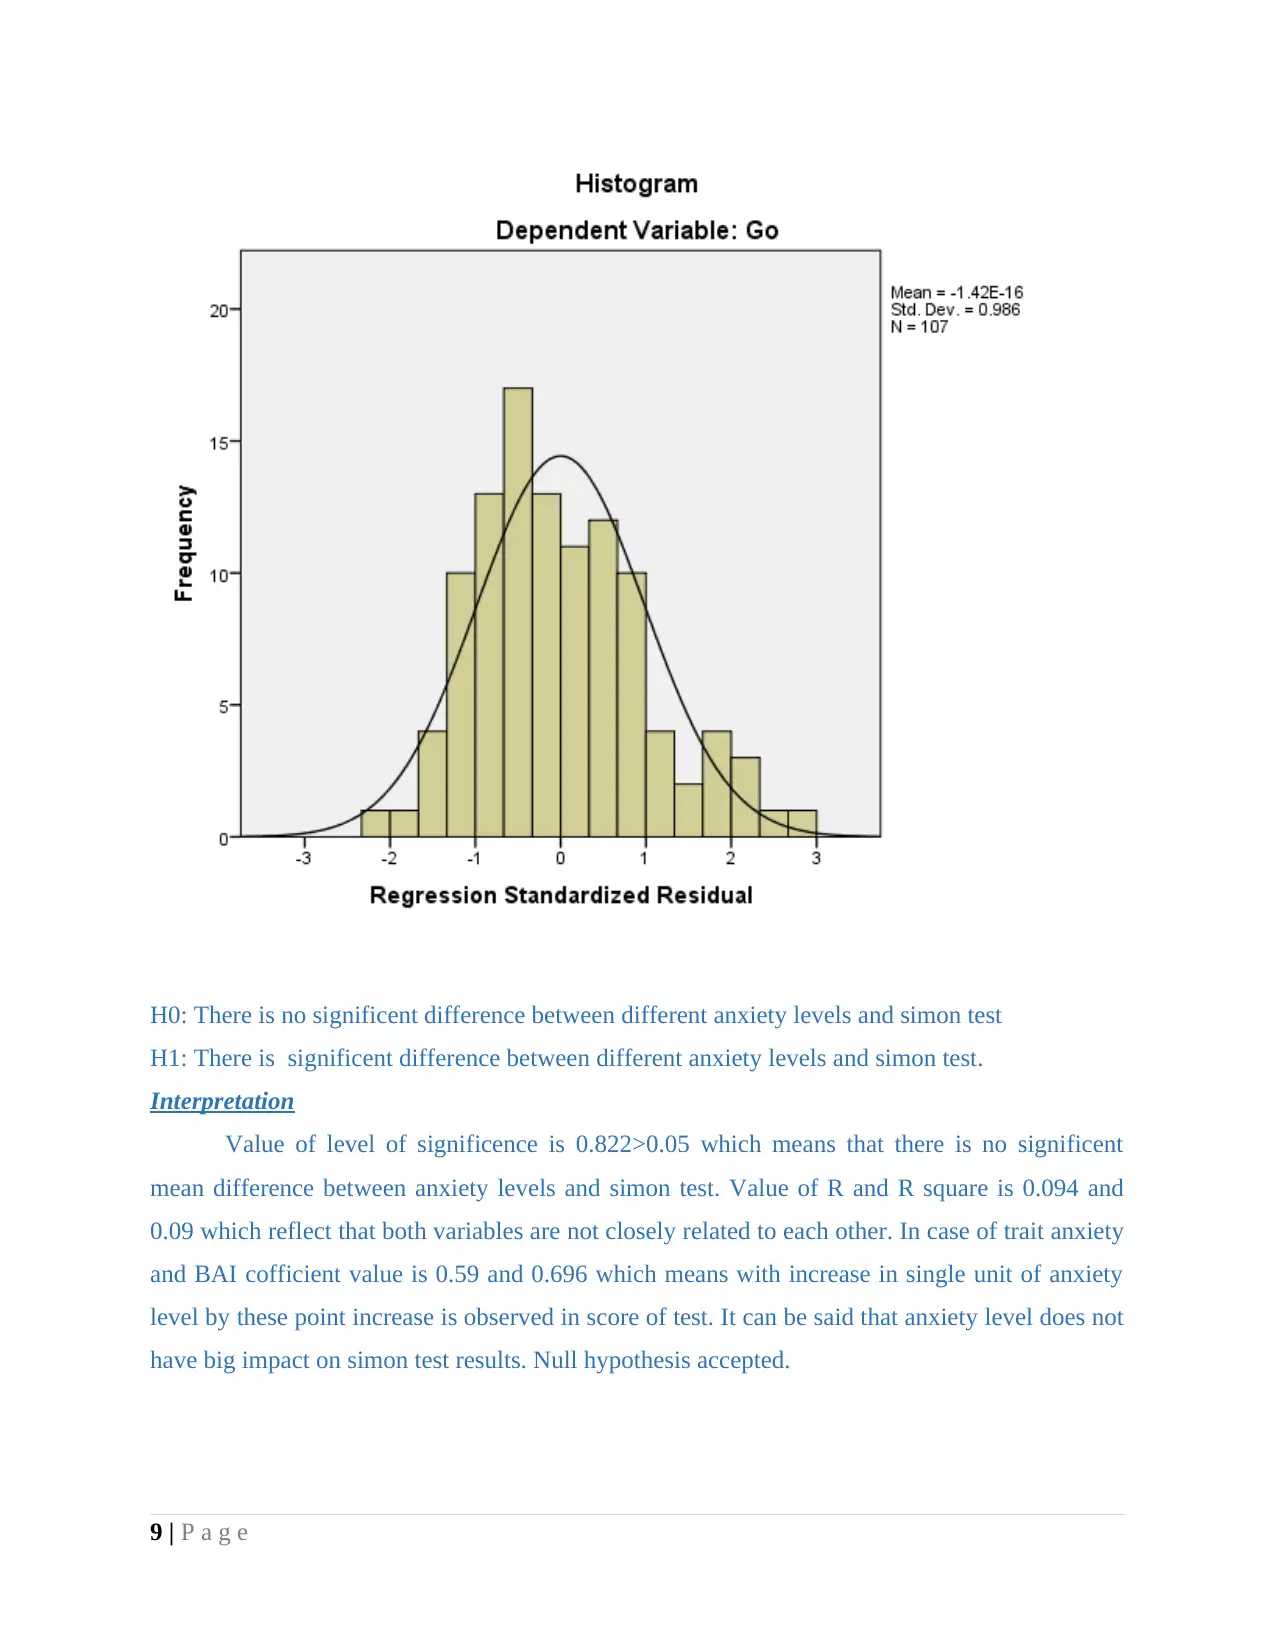
H0: There is no significent difference between different anxiety levels and simon test
H1: There is significent difference between different anxiety levels and simon test.
Interpretation
Value of level of significence is 0.822>0.05 which means that there is no significent
mean difference between anxiety levels and simon test. Value of R and R square is 0.094 and
0.09 which reflect that both variables are not closely related to each other. In case of trait anxiety
and BAI cofficient value is 0.59 and 0.696 which means with increase in single unit of anxiety
level by these point increase is observed in score of test. It can be said that anxiety level does not
have big impact on simon test results. Null hypothesis accepted.
9 | P a g e
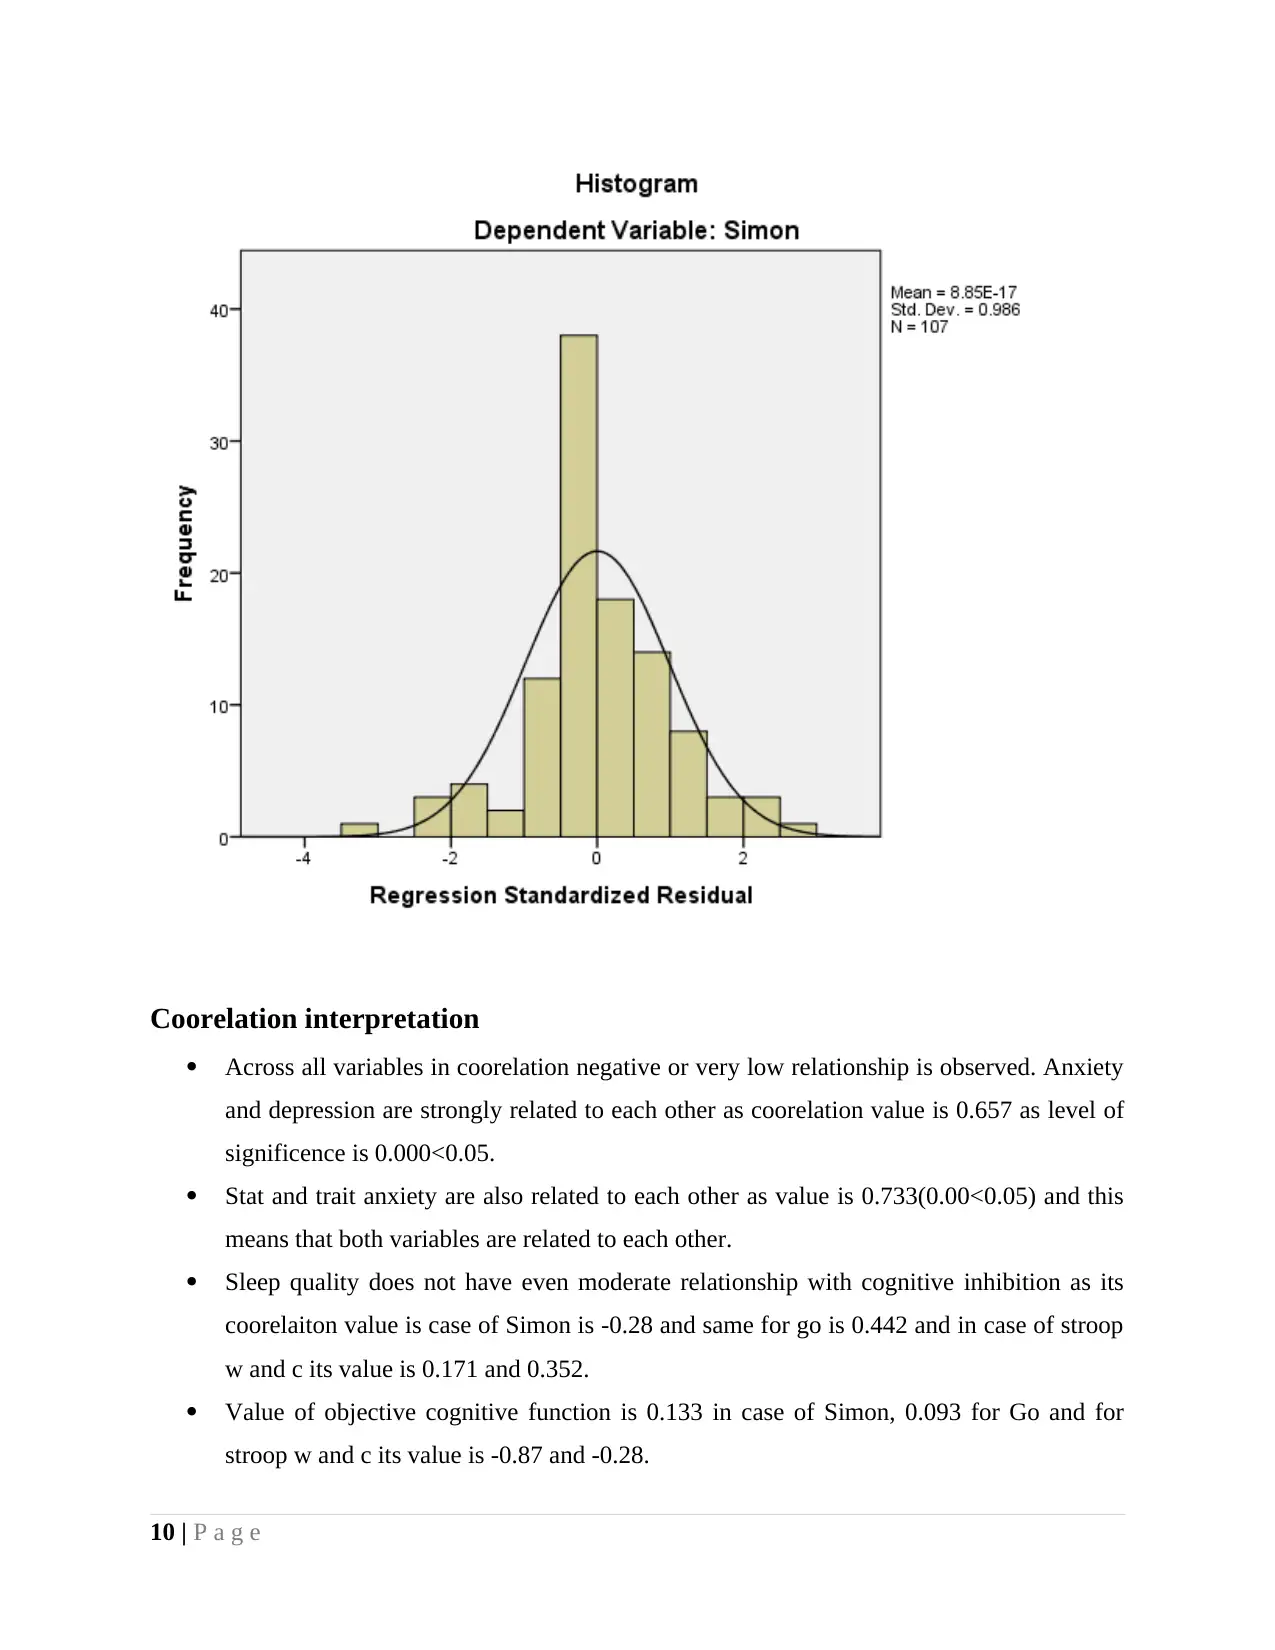
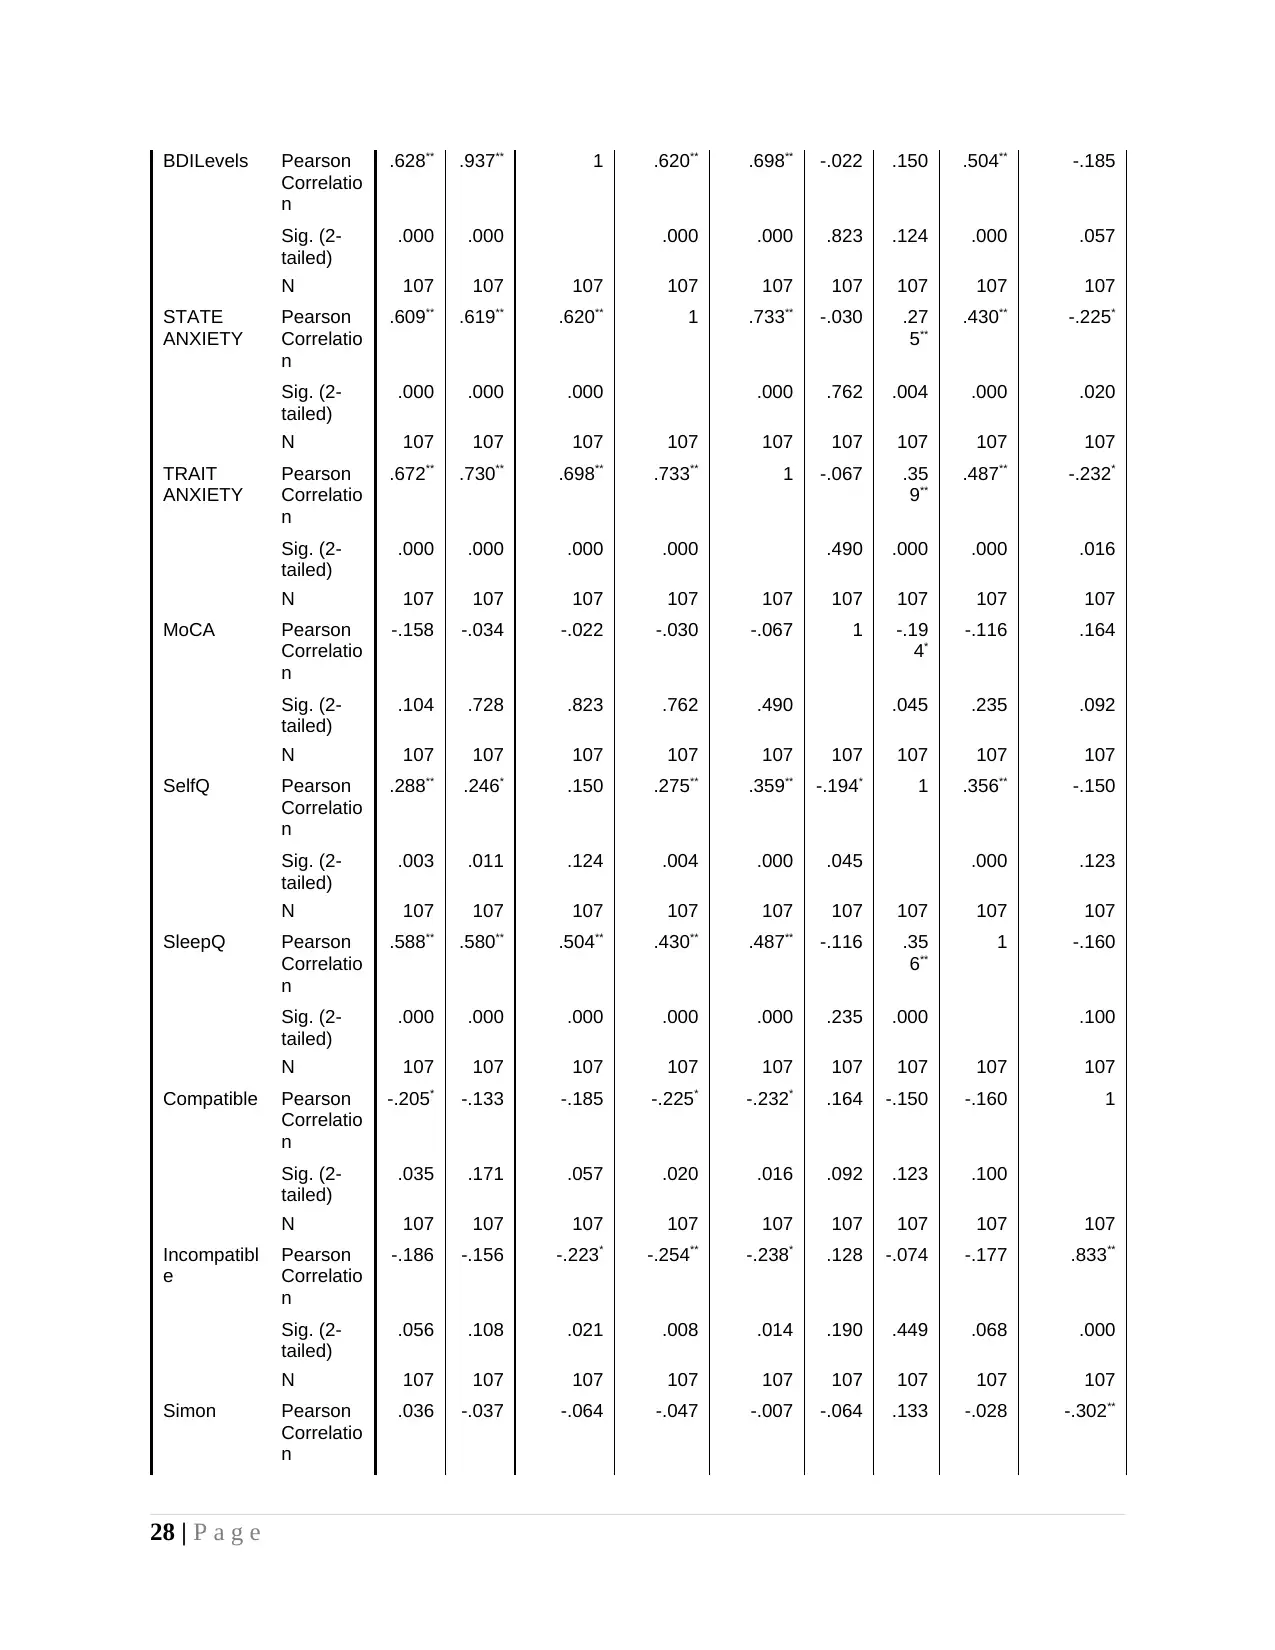
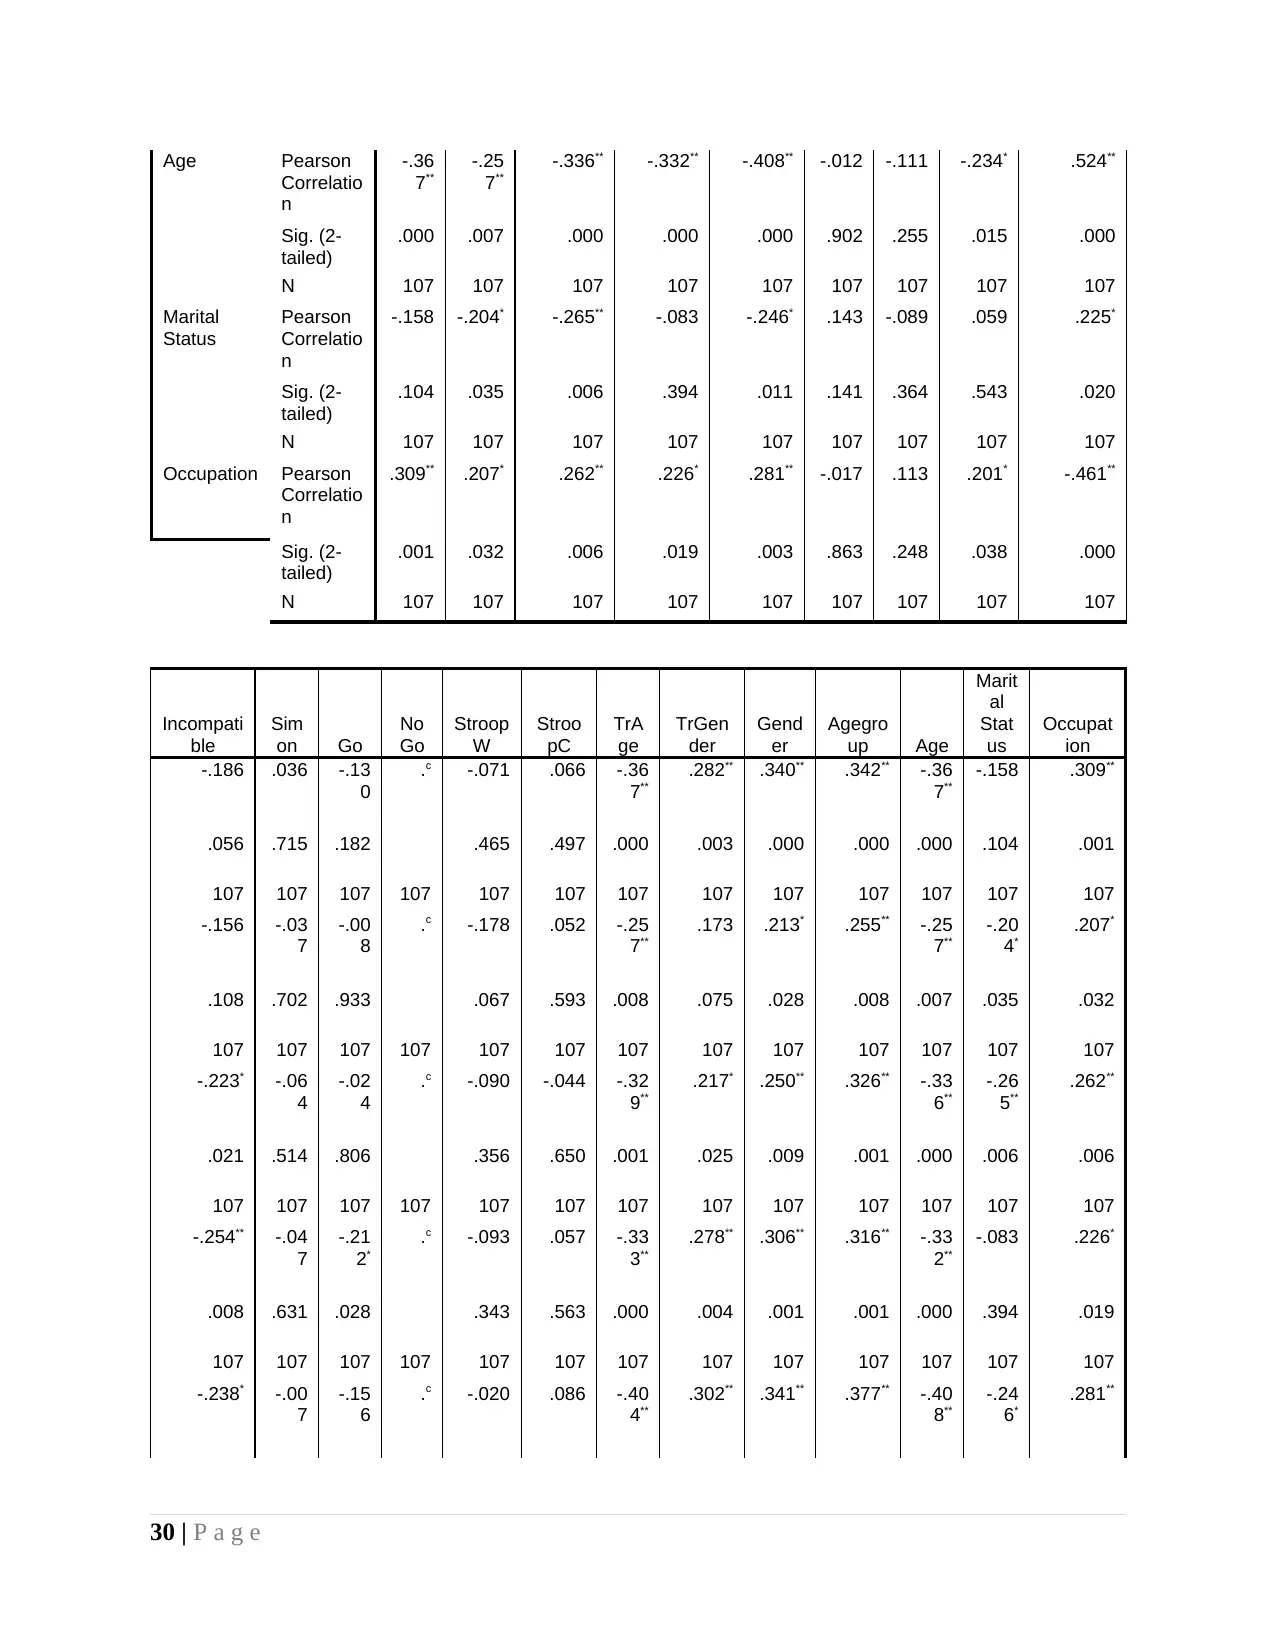
Coorelation interpretation
Across all variables in coorelation negative or very low relationship is observed. Anxiety
and depression are strongly related to each other as coorelation value is 0.657 as level of
significence is 0.000<0.05.
Stat and trait anxiety are also related to each other as value is 0.733(0.00<0.05) and this
means that both variables are related to each other.
Sleep quality does not have even moderate relationship with cognitive inhibition as its
coorelaiton value is case of Simon is -0.28 and same for go is 0.442 and in case of stroop
w and c its value is 0.171 and 0.352.
Value of objective cognitive function is 0.133 in case of Simon, 0.093 for Go and for
stroop w and c its value is -0.87 and -0.28.
10 | P a g e
In case of Self Q value of correlation is 0.133 for Simon,0.093 for Go,-0.44 in case of
stroop w and 0.091 in case of stroop c.
Low coorelation like earlier is observed between depression and cognitive inhibition.
Value of same for 0.036 in case of simon, -0.130 for go, -0.71 in case of stroop w and
0.66 in case of stroop c. It can be said that all these variables have very low coorelation
with cognitive inhibition.
11 | P a g e
Secure Best Marks with AI Grader
Need help grading? Try our AI Grader for instant feedback on your assignments.
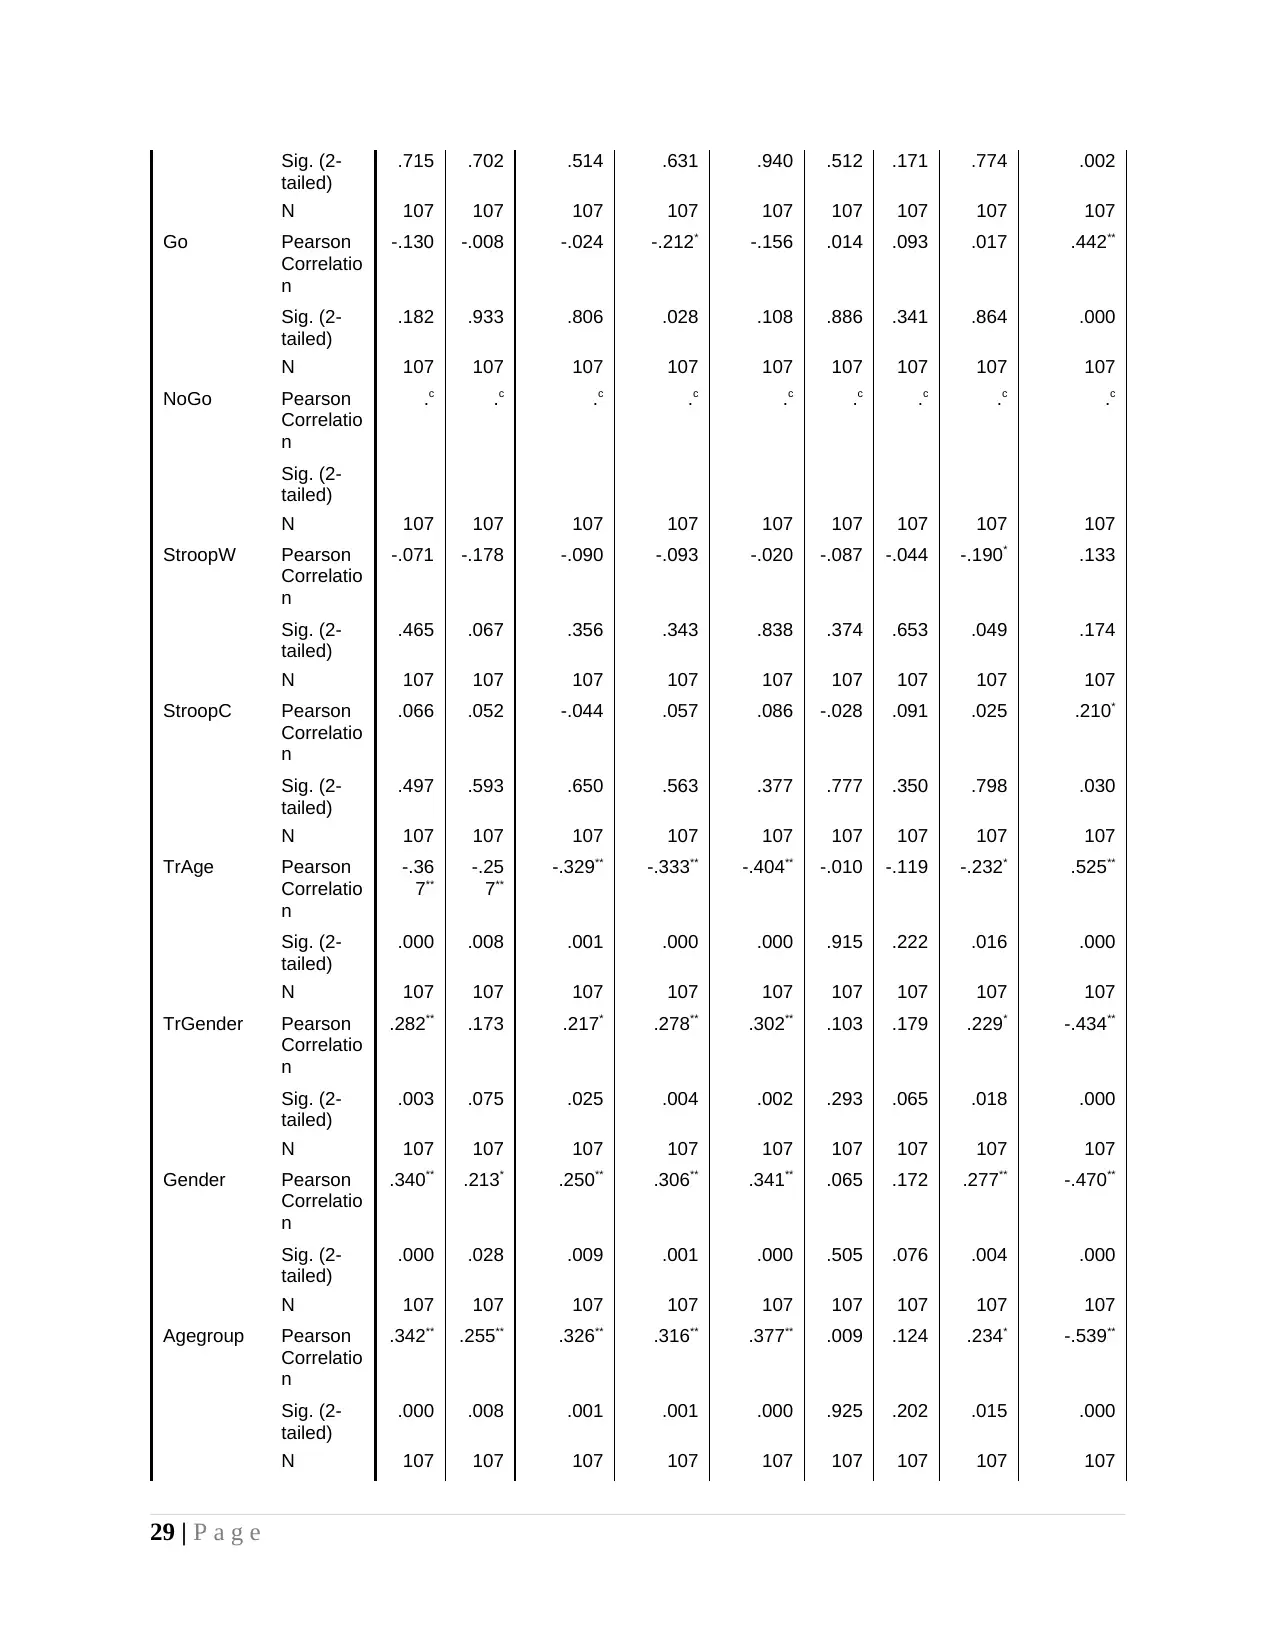
APPENDIX
Anxiety level and Simon task
Descriptive statistics
Descriptive Statistics
N Minimum Maximum Mean Std. Deviation
Compatible 107 352 888 552.19 113.710
Incompatible 107 421 939 587.41 112.747
Simon 107 -186 225 35.22 65.464
Valid N (listwise) 107
T test
Compatible group
ANOVA
Compatible
Sum of Squares df Mean Square F Sig.
Between Groups 639662.367 23 27811.407 3.158 .000
Within Groups 730907.894 83 8806.119
Total 1370570.262 106
Incompatible
ANOVA
Incompatible
Sum of Squares df Mean Square F Sig.
Between Groups 689852.599 23 29993.591 3.786 .000
Within Groups 657613.307 83 7923.052
Total 1347465.907 106
Compatible, incompatible and simon
ANOVA
Sum of Squares df Mean Square F Sig.
Incompatible Between Groups 689852.599 23 29993.591 3.786 .000
12 | P a g e
Within Groups 657613.307 83 7923.052
Total 1347465.907 106
Simon
Between Groups 169621.307 23 7374.839 2.150 .006
Within Groups 284651.310 83 3429.534
Total 454272.617 106
Compatible
Between Groups 639662.367 23 27811.407 3.158 .000
Within Groups 730907.894 83 8806.119
Total 1370570.262 106
Go, no Go
Descriptive Statistics
N Minimum Maximum Mean Std. Deviation
Go 107 309 654 455.07 73.740
NoGo 107 2000 2000 2000.00 .000
Valid N (listwise) 107
Tests of Normality
Agegroup Kolmogorov-Smirnova Shapiro-Wilk
Statistic df Sig. Statistic df Sig.
Go (50-80) older adults .075 53 .200* .981 53 .535
(18-25)Young group .093 54 .200* .968 54 .165
*. This is a lower bound of the true significance.
a. Lilliefors Significance Correction
Group Statistics
Agegroup N Mean Std. Deviation Std. Error Mean
Go (50-80) older adults 53 491.83 75.440 10.362
(18-25)Young group 54 419.00 51.133 6.958
Independent Samples Test
Levene's Test for
Equality of
Variances
t-test for Equality of Means
13 | P a g e
F Sig. t df Sig. (2-
tailed)
Mean
Difference
Std. Error
Difference
95% Confidence
Interval of the
Difference
Lower Upper
Go
Equal variances
assumed 7.258 .008 5.855 105 .000 72.830 12.438 48.167 97.493
Equal variances
not assumed 5.835 91.261 .000 72.830 12.482 48.037 97.623
Tests of Normality
Gender Kolmogorov-Smirnova Shapiro-Wilk
Statistic df Sig. Statistic df Sig.
Go
Old Males .128 21 .200* .940 21 .213
Old Females .094 32 .200* .980 32 .789
Young Males .127 23 .200* .939 23 .172
Young Females .089 31 .200* .975 31 .654
*. This is a lower bound of the true significance.
a. Lilliefors Significance Correction
Group Statistics
Gender N Mean Std. Deviation Std. Error Mean
Go Young Males 23 422.78 58.070 12.108
Young Females 31 416.19 46.120 8.283
Independent Samples Test
Levene's Test for
Equality of
Variances
t-test for Equality of Means
F Sig. t df Sig. (2-
tailed)
Mean
Difference
Std. Error
Difference
95% Confidence
Interval of the
Difference
Lower Upper
14 | P a g e
tailed)
Mean
Difference
Std. Error
Difference
95% Confidence
Interval of the
Difference
Lower Upper
Go
Equal variances
assumed 7.258 .008 5.855 105 .000 72.830 12.438 48.167 97.493
Equal variances
not assumed 5.835 91.261 .000 72.830 12.482 48.037 97.623
Tests of Normality
Gender Kolmogorov-Smirnova Shapiro-Wilk
Statistic df Sig. Statistic df Sig.
Go
Old Males .128 21 .200* .940 21 .213
Old Females .094 32 .200* .980 32 .789
Young Males .127 23 .200* .939 23 .172
Young Females .089 31 .200* .975 31 .654
*. This is a lower bound of the true significance.
a. Lilliefors Significance Correction
Group Statistics
Gender N Mean Std. Deviation Std. Error Mean
Go Young Males 23 422.78 58.070 12.108
Young Females 31 416.19 46.120 8.283
Independent Samples Test
Levene's Test for
Equality of
Variances
t-test for Equality of Means
F Sig. t df Sig. (2-
tailed)
Mean
Difference
Std. Error
Difference
95% Confidence
Interval of the
Difference
Lower Upper
14 | P a g e
Paraphrase This Document
Need a fresh take? Get an instant paraphrase of this document with our AI Paraphraser
Go
Equal variances
assumed .584 .448 .465 52 .644 6.589 14.177 -21.859 35.038
Equal variances
not assumed .449 40.850 .656 6.589 14.671 -23.042 36.220
Group Statistics
Gender N Mean Std. Deviation Std. Error Mean
Go Old Males 21 492.43 86.836 18.949
Old Females 32 491.44 68.419 12.095
Independent Samples Test
Levene's Test for
Equality of
Variances
t-test for Equality of Means
F Sig. t df Sig. (2-
tailed)
Mean
Difference
Std. Error
Difference
95% Confidence
Interval of the
Difference
Lower Upper
Go
Equal variances
assumed 3.403 .071 .046 51 .963 .991 21.393 -41.956 43.938
Equal variances
not assumed .044 35.784 .965 .991 22.480 -44.611 46.593
Anxiety level and Stroop
Descriptive Statistics
N Minimum Maximum Mean Std. Deviation
StroopW 107 413 1096 556.12 111.647
StroopC 107 543 1161 780.62 127.806
Valid N (listwise) 107
15 | P a g e
Equal variances
assumed .584 .448 .465 52 .644 6.589 14.177 -21.859 35.038
Equal variances
not assumed .449 40.850 .656 6.589 14.671 -23.042 36.220
Group Statistics
Gender N Mean Std. Deviation Std. Error Mean
Go Old Males 21 492.43 86.836 18.949
Old Females 32 491.44 68.419 12.095
Independent Samples Test
Levene's Test for
Equality of
Variances
t-test for Equality of Means
F Sig. t df Sig. (2-
tailed)
Mean
Difference
Std. Error
Difference
95% Confidence
Interval of the
Difference
Lower Upper
Go
Equal variances
assumed 3.403 .071 .046 51 .963 .991 21.393 -41.956 43.938
Equal variances
not assumed .044 35.784 .965 .991 22.480 -44.611 46.593
Anxiety level and Stroop
Descriptive Statistics
N Minimum Maximum Mean Std. Deviation
StroopW 107 413 1096 556.12 111.647
StroopC 107 543 1161 780.62 127.806
Valid N (listwise) 107
15 | P a g e
Tests of Normality
TrGender Kolmogorov-Smirnova Shapiro-Wilk
Statistic df Sig. Statistic df Sig.
StroopW
Old males .225 21 .007 .787 21 .000
.30 .239 32 .000 .717 32 .000
.48 .158 23 .141 .956 23 .387
.60 .146 31 .091 .883 31 .003
a. Lilliefors Significance Correction
Group Statistics
Agegroup N Mean Std. Deviation Std. Error Mean
StroopW (50-80) older adults 53 577.98 141.557 19.444
(18-25)Young group 54 534.66 65.745 8.947
Independent Samples Test
Levene's Test for
Equality of
Variances
t-test for Equality of Means
F Sig. t df Sig.
(2-
tailed)
Mean
Difference
Std. Error
Difference
95% Confidence
Interval of the
Difference
Lower Upper
StroopW
Equal
variances
assumed
7.256 .008 2.036 105 .044 43.324 21.274 1.141 85.506
Equal
variances not
assumed
2.024 73.133 .047 43.324 21.404 .667 85.980
Group Statistics
16 | P a g e
Gender N Mean Std. Deviation Std. Error Mean
StroopW Old Males 21 586.36 166.706 36.378
Old Females 32 572.48 124.918 22.083
Independent Samples Test
Levene's Test for
Equality of
Variances
t-test for Equality of Means
F Sig. t df Sig. (2-
tailed)
Mean
Difference
Std. Error
Difference
95% Confidence
Interval of the
Difference
Lower Upper
StroopW
Equal
variances
assumed
1.584 .214 .346 51 .731 13.873 40.095 -66.622 94.367
Equal
variances not
assumed
.326 34.438 .746 13.873 42.556 -72.571 100.317
Group Statistics
Gender N Mean Std. Deviation Std. Error Mean
StroopW Young Males 23 549.17 70.750 14.752
Young Females 31 523.89 60.697 10.902
Independent Samples Test
Levene's Test for
Equality of
Variances
t-test for Equality of Means
F Sig. t df Sig.
(2-
tailed)
Mean
Difference
Std. Error
Difference
95% Confidence
Interval of the
Difference
Lower Upper
17 | P a g e
Secure Best Marks with AI Grader
Need help grading? Try our AI Grader for instant feedback on your assignments.
StroopW
Equal
variances
assumed
2.097 .154 1.411 52 .164 25.287 17.927 -10.686 61.259
Equal
variances not
assumed
1.379 43.151 .175 25.287 18.343 -11.702 62.276
Group Statistics
Gender N Mean Std. Deviation Std. Error Mean
StroopC Young Males 23 750.39 111.397 23.228
Young Females 31 724.81 88.200 15.841
Independent Samples Test
Levene's Test for
Equality of
Variances
t-test for Equality of Means
F Sig. t df Sig. (2-
tailed)
Mean
Difference
Std. Error
Difference
95% Confidence
Interval of the
Difference
Lower Upper
StroopC
Equal
variances
assumed
.008 .929 .942 52 .350 25.585 27.157 -28.910 80.080
Equal
variances not
assumed
.910 40.758 .368 25.585 28.115 -31.205 82.375
Group Statistics
Gender N Mean Std. Deviation Std. Error Mean
StroopC Old Males 21 825.26 149.868 32.704
Old Females 32 827.13 132.861 23.487
18 | P a g e
Equal
variances
assumed
2.097 .154 1.411 52 .164 25.287 17.927 -10.686 61.259
Equal
variances not
assumed
1.379 43.151 .175 25.287 18.343 -11.702 62.276
Group Statistics
Gender N Mean Std. Deviation Std. Error Mean
StroopC Young Males 23 750.39 111.397 23.228
Young Females 31 724.81 88.200 15.841
Independent Samples Test
Levene's Test for
Equality of
Variances
t-test for Equality of Means
F Sig. t df Sig. (2-
tailed)
Mean
Difference
Std. Error
Difference
95% Confidence
Interval of the
Difference
Lower Upper
StroopC
Equal
variances
assumed
.008 .929 .942 52 .350 25.585 27.157 -28.910 80.080
Equal
variances not
assumed
.910 40.758 .368 25.585 28.115 -31.205 82.375
Group Statistics
Gender N Mean Std. Deviation Std. Error Mean
StroopC Old Males 21 825.26 149.868 32.704
Old Females 32 827.13 132.861 23.487
18 | P a g e
Independent Samples Test
Levene's Test for
Equality of
Variances
t-test for Equality of Means
F Sig. t df Sig. (2-
tailed)
Mean
Difference
Std. Error
Difference
95% Confidence
Interval of the
Difference
Lower Upper
StroopC
Equal
variances
assumed
.419 .520 -.047 51 .962 -1.863 39.255 -80.670 76.944
Equal
variances not
assumed
-.046 39.220 .963 -1.863 40.264 -83.290 79.564
Group Statistics
Agegroup N Mean Std. Deviation Std. Error Mean
StroopC (50-80) older adults 53 826.39 138.430 19.015
(18-25)Young group 54 735.70 98.577 13.415
Independent Samples Test
Levene's Test for
Equality of
Variances
t-test for Equality of Means
F Sig. t df Sig. (2-
tailed)
Mean
Difference
Std. Error
Difference
95% Confidence
Interval of the
Difference
Lower Upper
StroopC
Equal
variances
assumed
8.161 .005 3.909 105 .000 90.683 23.199 44.684 136.682
Equal
variances not
assumed
3.897 93.836 .000 90.683 23.270 44.478 136.888
19 | P a g e
Levene's Test for
Equality of
Variances
t-test for Equality of Means
F Sig. t df Sig. (2-
tailed)
Mean
Difference
Std. Error
Difference
95% Confidence
Interval of the
Difference
Lower Upper
StroopC
Equal
variances
assumed
.419 .520 -.047 51 .962 -1.863 39.255 -80.670 76.944
Equal
variances not
assumed
-.046 39.220 .963 -1.863 40.264 -83.290 79.564
Group Statistics
Agegroup N Mean Std. Deviation Std. Error Mean
StroopC (50-80) older adults 53 826.39 138.430 19.015
(18-25)Young group 54 735.70 98.577 13.415
Independent Samples Test
Levene's Test for
Equality of
Variances
t-test for Equality of Means
F Sig. t df Sig. (2-
tailed)
Mean
Difference
Std. Error
Difference
95% Confidence
Interval of the
Difference
Lower Upper
StroopC
Equal
variances
assumed
8.161 .005 3.909 105 .000 90.683 23.199 44.684 136.682
Equal
variances not
assumed
3.897 93.836 .000 90.683 23.270 44.478 136.888
19 | P a g e
2
Group Statistics
Agegroup N Mean Std. Deviation Std. Error Mean
StroopW (50-80) older adults 53 577.98 141.557 19.444
(18-25)Young group 54 534.66 65.745 8.947
Independent Samples Test
Levene's Test for
Equality of
Variances
t-test for Equality of Means
F Sig. t df Sig.
(2-
tailed)
Mean
Difference
Std. Error
Difference
95% Confidence
Interval of the
Difference
Lower Upper
StroopW
Equal
variances
assumed
7.256 .008 2.036 105 .044 43.324 21.274 1.141 85.506
Equal
variances not
assumed
2.024 73.133 .047 43.324 21.404 .667 85.980
Model Summary
Model R R Square Adjusted R
Square
Std. Error of the
Estimate
1 .128a .016 -.012 112.330
a. Predictors: (Constant), TRAIT ANXIETY, BAI, STATE ANXIETY
ANOVAa
20 | P a g e
Paraphrase This Document
Need a fresh take? Get an instant paraphrase of this document with our AI Paraphraser
Model Sum of Squares df Mean Square F Sig.
1
Regression 21634.790 3 7211.597 .572 .635b
Residual 1299661.500 103 12618.073
Total 1321296.290 106
a. Dependent Variable: StroopW
b. Predictors: (Constant), TRAIT ANXIETY, BAI, STATE ANXIETY
Coefficientsa
Model Unstandardized Coefficients Standardized
Coefficients
t Sig.
B Std. Error Beta
1
(Constant) 558.155 43.772 12.751 .000
BAI -.892 1.636 -.074 -.545 .587
STATE ANXIETY -1.359 1.339 -.150 -1.015 .313
TRAIT ANXIETY 1.357 1.538 .140 .882 .380
a. Dependent Variable: StroopW
Variables Entered/Removeda
Model Variables
Entered
Variables
Removed
Method
1
BAI, STATE
ANXIETY,
TRAIT
ANXIETYb
. Enter
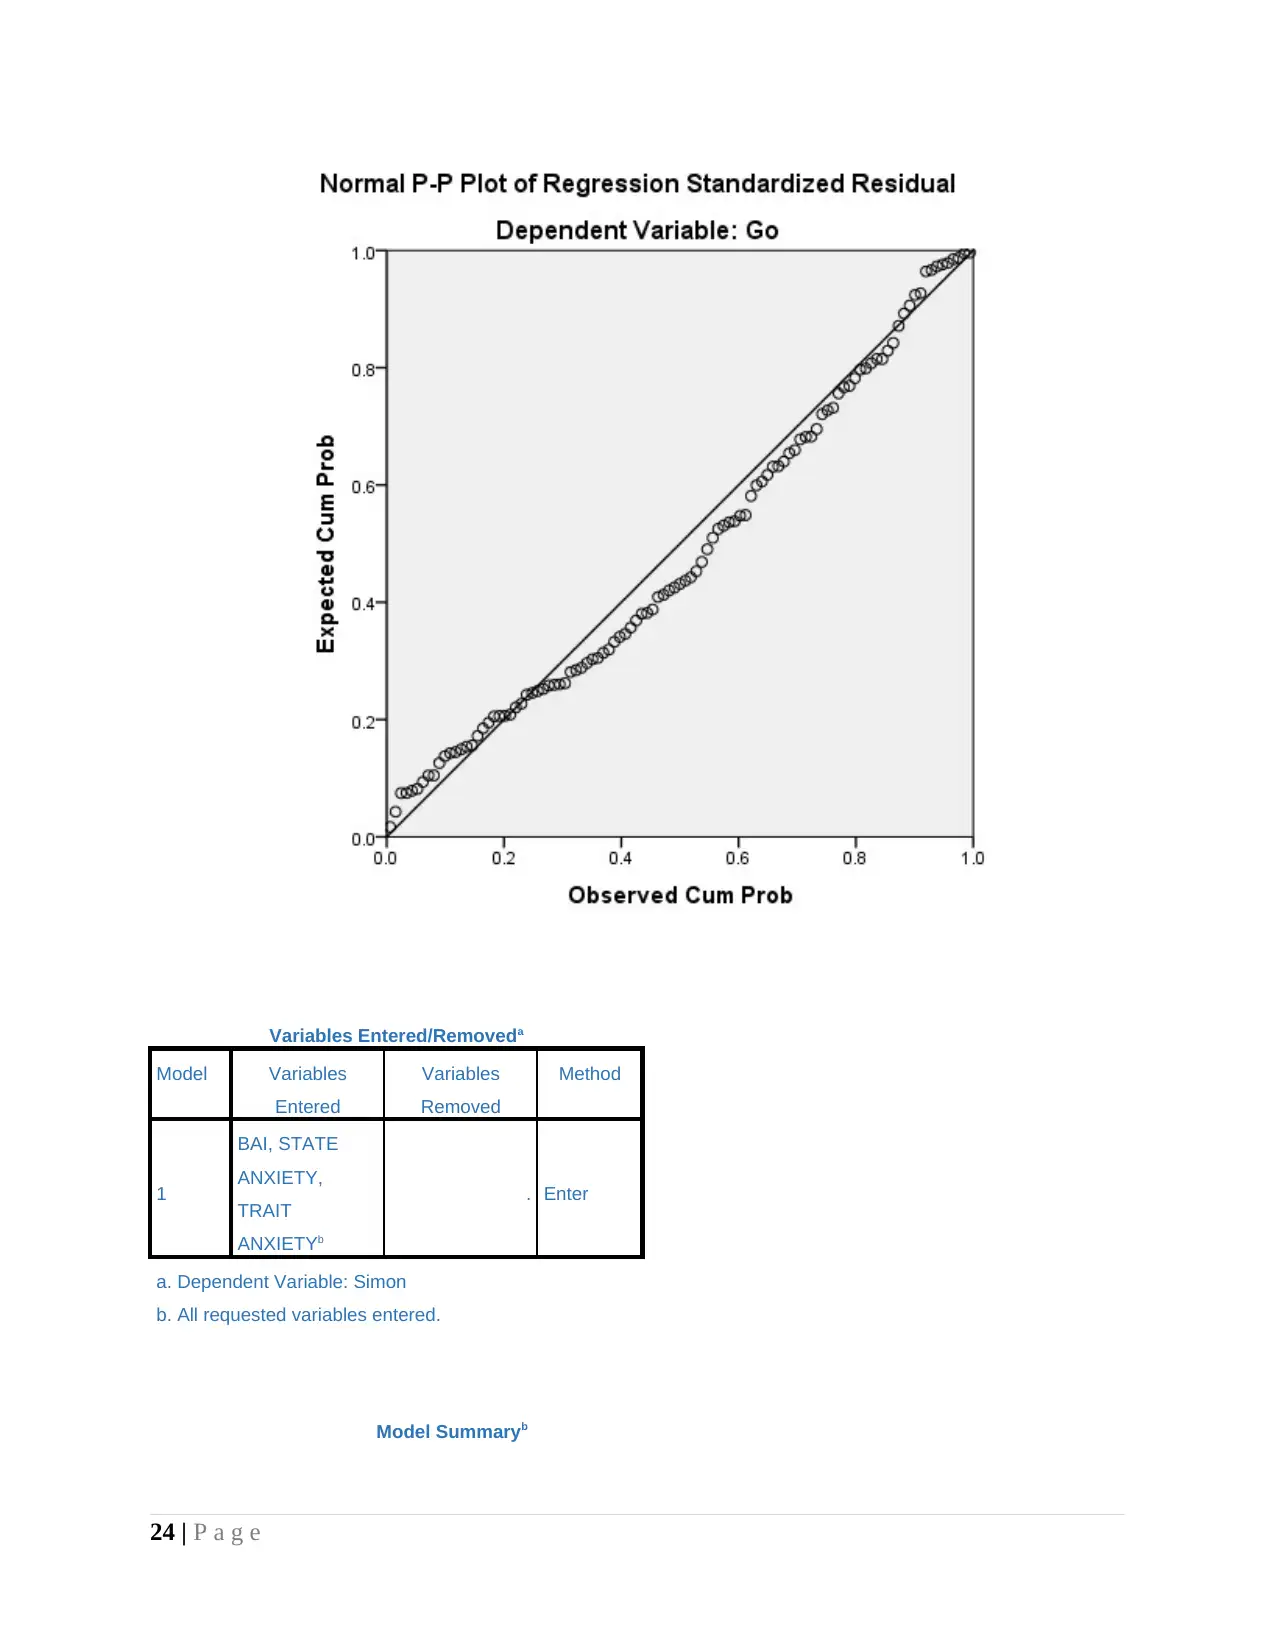
a. Dependent Variable: Go
b. All requested variables entered.
Model Summaryb
Model R R Square Adjusted R
Square
Std. Error of the
Estimate
1 .212a .045 .017 73.099
a. Predictors: (Constant), BAI, STATE ANXIETY, TRAIT ANXIETY
21 | P a g e
1
Regression 21634.790 3 7211.597 .572 .635b
Residual 1299661.500 103 12618.073
Total 1321296.290 106
a. Dependent Variable: StroopW
b. Predictors: (Constant), TRAIT ANXIETY, BAI, STATE ANXIETY
Coefficientsa
Model Unstandardized Coefficients Standardized
Coefficients
t Sig.
B Std. Error Beta
1
(Constant) 558.155 43.772 12.751 .000
BAI -.892 1.636 -.074 -.545 .587
STATE ANXIETY -1.359 1.339 -.150 -1.015 .313
TRAIT ANXIETY 1.357 1.538 .140 .882 .380
a. Dependent Variable: StroopW
Variables Entered/Removeda
Model Variables
Entered
Variables
Removed
Method
1
BAI, STATE
ANXIETY,
TRAIT
ANXIETYb
. Enter
a. Dependent Variable: Go
b. All requested variables entered.
Model Summaryb
Model R R Square Adjusted R
Square
Std. Error of the
Estimate
1 .212a .045 .017 73.099
a. Predictors: (Constant), BAI, STATE ANXIETY, TRAIT ANXIETY
21 | P a g e
b. Dependent Variable: Go
ANOVAa
Model Sum of Squares df Mean Square F Sig.
1
Regression 26010.866 3 8670.289 1.623 .189b
Residual 550378.536 103 5343.481
Total 576389.402 106
a. Dependent Variable: Go
b. Predictors: (Constant), BAI, STATE ANXIETY, TRAIT ANXIETY
Coefficientsa
Model Unstandardized Coefficients Standardized
Coefficients
t Sig.
B Std. Error Beta
1
(Constant) 498.701 28.485 17.508 .000
STATE ANXIETY -1.266 .871 -.211 -1.452 .149
TRAIT ANXIETY -.006 1.001 -.001 -.006 .995
BAI -.006 1.064 -.001 -.005 .996
a. Dependent Variable: Go
Residuals Statisticsa
Minimum Maximum Mean Std. Deviation N
Predicted Value 387.06 473.25 455.07 15.665 107
Residual -155.250 195.562 .000 72.057 107
Std. Predicted Value -4.342 1.160 .000 1.000 107
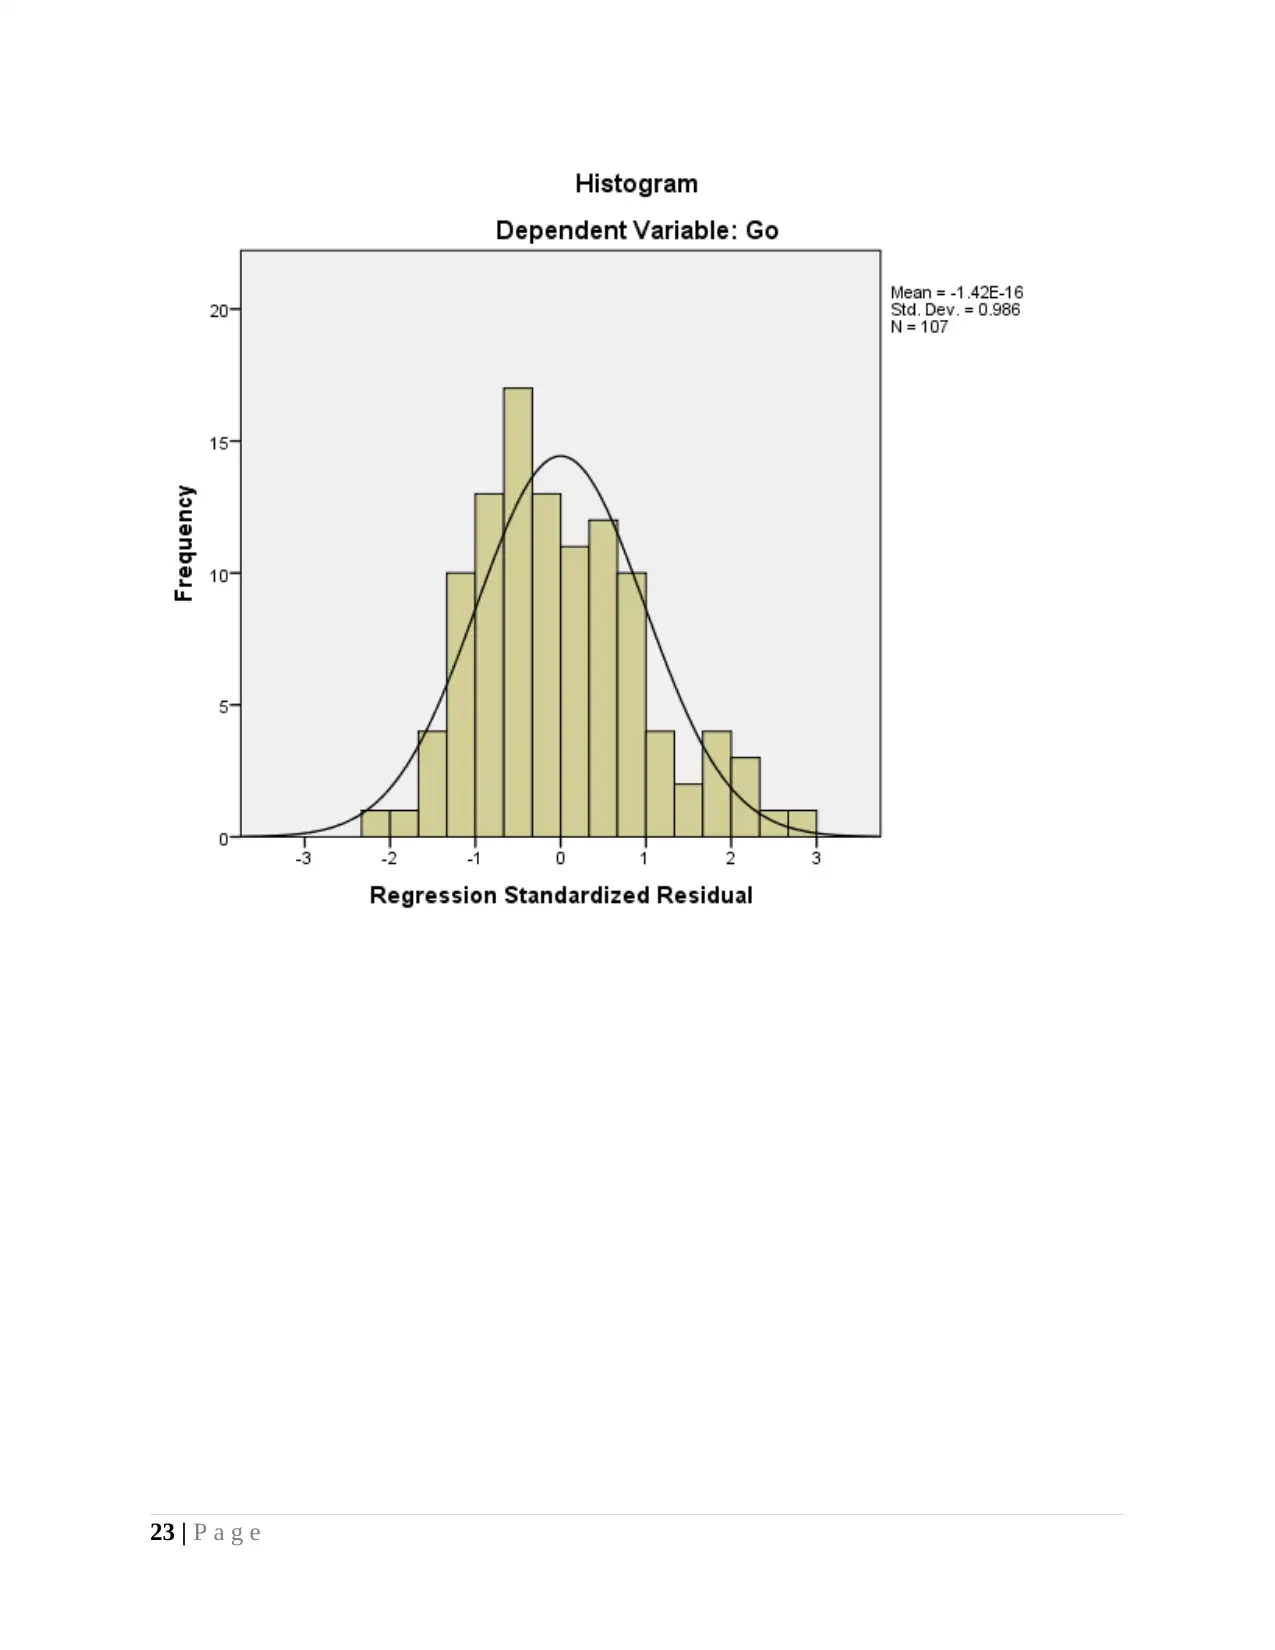
Std. Residual -2.124 2.675 .000 .986 107
a. Dependent Variable: Go
Charts
22 | P a g e
ANOVAa
Model Sum of Squares df Mean Square F Sig.
1
Regression 26010.866 3 8670.289 1.623 .189b
Residual 550378.536 103 5343.481
Total 576389.402 106
a. Dependent Variable: Go
b. Predictors: (Constant), BAI, STATE ANXIETY, TRAIT ANXIETY
Coefficientsa
Model Unstandardized Coefficients Standardized
Coefficients
t Sig.
B Std. Error Beta
1
(Constant) 498.701 28.485 17.508 .000
STATE ANXIETY -1.266 .871 -.211 -1.452 .149
TRAIT ANXIETY -.006 1.001 -.001 -.006 .995
BAI -.006 1.064 -.001 -.005 .996
a. Dependent Variable: Go
Residuals Statisticsa
Minimum Maximum Mean Std. Deviation N
Predicted Value 387.06 473.25 455.07 15.665 107
Residual -155.250 195.562 .000 72.057 107
Std. Predicted Value -4.342 1.160 .000 1.000 107
Std. Residual -2.124 2.675 .000 .986 107
a. Dependent Variable: Go
Charts
22 | P a g e
23 | P a g e
Secure Best Marks with AI Grader
Need help grading? Try our AI Grader for instant feedback on your assignments.
Variables Entered/Removeda
Model Variables
Entered
Variables
Removed
Method
1
BAI, STATE
ANXIETY,
TRAIT
ANXIETYb
. Enter
a. Dependent Variable: Simon
b. All requested variables entered.
Model Summaryb
24 | P a g e
Model Variables
Entered
Variables
Removed
Method
1
BAI, STATE
ANXIETY,
TRAIT
ANXIETYb
. Enter
a. Dependent Variable: Simon
b. All requested variables entered.
Model Summaryb
24 | P a g e
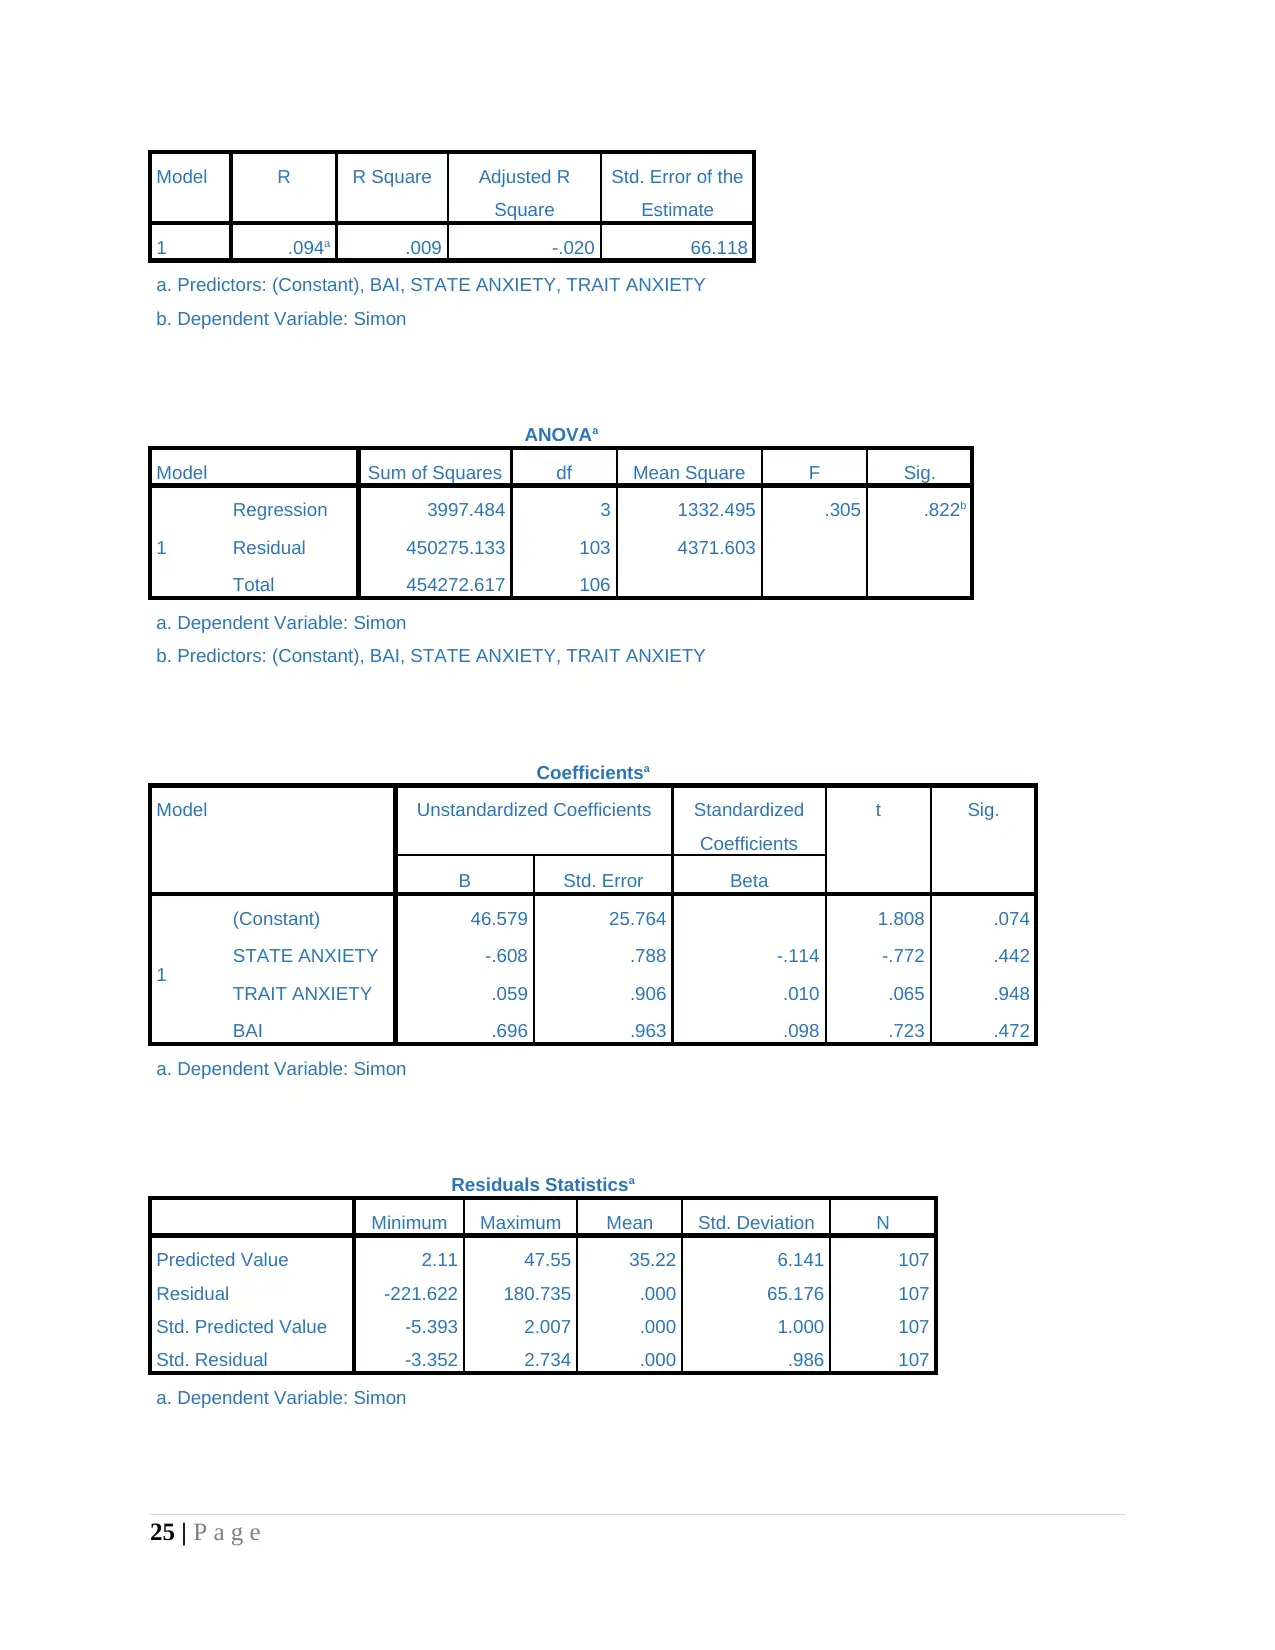
Model R R Square Adjusted R
Square
Std. Error of the
Estimate
1 .094a .009 -.020 66.118
a. Predictors: (Constant), BAI, STATE ANXIETY, TRAIT ANXIETY
b. Dependent Variable: Simon
ANOVAa
Model Sum of Squares df Mean Square F Sig.
1
Regression 3997.484 3 1332.495 .305 .822b
Residual 450275.133 103 4371.603
Total 454272.617 106
a. Dependent Variable: Simon
b. Predictors: (Constant), BAI, STATE ANXIETY, TRAIT ANXIETY
Coefficientsa
Model Unstandardized Coefficients Standardized
Coefficients
t Sig.
B Std. Error Beta
1
(Constant) 46.579 25.764 1.808 .074
STATE ANXIETY -.608 .788 -.114 -.772 .442
TRAIT ANXIETY .059 .906 .010 .065 .948
BAI .696 .963 .098 .723 .472
a. Dependent Variable: Simon
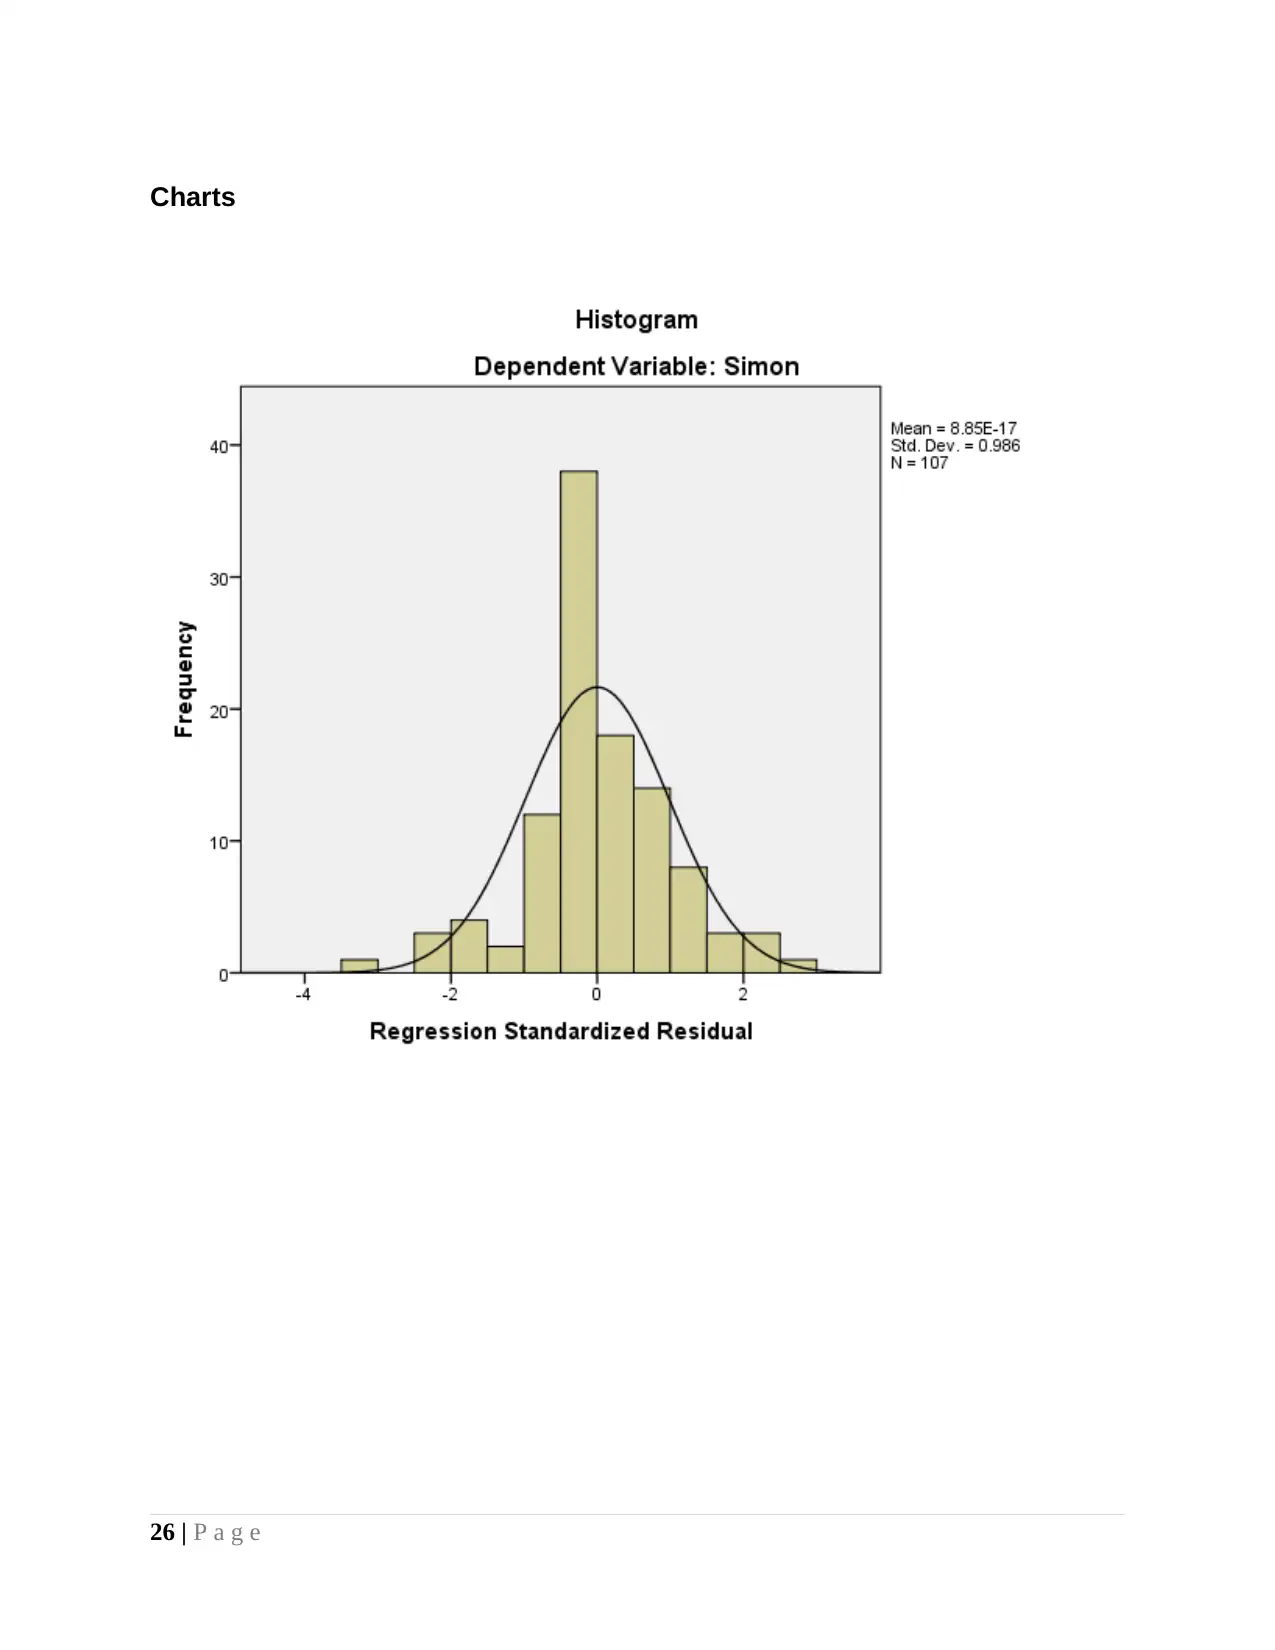
Residuals Statisticsa
Minimum Maximum Mean Std. Deviation N
Predicted Value 2.11 47.55 35.22 6.141 107
Residual -221.622 180.735 .000 65.176 107
Std. Predicted Value -5.393 2.007 .000 1.000 107
Std. Residual -3.352 2.734 .000 .986 107
a. Dependent Variable: Simon
25 | P a g e
Square
Std. Error of the
Estimate
1 .094a .009 -.020 66.118
a. Predictors: (Constant), BAI, STATE ANXIETY, TRAIT ANXIETY
b. Dependent Variable: Simon
ANOVAa
Model Sum of Squares df Mean Square F Sig.
1
Regression 3997.484 3 1332.495 .305 .822b
Residual 450275.133 103 4371.603
Total 454272.617 106
a. Dependent Variable: Simon
b. Predictors: (Constant), BAI, STATE ANXIETY, TRAIT ANXIETY
Coefficientsa
Model Unstandardized Coefficients Standardized
Coefficients
t Sig.
B Std. Error Beta
1
(Constant) 46.579 25.764 1.808 .074
STATE ANXIETY -.608 .788 -.114 -.772 .442
TRAIT ANXIETY .059 .906 .010 .065 .948
BAI .696 .963 .098 .723 .472
a. Dependent Variable: Simon
Residuals Statisticsa
Minimum Maximum Mean Std. Deviation N
Predicted Value 2.11 47.55 35.22 6.141 107
Residual -221.622 180.735 .000 65.176 107
Std. Predicted Value -5.393 2.007 .000 1.000 107
Std. Residual -3.352 2.734 .000 .986 107
a. Dependent Variable: Simon
25 | P a g e
Charts
26 | P a g e
26 | P a g e
Paraphrase This Document
Need a fresh take? Get an instant paraphrase of this document with our AI Paraphraser
3
BAI BDI
BDILevel
s
STATE
ANXIET
Y
TRAIT
ANXIET
Y
MoC
A
Self
Q
Sleep
Q
Compatibl
e
BAI Pearson
Correlatio
n
1 .657** .628** .609** .672** -.158 .28
8**
.588** -.205*
Sig. (2-
tailed)
.000 .000 .000 .000 .104 .003 .000 .035
N 107 107 107 107 107 107 107 107 107
BDI Pearson
Correlatio
n
.657** 1 .937** .619** .730** -.034 .246* .580** -.133
Sig. (2-
tailed)
.000 .000 .000 .000 .728 .011 .000 .171
N 107 107 107 107 107 107 107 107 107
27 | P a g e
BDILevels Pearson
Correlatio
n
.628** .937** 1 .620** .698** -.022 .150 .504** -.185
Sig. (2-
tailed)
.000 .000 .000 .000 .823 .124 .000 .057
N 107 107 107 107 107 107 107 107 107
STATE
ANXIETY
Pearson
Correlatio
n
.609** .619** .620** 1 .733** -.030 .27
5**
.430** -.225*
Sig. (2-
tailed)
.000 .000 .000 .000 .762 .004 .000 .020
N 107 107 107 107 107 107 107 107 107
TRAIT
ANXIETY
Pearson
Correlatio
n
.672** .730** .698** .733** 1 -.067 .35
9**
.487** -.232*
Sig. (2-
tailed)
.000 .000 .000 .000 .490 .000 .000 .016
N 107 107 107 107 107 107 107 107 107
MoCA Pearson
Correlatio
n
-.158 -.034 -.022 -.030 -.067 1 -.19
4*
-.116 .164
Sig. (2-
tailed)
.104 .728 .823 .762 .490 .045 .235 .092
N 107 107 107 107 107 107 107 107 107
SelfQ Pearson
Correlatio
n
.288** .246* .150 .275** .359** -.194* 1 .356** -.150
Sig. (2-
tailed)
.003 .011 .124 .004 .000 .045 .000 .123
N 107 107 107 107 107 107 107 107 107
SleepQ Pearson
Correlatio
n
.588** .580** .504** .430** .487** -.116 .35
6**
1 -.160
Sig. (2-
tailed)
.000 .000 .000 .000 .000 .235 .000 .100
N 107 107 107 107 107 107 107 107 107
Compatible Pearson
Correlatio
n
-.205* -.133 -.185 -.225* -.232* .164 -.150 -.160 1
Sig. (2-
tailed)
.035 .171 .057 .020 .016 .092 .123 .100
N 107 107 107 107 107 107 107 107 107
Incompatibl
e
Pearson
Correlatio
n
-.186 -.156 -.223* -.254** -.238* .128 -.074 -.177 .833**
Sig. (2-
tailed)
.056 .108 .021 .008 .014 .190 .449 .068 .000
N 107 107 107 107 107 107 107 107 107
Simon Pearson
Correlatio
n
.036 -.037 -.064 -.047 -.007 -.064 .133 -.028 -.302**
28 | P a g e
Correlatio
n
.628** .937** 1 .620** .698** -.022 .150 .504** -.185
Sig. (2-
tailed)
.000 .000 .000 .000 .823 .124 .000 .057
N 107 107 107 107 107 107 107 107 107
STATE
ANXIETY
Pearson
Correlatio
n
.609** .619** .620** 1 .733** -.030 .27
5**
.430** -.225*
Sig. (2-
tailed)
.000 .000 .000 .000 .762 .004 .000 .020
N 107 107 107 107 107 107 107 107 107
TRAIT
ANXIETY
Pearson
Correlatio
n
.672** .730** .698** .733** 1 -.067 .35
9**
.487** -.232*
Sig. (2-
tailed)
.000 .000 .000 .000 .490 .000 .000 .016
N 107 107 107 107 107 107 107 107 107
MoCA Pearson
Correlatio
n
-.158 -.034 -.022 -.030 -.067 1 -.19
4*
-.116 .164
Sig. (2-
tailed)
.104 .728 .823 .762 .490 .045 .235 .092
N 107 107 107 107 107 107 107 107 107
SelfQ Pearson
Correlatio
n
.288** .246* .150 .275** .359** -.194* 1 .356** -.150
Sig. (2-
tailed)
.003 .011 .124 .004 .000 .045 .000 .123
N 107 107 107 107 107 107 107 107 107
SleepQ Pearson
Correlatio
n
.588** .580** .504** .430** .487** -.116 .35
6**
1 -.160
Sig. (2-
tailed)
.000 .000 .000 .000 .000 .235 .000 .100
N 107 107 107 107 107 107 107 107 107
Compatible Pearson
Correlatio
n
-.205* -.133 -.185 -.225* -.232* .164 -.150 -.160 1
Sig. (2-
tailed)
.035 .171 .057 .020 .016 .092 .123 .100
N 107 107 107 107 107 107 107 107 107
Incompatibl
e
Pearson
Correlatio
n
-.186 -.156 -.223* -.254** -.238* .128 -.074 -.177 .833**
Sig. (2-
tailed)
.056 .108 .021 .008 .014 .190 .449 .068 .000
N 107 107 107 107 107 107 107 107 107
Simon Pearson
Correlatio
n
.036 -.037 -.064 -.047 -.007 -.064 .133 -.028 -.302**
28 | P a g e
Sig. (2-
tailed)
.715 .702 .514 .631 .940 .512 .171 .774 .002
N 107 107 107 107 107 107 107 107 107
Go Pearson
Correlatio
n
-.130 -.008 -.024 -.212* -.156 .014 .093 .017 .442**
Sig. (2-
tailed)
.182 .933 .806 .028 .108 .886 .341 .864 .000
N 107 107 107 107 107 107 107 107 107
NoGo Pearson
Correlatio
n
.c .c .c .c .c .c .c .c .c
Sig. (2-
tailed)
N 107 107 107 107 107 107 107 107 107
StroopW Pearson
Correlatio
n
-.071 -.178 -.090 -.093 -.020 -.087 -.044 -.190* .133
Sig. (2-
tailed)
.465 .067 .356 .343 .838 .374 .653 .049 .174
N 107 107 107 107 107 107 107 107 107
StroopC Pearson
Correlatio
n
.066 .052 -.044 .057 .086 -.028 .091 .025 .210*
Sig. (2-
tailed)
.497 .593 .650 .563 .377 .777 .350 .798 .030
N 107 107 107 107 107 107 107 107 107
TrAge Pearson
Correlatio
n
-.36
7**
-.25
7**
-.329** -.333** -.404** -.010 -.119 -.232* .525**
Sig. (2-
tailed)
.000 .008 .001 .000 .000 .915 .222 .016 .000
N 107 107 107 107 107 107 107 107 107
TrGender Pearson
Correlatio
n
.282** .173 .217* .278** .302** .103 .179 .229* -.434**
Sig. (2-
tailed)
.003 .075 .025 .004 .002 .293 .065 .018 .000
N 107 107 107 107 107 107 107 107 107
Gender Pearson
Correlatio
n
.340** .213* .250** .306** .341** .065 .172 .277** -.470**
Sig. (2-
tailed)
.000 .028 .009 .001 .000 .505 .076 .004 .000
N 107 107 107 107 107 107 107 107 107
Agegroup Pearson
Correlatio
n
.342** .255** .326** .316** .377** .009 .124 .234* -.539**
Sig. (2-
tailed)
.000 .008 .001 .001 .000 .925 .202 .015 .000
N 107 107 107 107 107 107 107 107 107
29 | P a g e
tailed)
.715 .702 .514 .631 .940 .512 .171 .774 .002
N 107 107 107 107 107 107 107 107 107
Go Pearson
Correlatio
n
-.130 -.008 -.024 -.212* -.156 .014 .093 .017 .442**
Sig. (2-
tailed)
.182 .933 .806 .028 .108 .886 .341 .864 .000
N 107 107 107 107 107 107 107 107 107
NoGo Pearson
Correlatio
n
.c .c .c .c .c .c .c .c .c
Sig. (2-
tailed)
N 107 107 107 107 107 107 107 107 107
StroopW Pearson
Correlatio
n
-.071 -.178 -.090 -.093 -.020 -.087 -.044 -.190* .133
Sig. (2-
tailed)
.465 .067 .356 .343 .838 .374 .653 .049 .174
N 107 107 107 107 107 107 107 107 107
StroopC Pearson
Correlatio
n
.066 .052 -.044 .057 .086 -.028 .091 .025 .210*
Sig. (2-
tailed)
.497 .593 .650 .563 .377 .777 .350 .798 .030
N 107 107 107 107 107 107 107 107 107
TrAge Pearson
Correlatio
n
-.36
7**
-.25
7**
-.329** -.333** -.404** -.010 -.119 -.232* .525**
Sig. (2-
tailed)
.000 .008 .001 .000 .000 .915 .222 .016 .000
N 107 107 107 107 107 107 107 107 107
TrGender Pearson
Correlatio
n
.282** .173 .217* .278** .302** .103 .179 .229* -.434**
Sig. (2-
tailed)
.003 .075 .025 .004 .002 .293 .065 .018 .000
N 107 107 107 107 107 107 107 107 107
Gender Pearson
Correlatio
n
.340** .213* .250** .306** .341** .065 .172 .277** -.470**
Sig. (2-
tailed)
.000 .028 .009 .001 .000 .505 .076 .004 .000
N 107 107 107 107 107 107 107 107 107
Agegroup Pearson
Correlatio
n
.342** .255** .326** .316** .377** .009 .124 .234* -.539**
Sig. (2-
tailed)
.000 .008 .001 .001 .000 .925 .202 .015 .000
N 107 107 107 107 107 107 107 107 107
29 | P a g e
Secure Best Marks with AI Grader
Need help grading? Try our AI Grader for instant feedback on your assignments.
Age Pearson
Correlatio
n
-.36
7**
-.25
7**
-.336** -.332** -.408** -.012 -.111 -.234* .524**
Sig. (2-
tailed)
.000 .007 .000 .000 .000 .902 .255 .015 .000
N 107 107 107 107 107 107 107 107 107
Marital
Status
Pearson
Correlatio
n
-.158 -.204* -.265** -.083 -.246* .143 -.089 .059 .225*
Sig. (2-
tailed)
.104 .035 .006 .394 .011 .141 .364 .543 .020
N 107 107 107 107 107 107 107 107 107
Occupation Pearson
Correlatio
n
.309** .207* .262** .226* .281** -.017 .113 .201* -.461**
Sig. (2-
tailed)
.001 .032 .006 .019 .003 .863 .248 .038 .000
N 107 107 107 107 107 107 107 107 107
Incompati
ble
Sim
on Go
No
Go
Stroop
W
Stroo
pC
TrA
ge
TrGen
der
Gend
er
Agegro
up Age
Marit
al
Stat
us
Occupat
ion
-.186 .036 -.13
0
.c -.071 .066 -.36
7**
.282** .340** .342** -.36
7**
-.158 .309**
.056 .715 .182 .465 .497 .000 .003 .000 .000 .000 .104 .001
107 107 107 107 107 107 107 107 107 107 107 107 107
-.156 -.03
7
-.00
8
.c -.178 .052 -.25
7**
.173 .213* .255** -.25
7**
-.20
4*
.207*
.108 .702 .933 .067 .593 .008 .075 .028 .008 .007 .035 .032
107 107 107 107 107 107 107 107 107 107 107 107 107
-.223* -.06
4
-.02
4
.c -.090 -.044 -.32
9**
.217* .250** .326** -.33
6**
-.26
5**
.262**
.021 .514 .806 .356 .650 .001 .025 .009 .001 .000 .006 .006
107 107 107 107 107 107 107 107 107 107 107 107 107
-.254** -.04
7
-.21
2*
.c -.093 .057 -.33
3**
.278** .306** .316** -.33
2**
-.083 .226*
.008 .631 .028 .343 .563 .000 .004 .001 .001 .000 .394 .019
107 107 107 107 107 107 107 107 107 107 107 107 107
-.238* -.00
7
-.15
6
.c -.020 .086 -.40
4**
.302** .341** .377** -.40
8**
-.24
6*
.281**
30 | P a g e
Correlatio
n
-.36
7**
-.25
7**
-.336** -.332** -.408** -.012 -.111 -.234* .524**
Sig. (2-
tailed)
.000 .007 .000 .000 .000 .902 .255 .015 .000
N 107 107 107 107 107 107 107 107 107
Marital
Status
Pearson
Correlatio
n
-.158 -.204* -.265** -.083 -.246* .143 -.089 .059 .225*
Sig. (2-
tailed)
.104 .035 .006 .394 .011 .141 .364 .543 .020
N 107 107 107 107 107 107 107 107 107
Occupation Pearson
Correlatio
n
.309** .207* .262** .226* .281** -.017 .113 .201* -.461**
Sig. (2-
tailed)
.001 .032 .006 .019 .003 .863 .248 .038 .000
N 107 107 107 107 107 107 107 107 107
Incompati
ble
Sim
on Go
No
Go
Stroop
W
Stroo
pC
TrA
ge
TrGen
der
Gend
er
Agegro
up Age
Marit
al
Stat
us
Occupat
ion
-.186 .036 -.13
0
.c -.071 .066 -.36
7**
.282** .340** .342** -.36
7**
-.158 .309**
.056 .715 .182 .465 .497 .000 .003 .000 .000 .000 .104 .001
107 107 107 107 107 107 107 107 107 107 107 107 107
-.156 -.03
7
-.00
8
.c -.178 .052 -.25
7**
.173 .213* .255** -.25
7**
-.20
4*
.207*
.108 .702 .933 .067 .593 .008 .075 .028 .008 .007 .035 .032
107 107 107 107 107 107 107 107 107 107 107 107 107
-.223* -.06
4
-.02
4
.c -.090 -.044 -.32
9**
.217* .250** .326** -.33
6**
-.26
5**
.262**
.021 .514 .806 .356 .650 .001 .025 .009 .001 .000 .006 .006
107 107 107 107 107 107 107 107 107 107 107 107 107
-.254** -.04
7
-.21
2*
.c -.093 .057 -.33
3**
.278** .306** .316** -.33
2**
-.083 .226*
.008 .631 .028 .343 .563 .000 .004 .001 .001 .000 .394 .019
107 107 107 107 107 107 107 107 107 107 107 107 107
-.238* -.00
7
-.15
6
.c -.020 .086 -.40
4**
.302** .341** .377** -.40
8**
-.24
6*
.281**
30 | P a g e
.014 .940 .108 .838 .377 .000 .002 .000 .000 .000 .011 .003
107 107 107 107 107 107 107 107 107 107 107 107 107
.128 -.06
4
.014 .c -.087 -.028 -.01
0
.103 .065 .009 -.01
2
.143 -.017
.190 .512 .886 .374 .777 .915 .293 .505 .925 .902 .141 .863
107 107 107 107 107 107 107 107 107 107 107 107 107
-.074 .133 .093 .c -.044 .091 -.11
9
.179 .172 .124 -.11
1
-.089 .113
.449 .171 .341 .653 .350 .222 .065 .076 .202 .255 .364 .248
107 107 107 107 107 107 107 107 107 107 107 107 107
-.177 -.02
8
.017 .c -.190* .025 -.23
2*
.229* .277** .234* -.23
4*
.059 .201*
.068 .774 .864 .049 .798 .016 .018 .004 .015 .015 .543 .038
107 107 107 107 107 107 107 107 107 107 107 107 107
.833** -.30
2**
.44
2**
.c .133 .210* .52
5**
-.434** -.47
0**
-.539** .52
4**
.225* -.461**
.000 .002 .000 .174 .030 .000 .000 .000 .000 .000 .020 .000
107 107 107 107 107 107 107 107 107 107 107 107 107
1 .27
6**
.48
1**
.c .171 .352** .58
9**
-.479** -.51
9**
-.603** .58
9**
.26
8**
-.543**
.004 .000 .079 .000 .000 .000 .000 .000 .000 .005 .000
107 107 107 107 107 107 107 107 107 107 107 107 107
.276** 1 .062 .c .064 .241* .103 -.070 -.079 -.103 .104 .071 -.135
.004 .529 .515 .012 .292 .471 .420 .292 .286 .466 .164
107 107 107 107 107 107 107 107 107 107 107 107 107
.481** .062 1 .c .060 .284** .49
5**
-.432** -.45
5**
-.496** .49
2**
.39
8**
-.456**
.000 .529 .539 .003 .000 .000 .000 .000 .000 .000 .000
107 107 107 107 107 107 107 107 107 107 107 107 107
.c .c .c .c .c .c .c .c .c .c .c .c .c
107 107 107 107 107 107 107 107 107 107 107 107 107
31 | P a g e
107 107 107 107 107 107 107 107 107 107 107 107 107
.128 -.06
4
.014 .c -.087 -.028 -.01
0
.103 .065 .009 -.01
2
.143 -.017
.190 .512 .886 .374 .777 .915 .293 .505 .925 .902 .141 .863
107 107 107 107 107 107 107 107 107 107 107 107 107
-.074 .133 .093 .c -.044 .091 -.11
9
.179 .172 .124 -.11
1
-.089 .113
.449 .171 .341 .653 .350 .222 .065 .076 .202 .255 .364 .248
107 107 107 107 107 107 107 107 107 107 107 107 107
-.177 -.02
8
.017 .c -.190* .025 -.23
2*
.229* .277** .234* -.23
4*
.059 .201*
.068 .774 .864 .049 .798 .016 .018 .004 .015 .015 .543 .038
107 107 107 107 107 107 107 107 107 107 107 107 107
.833** -.30
2**
.44
2**
.c .133 .210* .52
5**
-.434** -.47
0**
-.539** .52
4**
.225* -.461**
.000 .002 .000 .174 .030 .000 .000 .000 .000 .000 .020 .000
107 107 107 107 107 107 107 107 107 107 107 107 107
1 .27
6**
.48
1**
.c .171 .352** .58
9**
-.479** -.51
9**
-.603** .58
9**
.26
8**
-.543**
.004 .000 .079 .000 .000 .000 .000 .000 .000 .005 .000
107 107 107 107 107 107 107 107 107 107 107 107 107
.276** 1 .062 .c .064 .241* .103 -.070 -.079 -.103 .104 .071 -.135
.004 .529 .515 .012 .292 .471 .420 .292 .286 .466 .164
107 107 107 107 107 107 107 107 107 107 107 107 107
.481** .062 1 .c .060 .284** .49
5**
-.432** -.45
5**
-.496** .49
2**
.39
8**
-.456**
.000 .529 .539 .003 .000 .000 .000 .000 .000 .000 .000
107 107 107 107 107 107 107 107 107 107 107 107 107
.c .c .c .c .c .c .c .c .c .c .c .c .c
107 107 107 107 107 107 107 107 107 107 107 107 107
31 | P a g e
.171 .064 .060 .c 1 .188 .187 -.203* -.213* -.195* .184 .056 -.043
.079 .515 .539 .052 .054 .036 .027 .044 .058 .563 .661
107 107 107 107 107 107 107 107 107 107 107 107 107
.352** .241* .28
4**
.c .188 1 .35
3**
-.316** -.34
0**
-.356** .36
0**
.164 -.364**
.000 .012 .003 .052 .000 .001 .000 .000 .000 .092 .000
107 107 107 107 107 107 107 107 107 107 107 107 107
.589** .103 .49
5**
.c .187 .353** 1 -.844** -.88
6**
-.993** .99
8**
.59
2**
-.880**
.000 .292 .000 .054 .000 .000 .000 .000 .000 .000 .000
107 107 107 107 107 107 107 107 107 107 107 107 107
-.479** -.07
0
-.43
2**
.c -.203* -.316** -.84
4**
1 .978** .853** -.84
0**
-.47
0**
.755**
.000 .471 .000 .036 .001 .000 .000 .000 .000 .000 .000
107 107 107 107 107 107 107 107 107 107 107 107 107
-.519** -.07
9
-.45
5**
.c -.213* -.340** -.88
6**
.978** 1 .895** -.88
3**
-.48
7**
.796**
.000 .420 .000 .027 .000 .000 .000 .000 .000 .000 .000
107 107 107 107 107 107 107 107 107 107 107 107 107
-.603** -.10
3
-.49
6**
.c -.195* -.356** -.99
3**
.853** .895** 1 -.99
0**
-.58
4**
.887**
.000 .292 .000 .044 .000 .000 .000 .000 .000 .000 .000
107 107 107 107 107 107 107 107 107 107 107 107 107
.589** .104 .49
2**
.c .184 .360** .99
8**
-.840** -.88
3**
-.990** 1 .57
6**
-.878**
.000 .286 .000 .058 .000 .000 .000 .000 .000 .000 .000
107 107 107 107 107 107 107 107 107 107 107 107 107
.268** .071 .39
8**
.c .056 .164 .59
2**
-.470** -.48
7**
-.584** .57
6**
1 -.501**
.005 .466 .000 .563 .092 .000 .000 .000 .000 .000 .000
107 107 107 107 107 107 107 107 107 107 107 107 107
-.543** -.13
5
-.45
6**
.c -.043 -.364** -.88
0**
.755** .796** .887** -.87
8**
-.50
1**
1
32 | P a g e
Paraphrase This Document
Need a fresh take? Get an instant paraphrase of this document with our AI Paraphraser
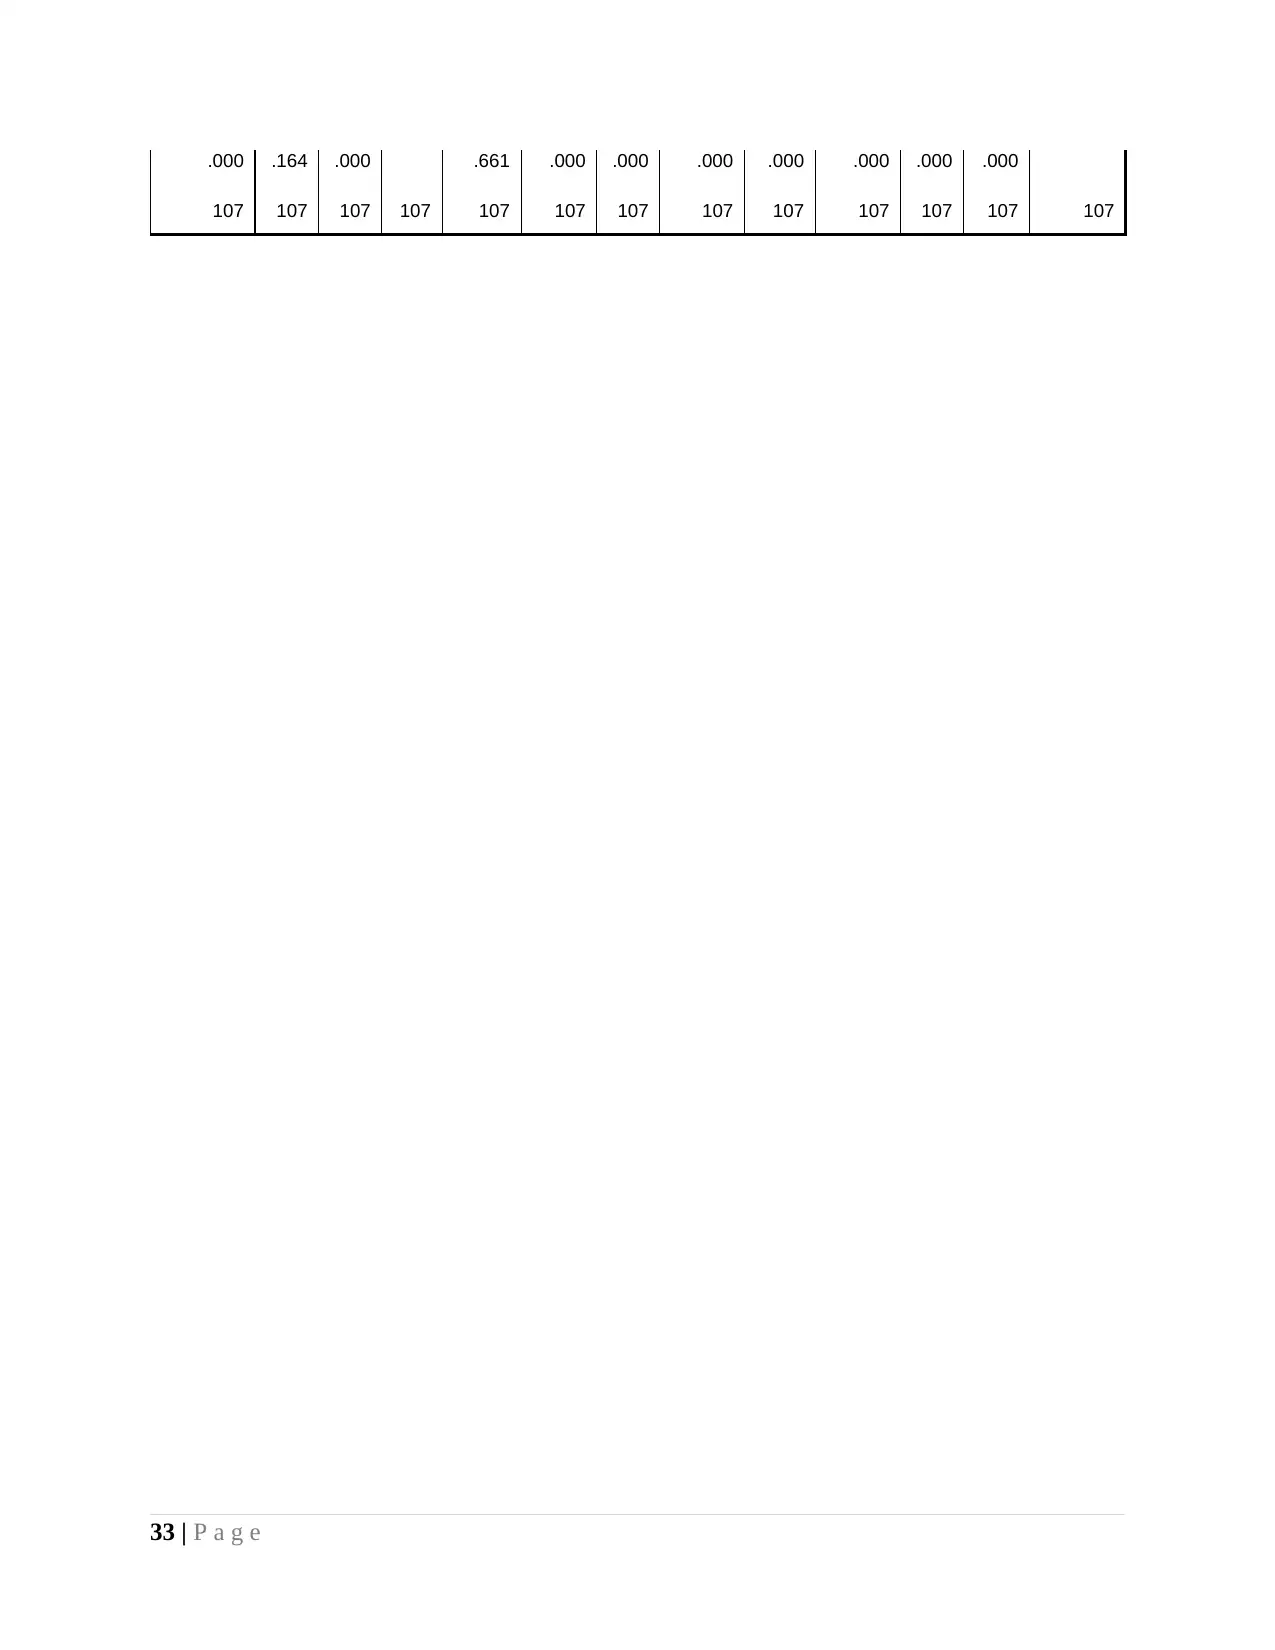
.000 .164 .000 .661 .000 .000 .000 .000 .000 .000 .000
107 107 107 107 107 107 107 107 107 107 107 107 107
33 | P a g e
107 107 107 107 107 107 107 107 107 107 107 107 107
33 | P a g e
1 out of 35
Related Documents


Your All-in-One AI-Powered Toolkit for Academic Success.
+13062052269
info@desklib.com
Available 24*7 on WhatsApp / Email
![[object Object]](/_next/static/media/star-bottom.7253800d.svg)
Unlock your academic potential
© 2024 | Zucol Services PVT LTD | All rights reserved.