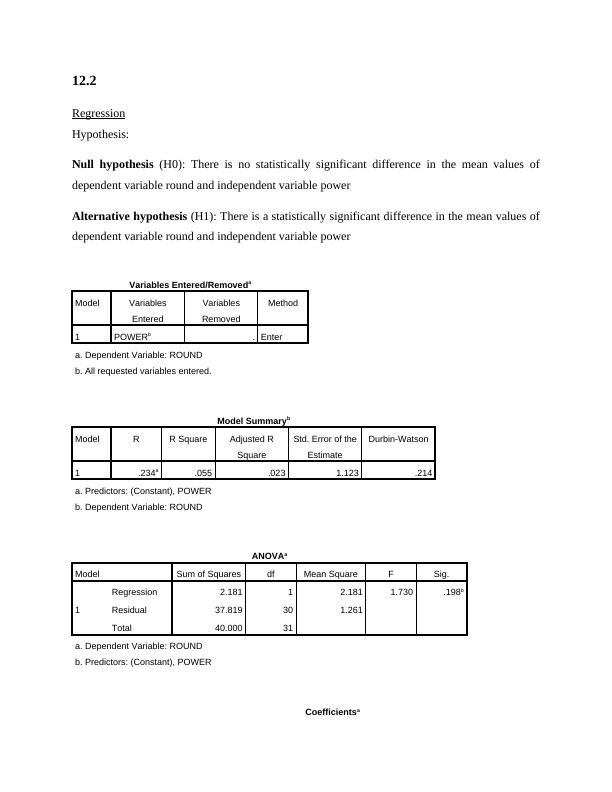
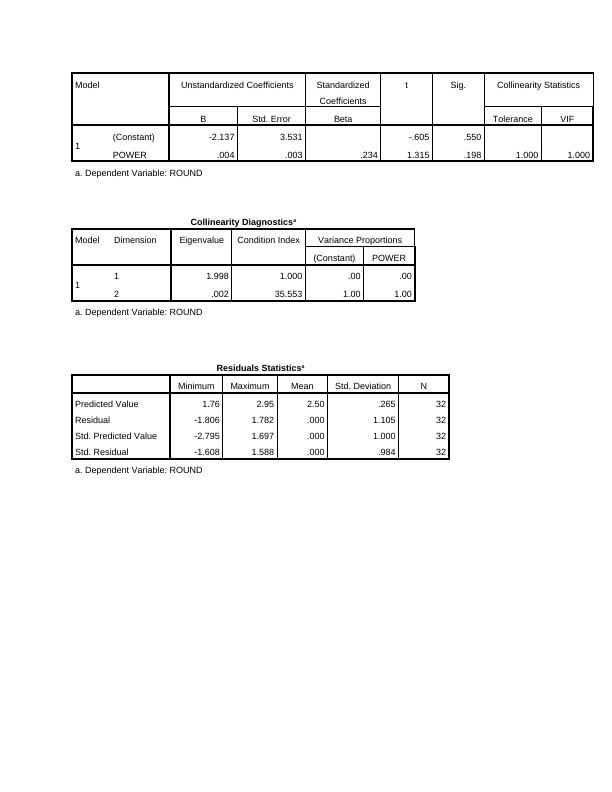
Regression Analysis in SPSS
Submission instructions for a homework assignment that requires a Microsoft Word document with an APA formatted title page, Table of Contents, page numbers, and an honesty statement. The document should also include problem numbers, sub-problem numbers, SPSS outputs, and discussions of findings.
16 Pages1866 Words25 Views
Added on 2023-02-03
About This Document
This document provides a detailed guide on performing regression analysis in SPSS. It covers the hypothesis, variables entered/removed, model summary, ANOVA, and coefficients. The document also includes step-by-step instructions and examples. Perfect for students studying statistics or data analysis.
Regression Analysis in SPSS
Submission instructions for a homework assignment that requires a Microsoft Word document with an APA formatted title page, Table of Contents, page numbers, and an honesty statement. The document should also include problem numbers, sub-problem numbers, SPSS outputs, and discussions of findings.
Added on 2023-02-03
ShareRelated Documents
End of preview
Want to access all the pages? Upload your documents or become a member.
Descriptive Stats & Correlations
|6
|493
|390
Mindfulness: Findings, Analysis, and Conclusion
|17
|3008
|58
SPSS Analysis Project – Part 3
|24
|5780
|67
Econometrics - Analysis of MARKET2022, OECDINCOME2022 and SHAREPRICE2022
|8
|1235
|136
Regression Analysis Assignment
|6
|831
|494
Testing the CAPM Theory Using Time Series Regression Analysis
|18
|3072
|254