STA101 – Statistics for Business Assignment
15 Pages2206 Words36 Views
Statistics for Business (STA101)
Added on 2020-03-16
STA101 – Statistics for Business Assignment
Statistics for Business (STA101)
Added on 2020-03-16
ShareRelated Documents
1
Individual Assignment
Unit: STA101 – Statistics for Business
Total Marks: This assignment is worth 30% of the total marks in the unit.
Due Date: 13th October 2017
Individual Assignment
Unit: STA101 – Statistics for Business
Total Marks: This assignment is worth 30% of the total marks in the unit.
Due Date: 13th October 2017
Table of Contents
Answer:1................................................................................................................ 3
Answer 2................................................................................................................. 4
ANSWER 3.............................................................................................................. 8
ANSWER 4.............................................................................................................. 9
ANSWER 5............................................................................................................ 10
References........................................................................................................... 13
Answer:1
Data is the small fragments of raw information collected for study and analysis for making it
useful in form an informed conclusion. Data is of three types namely, Categorical, discrete
numerical and continuous numerical. Categorical data is also understood as the qualitative
data which represents various characteristics like gender, marital status, city, etc. Such data
may have a numerical value but which don’t have any mathematical meaning.
On the other hand, numerical data, as the name itself suggest, is with quantitative
characteristic of measurement, like height, weight, etc. Further dividing into two as Discrete
data which can be counted and have possible values which is either fixed or in a range going
on to infinity; and Continuous data represent measurements that can be described using
intervals.
As per the views of Cressie (2015), mmeasurement scales are of three types namely, Nominal,
ordinal, interval and ratio scale. The nominal scale measures variable with a descriptive
category, but have no natural numerical value. The ordinal scale has both identity and
magnitude property. The interval scale has identity, magnitude and equal intervals as its
properties (Willer and Lernoud, 2016). The ratio scale has all four properties of measurement
namely, identity, magnitude, equal intervals and minimum value of zero.
What is your gender? (Male = 0, Female = 1)
Data Type: Categorical data with qualitative characteristic of a gender.
Measurement Level: Nominal scale of measurement as satisfies only identity property.
What is your approximate undergraduate college GPA? (1.0 to 4.0)
Data Type: Discrete data with finite possible values.
Measurement Level: Ordinal scale of measurement satisfying both identity and magnitude as
property.
About how many hours per week do you expect to work at an outside job this semester?
Data Type: Discrete date with infinite possible values.
Measurement Level: Ordinal scale of measurement satisfying both identity and magnitude as
property.
What do you think is the ideal number of children for a married couple?
Data Type: Discrete data with finite possible values.
Measurement Level: Interval scale of measurement with identity, magnitude and equal
intervals.
On a 1 to 5 scale, which best describes your parents? (1 = Mother clearly dominant ⟷ 5 =
Father clearly dominant)
Data Type: Discrete data
Measurement Level: Ordinal scale of measurement satisfying both identity and magnitude as
property.
Answer 2
No. of Students (N): 30
Monthly Rent paid: 730 730 730 930 700 570
690 1,030 740 620 720 670
560 740 650 660 850 930
600 620 760 690 710 500
730 800 820 840 720 700
(a)
Total of values = 18850
Mean = x = Σx / n
= 18850/30 = 628.33
Median = [(n/2)+(n/2+1)] / 2
= [(30/2)+(30/2+1)] / 2 = (15+16) / 2
= 15.5 i.e. average of the 15th and 16th value = 820+930/2 = 875
Mode = The values occurring more than once therefore it’s a multimodal data, thus grouping
will give the more appropriate mode which is 730 occurring 4 times.
(b) Agreement of the measure of Central Tendency:
Since the values of mean, median and mode are not very close to each other, the measures of
central tendency are more scattered. Since mean takes into account all the values; median
calculates the mid value and mode analyses value that occurs more frequently, any value over
730 would be more favorable and agreeable situation.
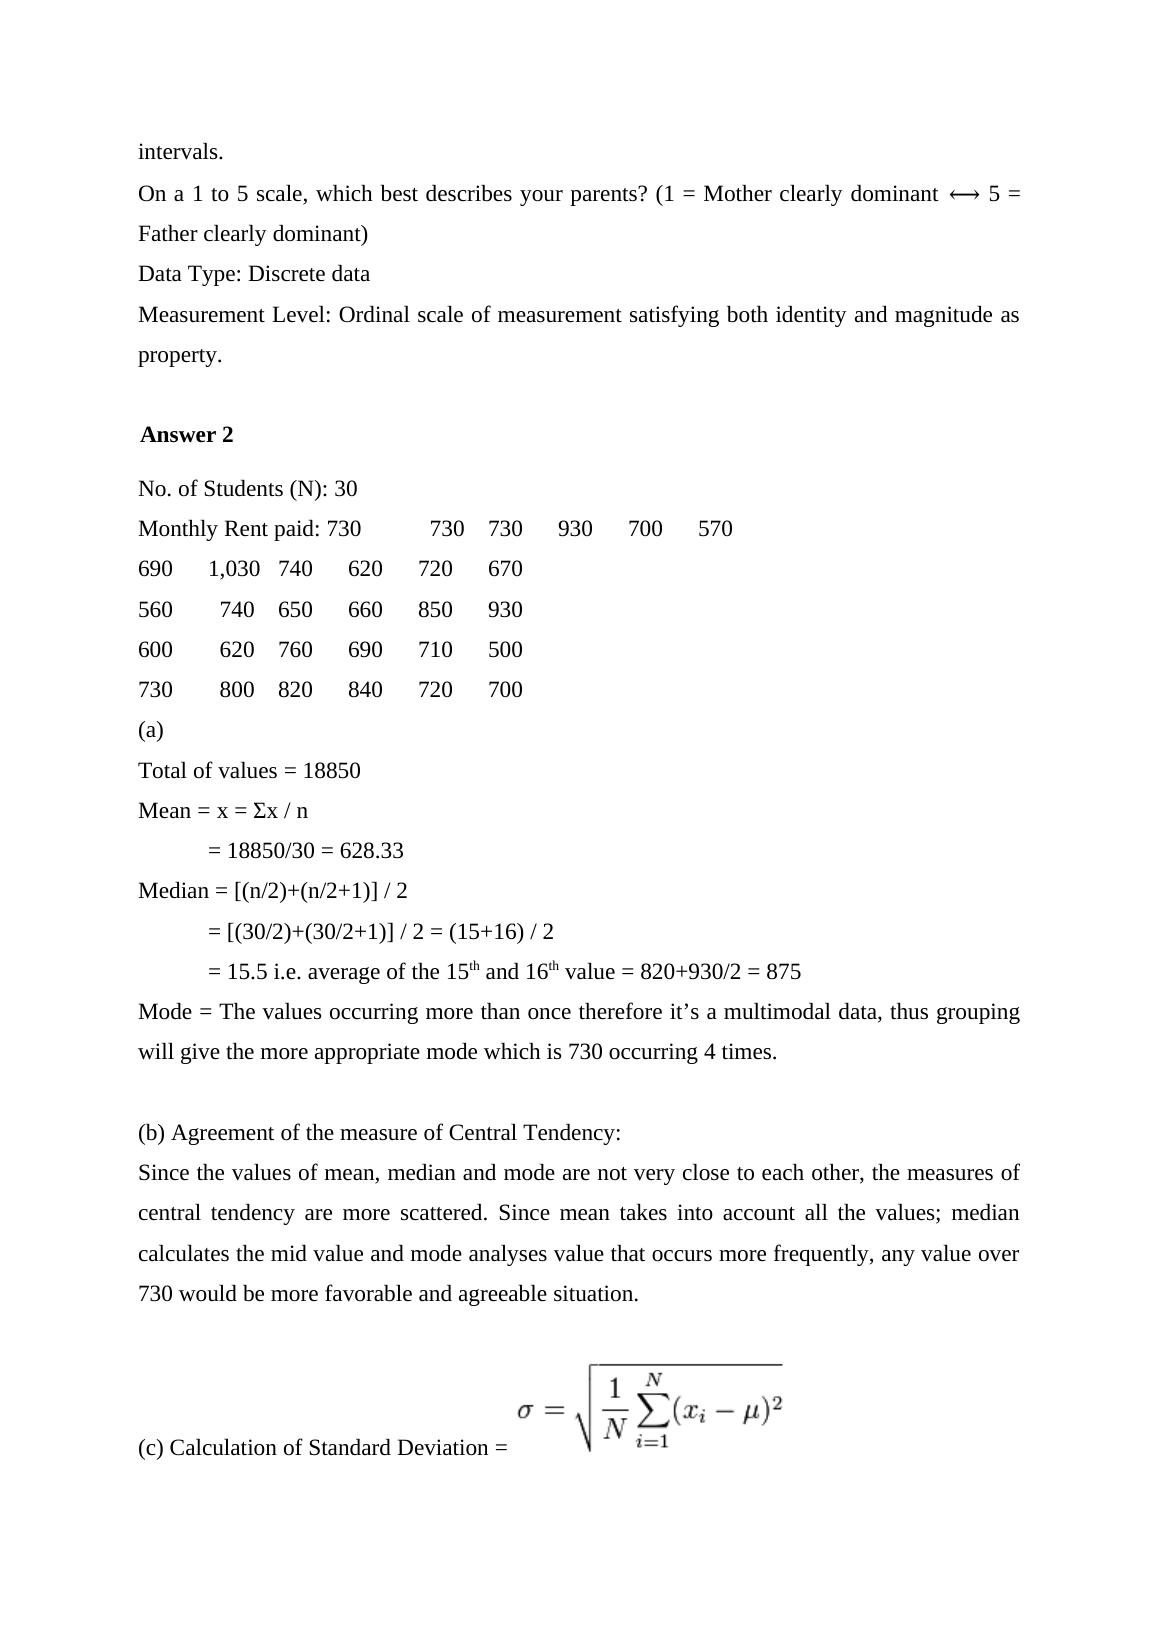
(c) Calculation of Standard Deviation =
On a 1 to 5 scale, which best describes your parents? (1 = Mother clearly dominant ⟷ 5 =
Father clearly dominant)
Data Type: Discrete data
Measurement Level: Ordinal scale of measurement satisfying both identity and magnitude as
property.
Answer 2
No. of Students (N): 30
Monthly Rent paid: 730 730 730 930 700 570
690 1,030 740 620 720 670
560 740 650 660 850 930
600 620 760 690 710 500
730 800 820 840 720 700
(a)
Total of values = 18850
Mean = x = Σx / n
= 18850/30 = 628.33
Median = [(n/2)+(n/2+1)] / 2
= [(30/2)+(30/2+1)] / 2 = (15+16) / 2
= 15.5 i.e. average of the 15th and 16th value = 820+930/2 = 875
Mode = The values occurring more than once therefore it’s a multimodal data, thus grouping
will give the more appropriate mode which is 730 occurring 4 times.
(b) Agreement of the measure of Central Tendency:
Since the values of mean, median and mode are not very close to each other, the measures of
central tendency are more scattered. Since mean takes into account all the values; median
calculates the mid value and mode analyses value that occurs more frequently, any value over
730 would be more favorable and agreeable situation.
(c) Calculation of Standard Deviation =
End of preview
Want to access all the pages? Upload your documents or become a member.
Related Documents
Statistics Assignment | Central Tendency Measureslg...
|8
|1194
|634
Mathematical Statisticslg...
|8
|2145
|78
Developing a Reliable and Valid Measurement Instrument for Psychological Researchlg...
|15
|3455
|120
Business Statistics Report 2022lg...
|18
|1751
|22
Quantitative Research Methods for Social Scientistslg...
|7
|1618
|103