Statistical Interpretation of Nursing Data
VerifiedAdded on 2022/08/18
|18
|3671
|9
AI Summary
Contribute Materials
Your contribution can guide someone’s learning journey. Share your
documents today.
Running head: STATISTICAL INTERPRETATION OF NURSING DATA
STATISTICAL INTERPRETATION OF NURSING DATA
Name of the student:
Name of the university:
Author Note:
STATISTICAL INTERPRETATION OF NURSING DATA
Name of the student:
Name of the university:
Author Note:
Secure Best Marks with AI Grader
Need help grading? Try our AI Grader for instant feedback on your assignments.
1STATISTICAL INTERPRETATION OF NURSING DATA
Table of Contents
Descriptive Analysis..................................................................................................................2
Answer A) (i).........................................................................................................................2
Answer A) (ii)........................................................................................................................3
Answer A) (iii).......................................................................................................................4
Answer A) (iv).......................................................................................................................6
Answer A) (v)........................................................................................................................8
Interpretation of Analyses........................................................................................................13
Answer B) (i)........................................................................................................................13
Answer B) (ii)......................................................................................................................13
Answer B) (iii).....................................................................................................................14
Answer B) (iv)......................................................................................................................14
Conclusion................................................................................................................................14
References................................................................................................................................16
2STATISTICAL INTERPRETATION OF NURSING DATA
Descriptive Analysis
Answer A) (i)
The research study is carried out on a group of nurses in a non-teaching hospital of
South Ontario. The nursing unit consisted of 80 nurses; however, not all of them showed their
keen interest to participate in this research. Hence, the demographic data was collected from a
group of 60 nurses who participated voluntarily in this research and the data collected from
them was kept confidential under every circumstances. The data primarily comprised of the
‘Age’, the ‘Age Group’ in which the Age was classified into and the ‘Gender’ of the nurses in
the sample. Furthermore, their individual information about ‘Professional Designation’,
‘Employment Category’ and ‘Years of Nursing Experience’ was also collected. Apart from
this, data was derived from the nurses about their ‘Perceived Relevance of Research Evidence
to Practise Score’ and their ‘Attitude towards Change Score’. All these data are classified into
certain ranges and then evaluation is done on the number of nurses belonging to each group.
For instance, the Age Group is classified into three categories that are, (21-35) years,
(36-54) years and more than 55 years. The ‘Employment Category’ is a parameter that is
included in the research analysis to check the number of nurses that provide services for part-
time or full time (Porter, 2018). Hence, the ‘Employment Category’ broadens to two
subcategories that are ‘Part-time’ and ‘Full-time’ and data is analysed based on these
categories on the number of nurses that works for part-time and the ones who work for full-
time in the hospital. The ‘Professional Designation’ also comprises of three subcategories
that are the ‘Registered Practical Nurse (RPN)’, “Registered Nurse Degree (RN Degree)’ and
‘Registered Nurse Diploma (RN Diploma)’. By this categorization, it is checked, out of the
60 nurses in the sample, which nurses have practical experienced, who are the ones that
possess Degree and the ones that have Diploma.
3STATISTICAL INTERPRETATION OF NURSING DATA
The ‘Gender’ category of the nurses are divided into ‘Male’ and ‘Female’ categories
that checks the count of the male nurses in the hospital along with the count of the female
nurses from the same. Similar to the parameter of ‘Age’, the ‘Years of Nursing Experience’ is
another criterion on which data is collected individually from the nurses. Clearly visible from
the name, this states the prolonged period for which the nurses from the sample are providing
service in the hospital. Hence, both the ‘Age’ and the ‘Years of Nursing Experience’ both
comprises of continuous data and thus, summary statistics is generated on these two
parameters for their respective descriptive analysis.
Furthermore, the researchers for this study were interested to analyse about
determining the attitudes of the nurses towards evidence-based practise and the
implementation of best practise guidelines. Hence, one parameter was introduced in the
analysis to check the ‘Perceived relevance of research evidence to practice score’ that was
checked in between the range from zero to 10 with equal increments (Ose, 2016). The ‘zero’
category represented that the data was not at all relevant whereas 10 represented high
relevancy of the data. Similarly, the attitude of the nurses towards change score was also
determined in a parameter of ‘Attitude towards Change Score’ that was also ranged from
‘zero’ to 10 with equal increments that represented zero as ‘negative change’ and 10 as
‘positive change’.
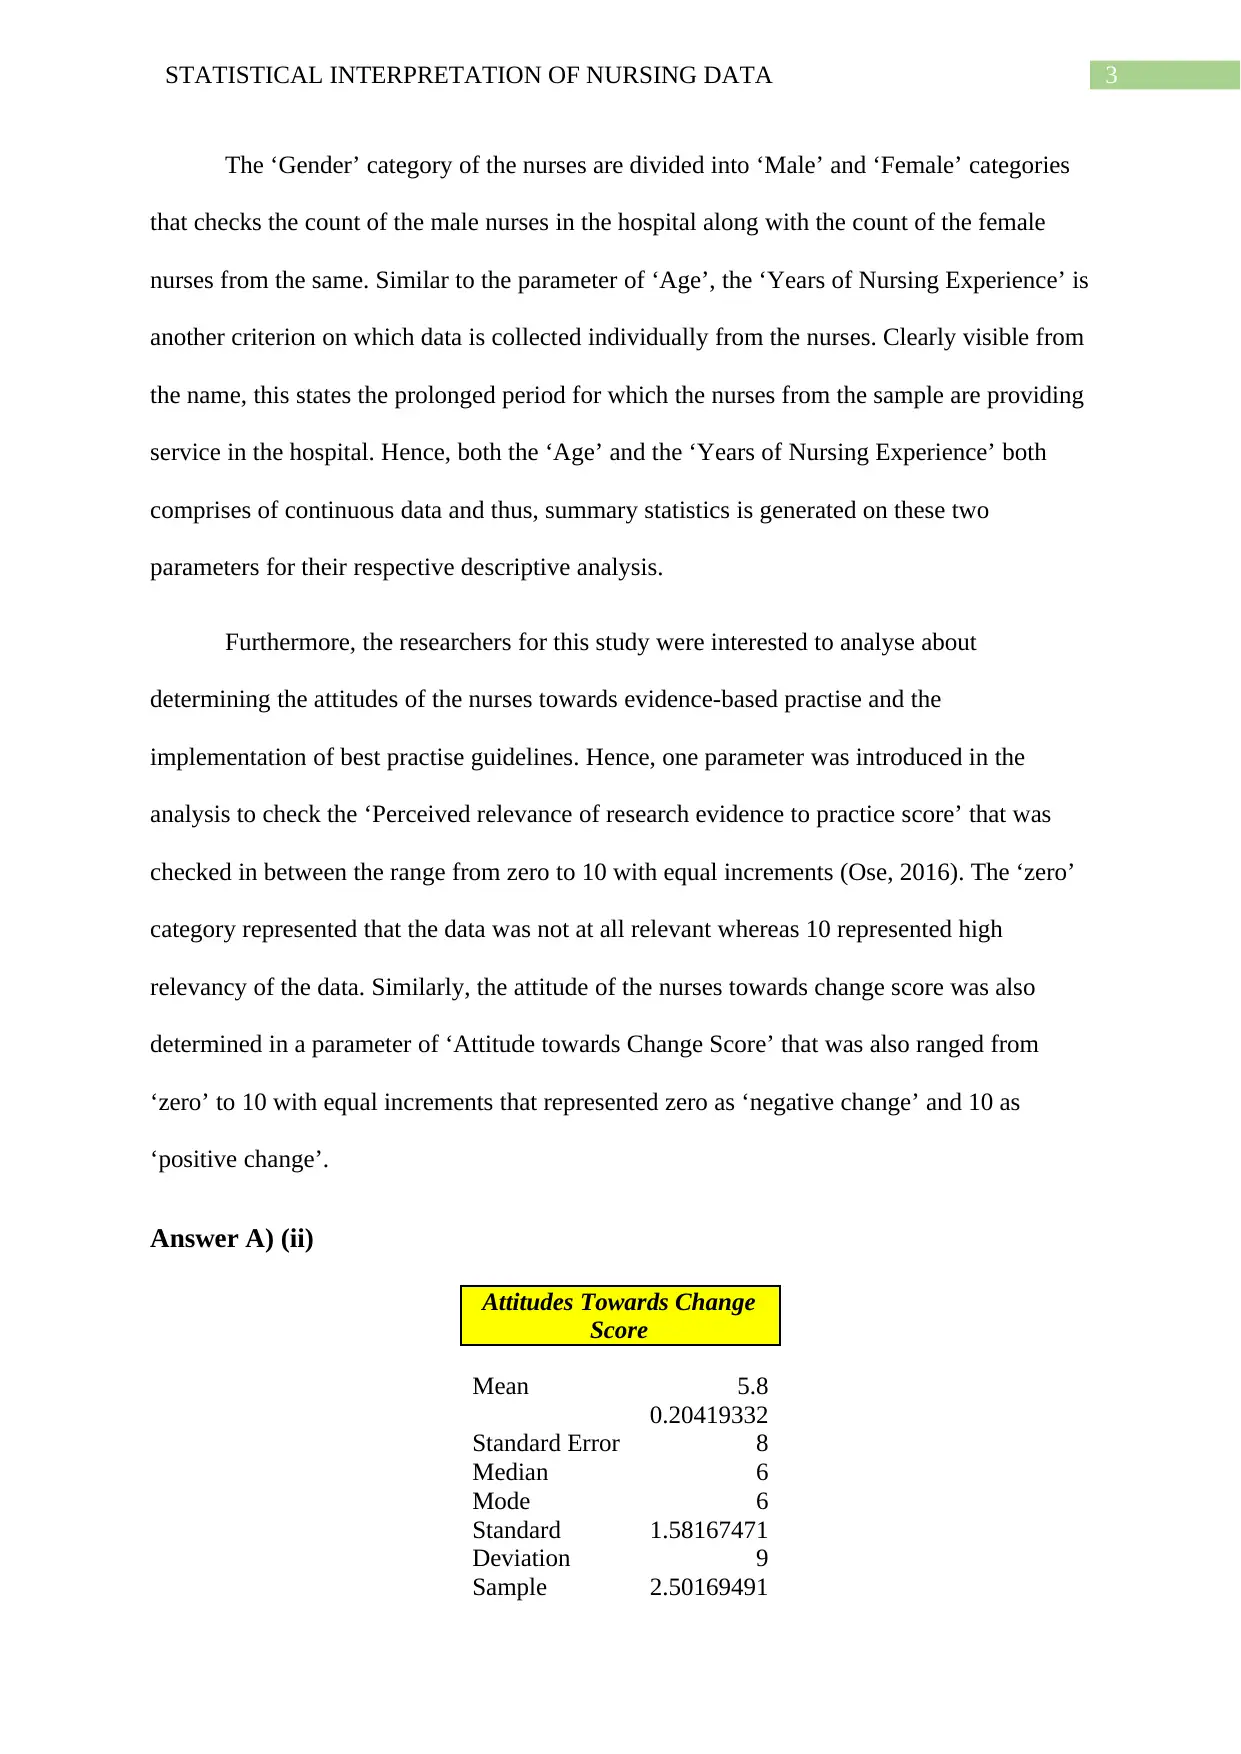
Answer A) (ii)
Attitudes Towards Change
Score
Mean 5.8
Standard Error
0.20419332
8
Median 6
Mode 6
Standard
Deviation
1.58167471
9
Sample 2.50169491
The ‘Gender’ category of the nurses are divided into ‘Male’ and ‘Female’ categories
that checks the count of the male nurses in the hospital along with the count of the female
nurses from the same. Similar to the parameter of ‘Age’, the ‘Years of Nursing Experience’ is
another criterion on which data is collected individually from the nurses. Clearly visible from
the name, this states the prolonged period for which the nurses from the sample are providing
service in the hospital. Hence, both the ‘Age’ and the ‘Years of Nursing Experience’ both
comprises of continuous data and thus, summary statistics is generated on these two
parameters for their respective descriptive analysis.
Furthermore, the researchers for this study were interested to analyse about
determining the attitudes of the nurses towards evidence-based practise and the
implementation of best practise guidelines. Hence, one parameter was introduced in the
analysis to check the ‘Perceived relevance of research evidence to practice score’ that was
checked in between the range from zero to 10 with equal increments (Ose, 2016). The ‘zero’
category represented that the data was not at all relevant whereas 10 represented high
relevancy of the data. Similarly, the attitude of the nurses towards change score was also
determined in a parameter of ‘Attitude towards Change Score’ that was also ranged from
‘zero’ to 10 with equal increments that represented zero as ‘negative change’ and 10 as
‘positive change’.
Answer A) (ii)
Attitudes Towards Change
Score
Mean 5.8
Standard Error
0.20419332
8
Median 6
Mode 6
Standard
Deviation
1.58167471
9
Sample 2.50169491
Secure Best Marks with AI Grader
Need help grading? Try our AI Grader for instant feedback on your assignments.
4STATISTICAL INTERPRETATION OF NURSING DATA
Variance 5
Kurtosis
-
0.05475166
Skewness
-
0.34988624
2
Range 7
Minimum 2
Maximum 9
Sum 348
Count 60
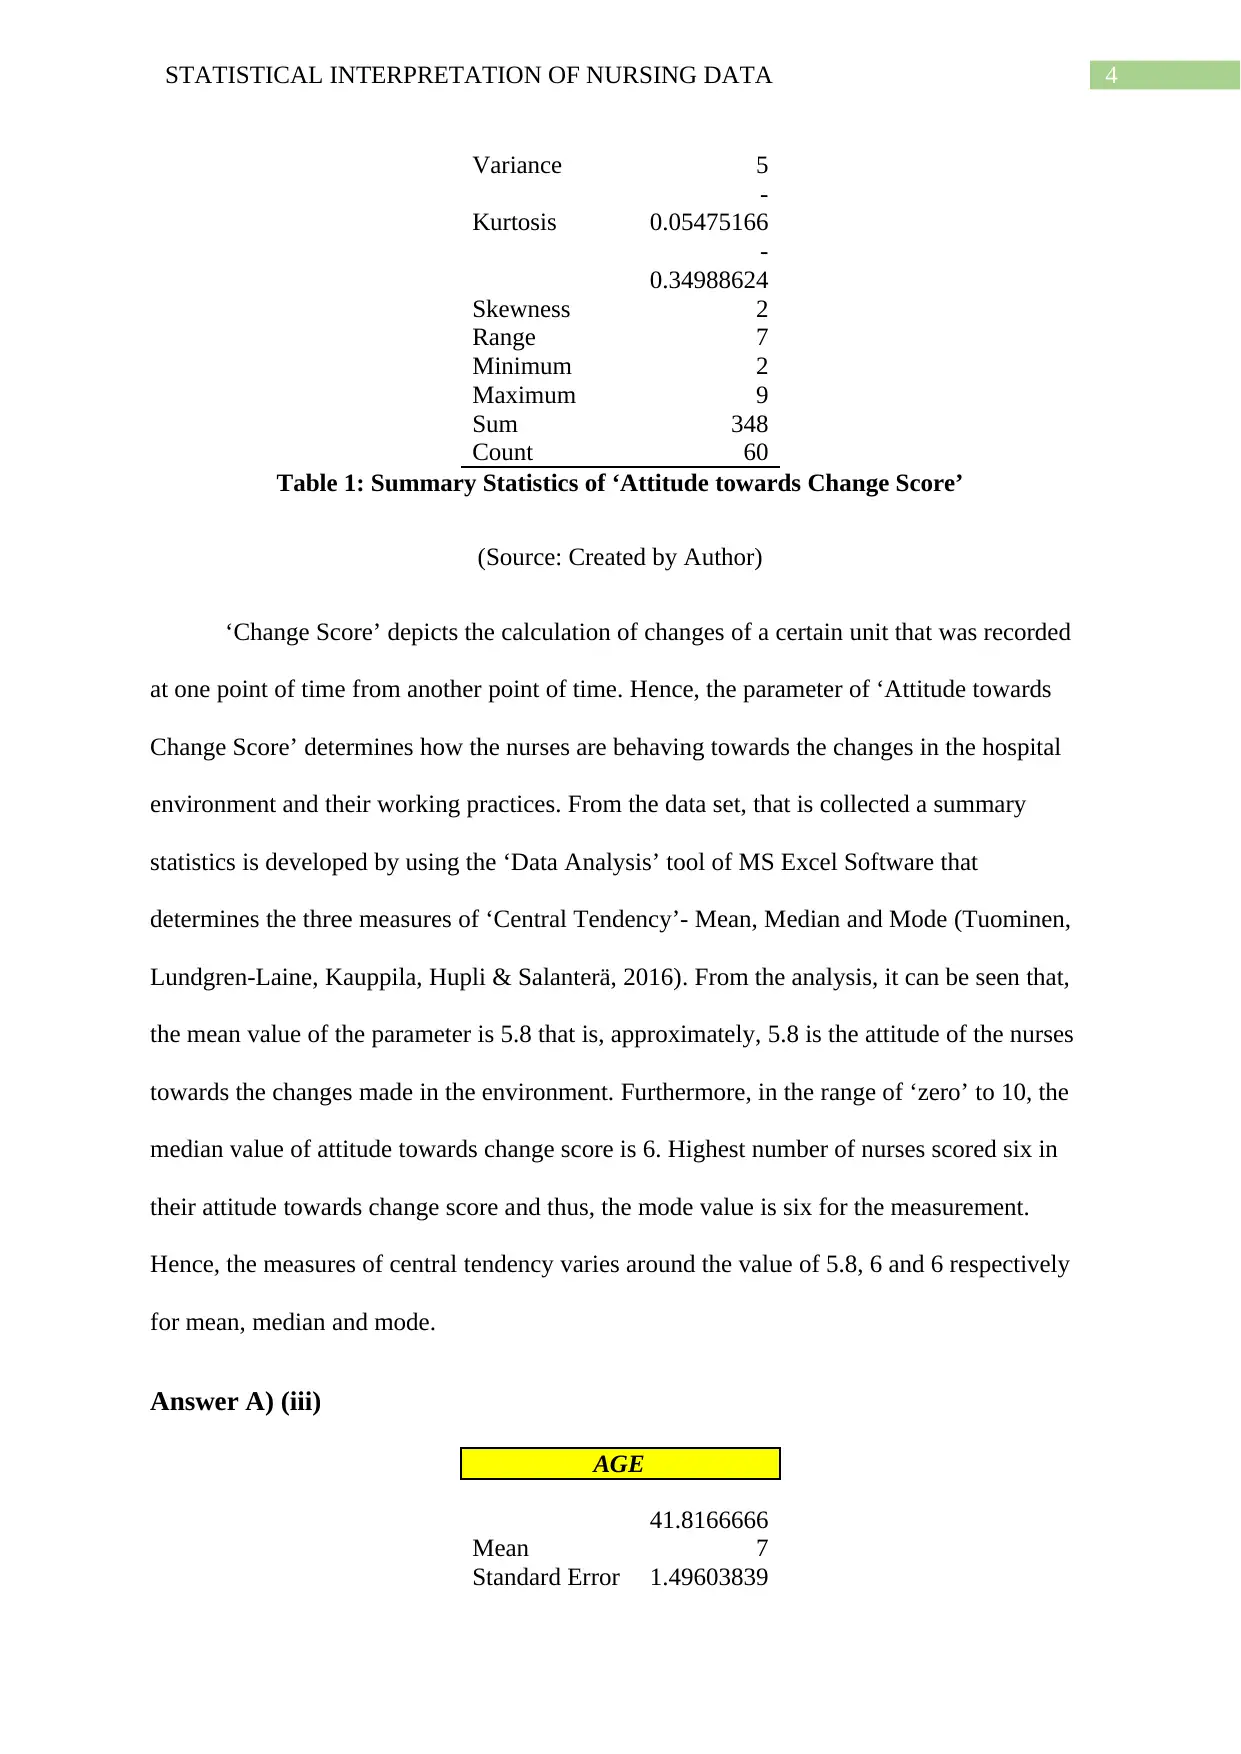
Table 1: Summary Statistics of ‘Attitude towards Change Score’
(Source: Created by Author)
‘Change Score’ depicts the calculation of changes of a certain unit that was recorded
at one point of time from another point of time. Hence, the parameter of ‘Attitude towards
Change Score’ determines how the nurses are behaving towards the changes in the hospital
environment and their working practices. From the data set, that is collected a summary
statistics is developed by using the ‘Data Analysis’ tool of MS Excel Software that
determines the three measures of ‘Central Tendency’- Mean, Median and Mode (Tuominen,
Lundgren-Laine, Kauppila, Hupli & Salanterä, 2016). From the analysis, it can be seen that,
the mean value of the parameter is 5.8 that is, approximately, 5.8 is the attitude of the nurses
towards the changes made in the environment. Furthermore, in the range of ‘zero’ to 10, the
median value of attitude towards change score is 6. Highest number of nurses scored six in
their attitude towards change score and thus, the mode value is six for the measurement.
Hence, the measures of central tendency varies around the value of 5.8, 6 and 6 respectively
for mean, median and mode.
Answer A) (iii)
AGE
Mean
41.8166666
7
Standard Error 1.49603839
Variance 5
Kurtosis
-
0.05475166
Skewness
-
0.34988624
2
Range 7
Minimum 2
Maximum 9
Sum 348
Count 60
Table 1: Summary Statistics of ‘Attitude towards Change Score’
(Source: Created by Author)
‘Change Score’ depicts the calculation of changes of a certain unit that was recorded
at one point of time from another point of time. Hence, the parameter of ‘Attitude towards
Change Score’ determines how the nurses are behaving towards the changes in the hospital
environment and their working practices. From the data set, that is collected a summary
statistics is developed by using the ‘Data Analysis’ tool of MS Excel Software that
determines the three measures of ‘Central Tendency’- Mean, Median and Mode (Tuominen,
Lundgren-Laine, Kauppila, Hupli & Salanterä, 2016). From the analysis, it can be seen that,
the mean value of the parameter is 5.8 that is, approximately, 5.8 is the attitude of the nurses
towards the changes made in the environment. Furthermore, in the range of ‘zero’ to 10, the
median value of attitude towards change score is 6. Highest number of nurses scored six in
their attitude towards change score and thus, the mode value is six for the measurement.
Hence, the measures of central tendency varies around the value of 5.8, 6 and 6 respectively
for mean, median and mode.
Answer A) (iii)
AGE
Mean
41.8166666
7
Standard Error 1.49603839
5STATISTICAL INTERPRETATION OF NURSING DATA
7
Median 42.5
Mode 45
Standard
Deviation
11.5882635
9
Sample
Variance
134.287853
1
Kurtosis
-
0.69584509
5
Skewness
0.17282775
8
Range 45
Minimum 21
Maximum 66
Sum 2509
Count 60
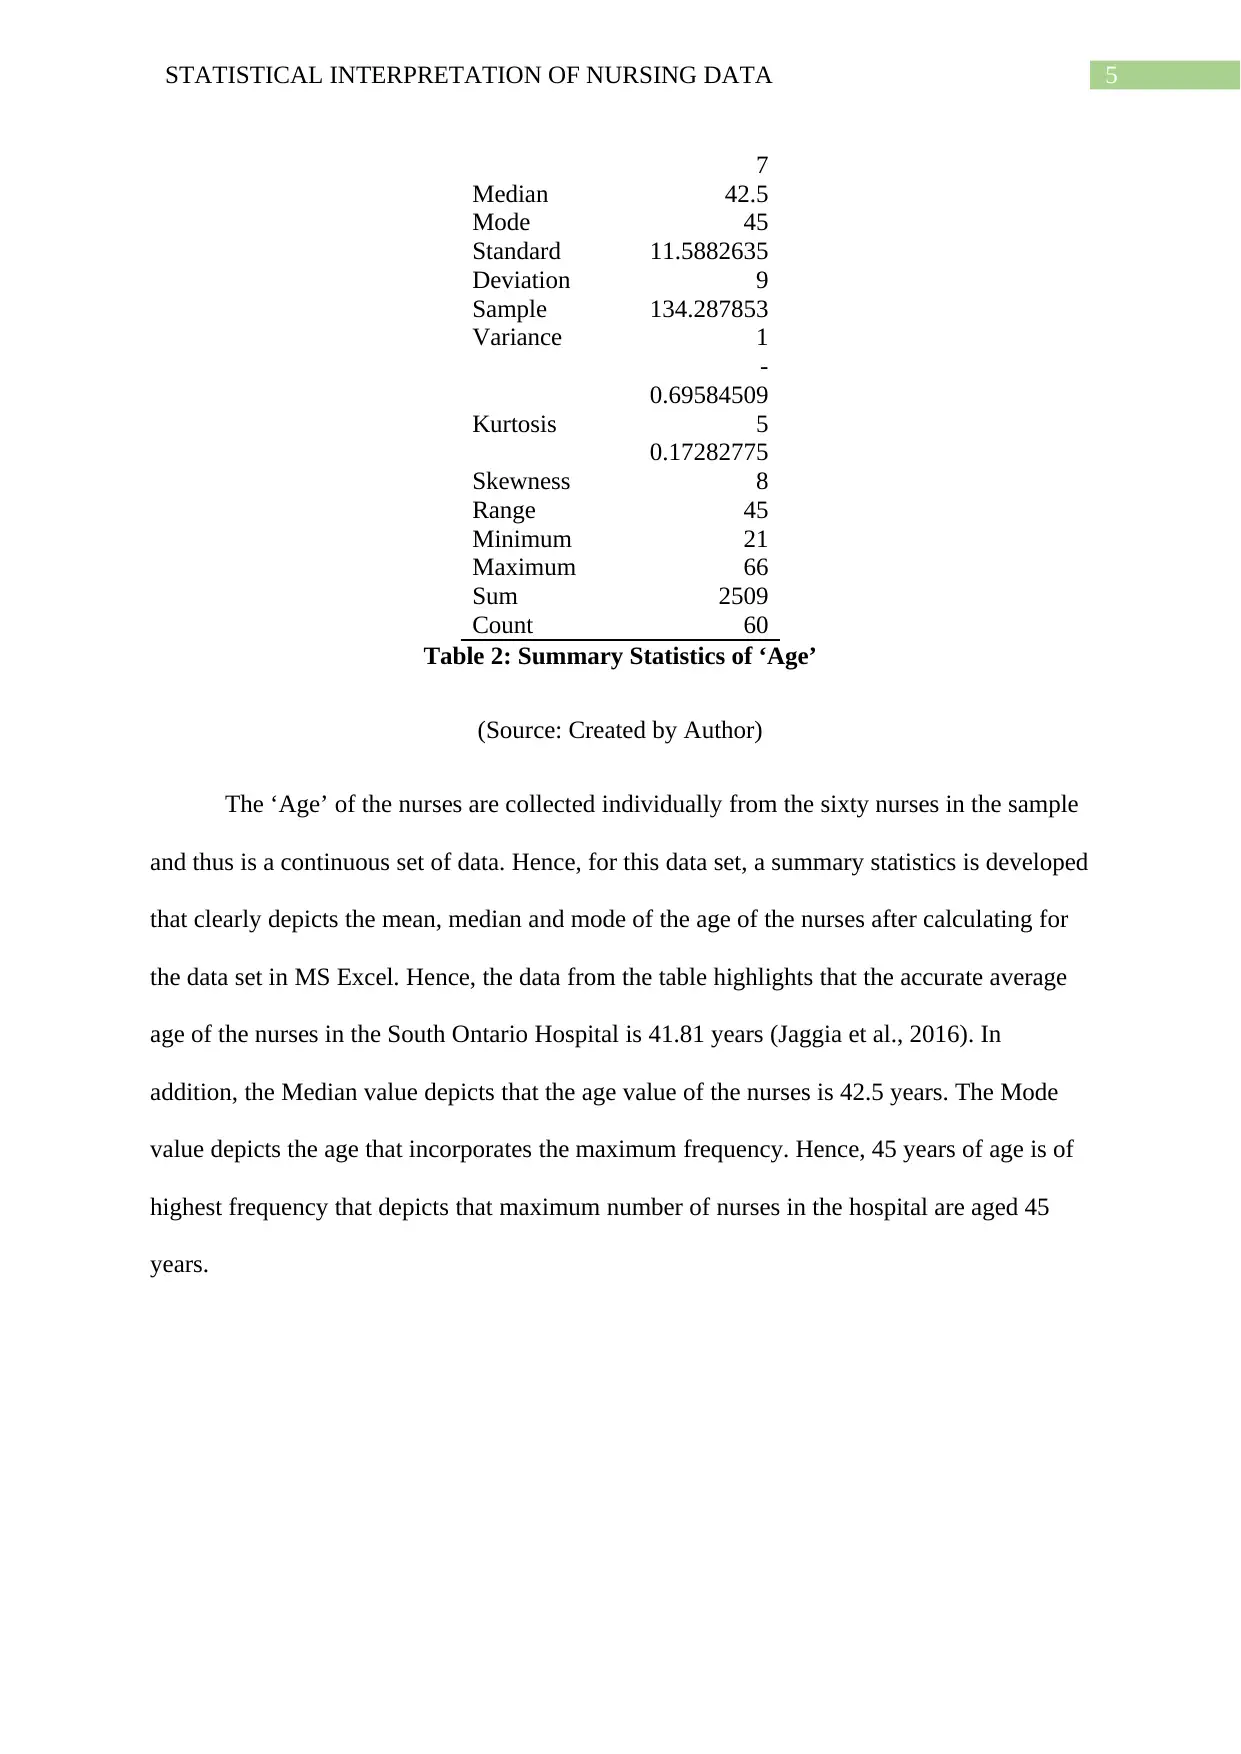
Table 2: Summary Statistics of ‘Age’
(Source: Created by Author)
The ‘Age’ of the nurses are collected individually from the sixty nurses in the sample
and thus is a continuous set of data. Hence, for this data set, a summary statistics is developed
that clearly depicts the mean, median and mode of the age of the nurses after calculating for
the data set in MS Excel. Hence, the data from the table highlights that the accurate average
age of the nurses in the South Ontario Hospital is 41.81 years (Jaggia et al., 2016). In
addition, the Median value depicts that the age value of the nurses is 42.5 years. The Mode
value depicts the age that incorporates the maximum frequency. Hence, 45 years of age is of
highest frequency that depicts that maximum number of nurses in the hospital are aged 45
years.
7
Median 42.5
Mode 45
Standard
Deviation
11.5882635
9
Sample
Variance
134.287853
1
Kurtosis
-
0.69584509
5
Skewness
0.17282775
8
Range 45
Minimum 21
Maximum 66
Sum 2509
Count 60
Table 2: Summary Statistics of ‘Age’
(Source: Created by Author)
The ‘Age’ of the nurses are collected individually from the sixty nurses in the sample
and thus is a continuous set of data. Hence, for this data set, a summary statistics is developed
that clearly depicts the mean, median and mode of the age of the nurses after calculating for
the data set in MS Excel. Hence, the data from the table highlights that the accurate average
age of the nurses in the South Ontario Hospital is 41.81 years (Jaggia et al., 2016). In
addition, the Median value depicts that the age value of the nurses is 42.5 years. The Mode
value depicts the age that incorporates the maximum frequency. Hence, 45 years of age is of
highest frequency that depicts that maximum number of nurses in the hospital are aged 45
years.
6STATISTICAL INTERPRETATION OF NURSING DATA
21-35 36-54 55+
0
5
10
15
20
25
30
35
Age Group
Ranges of Age Groups
Number of Employees
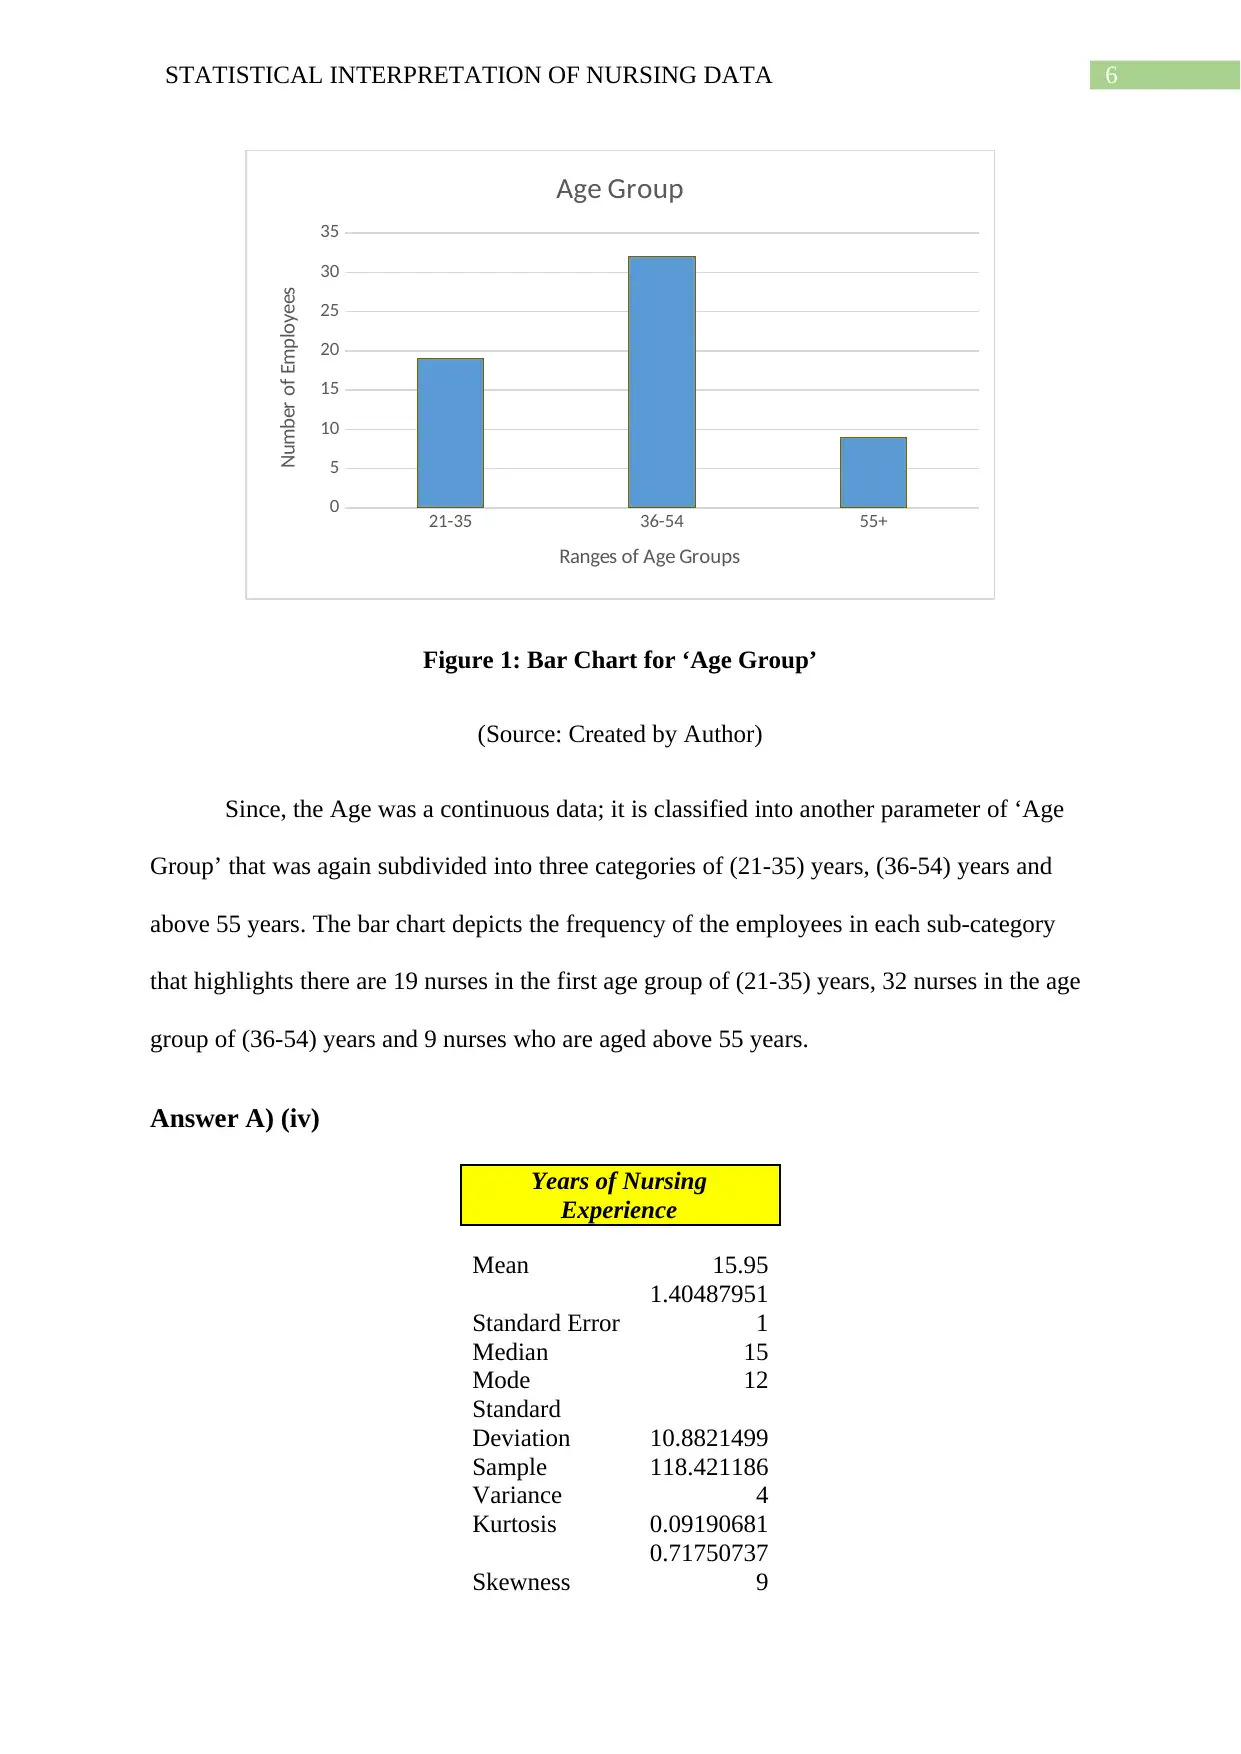
Figure 1: Bar Chart for ‘Age Group’
(Source: Created by Author)
Since, the Age was a continuous data; it is classified into another parameter of ‘Age
Group’ that was again subdivided into three categories of (21-35) years, (36-54) years and
above 55 years. The bar chart depicts the frequency of the employees in each sub-category
that highlights there are 19 nurses in the first age group of (21-35) years, 32 nurses in the age
group of (36-54) years and 9 nurses who are aged above 55 years.
Answer A) (iv)
Years of Nursing
Experience
Mean 15.95
Standard Error
1.40487951
1
Median 15
Mode 12
Standard
Deviation 10.8821499
Sample
Variance
118.421186
4
Kurtosis 0.09190681
Skewness
0.71750737
9
21-35 36-54 55+
0
5
10
15
20
25
30
35
Age Group
Ranges of Age Groups
Number of Employees
Figure 1: Bar Chart for ‘Age Group’
(Source: Created by Author)
Since, the Age was a continuous data; it is classified into another parameter of ‘Age
Group’ that was again subdivided into three categories of (21-35) years, (36-54) years and
above 55 years. The bar chart depicts the frequency of the employees in each sub-category
that highlights there are 19 nurses in the first age group of (21-35) years, 32 nurses in the age
group of (36-54) years and 9 nurses who are aged above 55 years.
Answer A) (iv)
Years of Nursing
Experience
Mean 15.95
Standard Error
1.40487951
1
Median 15
Mode 12
Standard
Deviation 10.8821499
Sample
Variance
118.421186
4
Kurtosis 0.09190681
Skewness
0.71750737
9
Paraphrase This Document
Need a fresh take? Get an instant paraphrase of this document with our AI Paraphraser
7STATISTICAL INTERPRETATION OF NURSING DATA
Range 44
Minimum 0
Maximum 44
Sum 957
Count 60
Q1 7.25
Q3 21.75
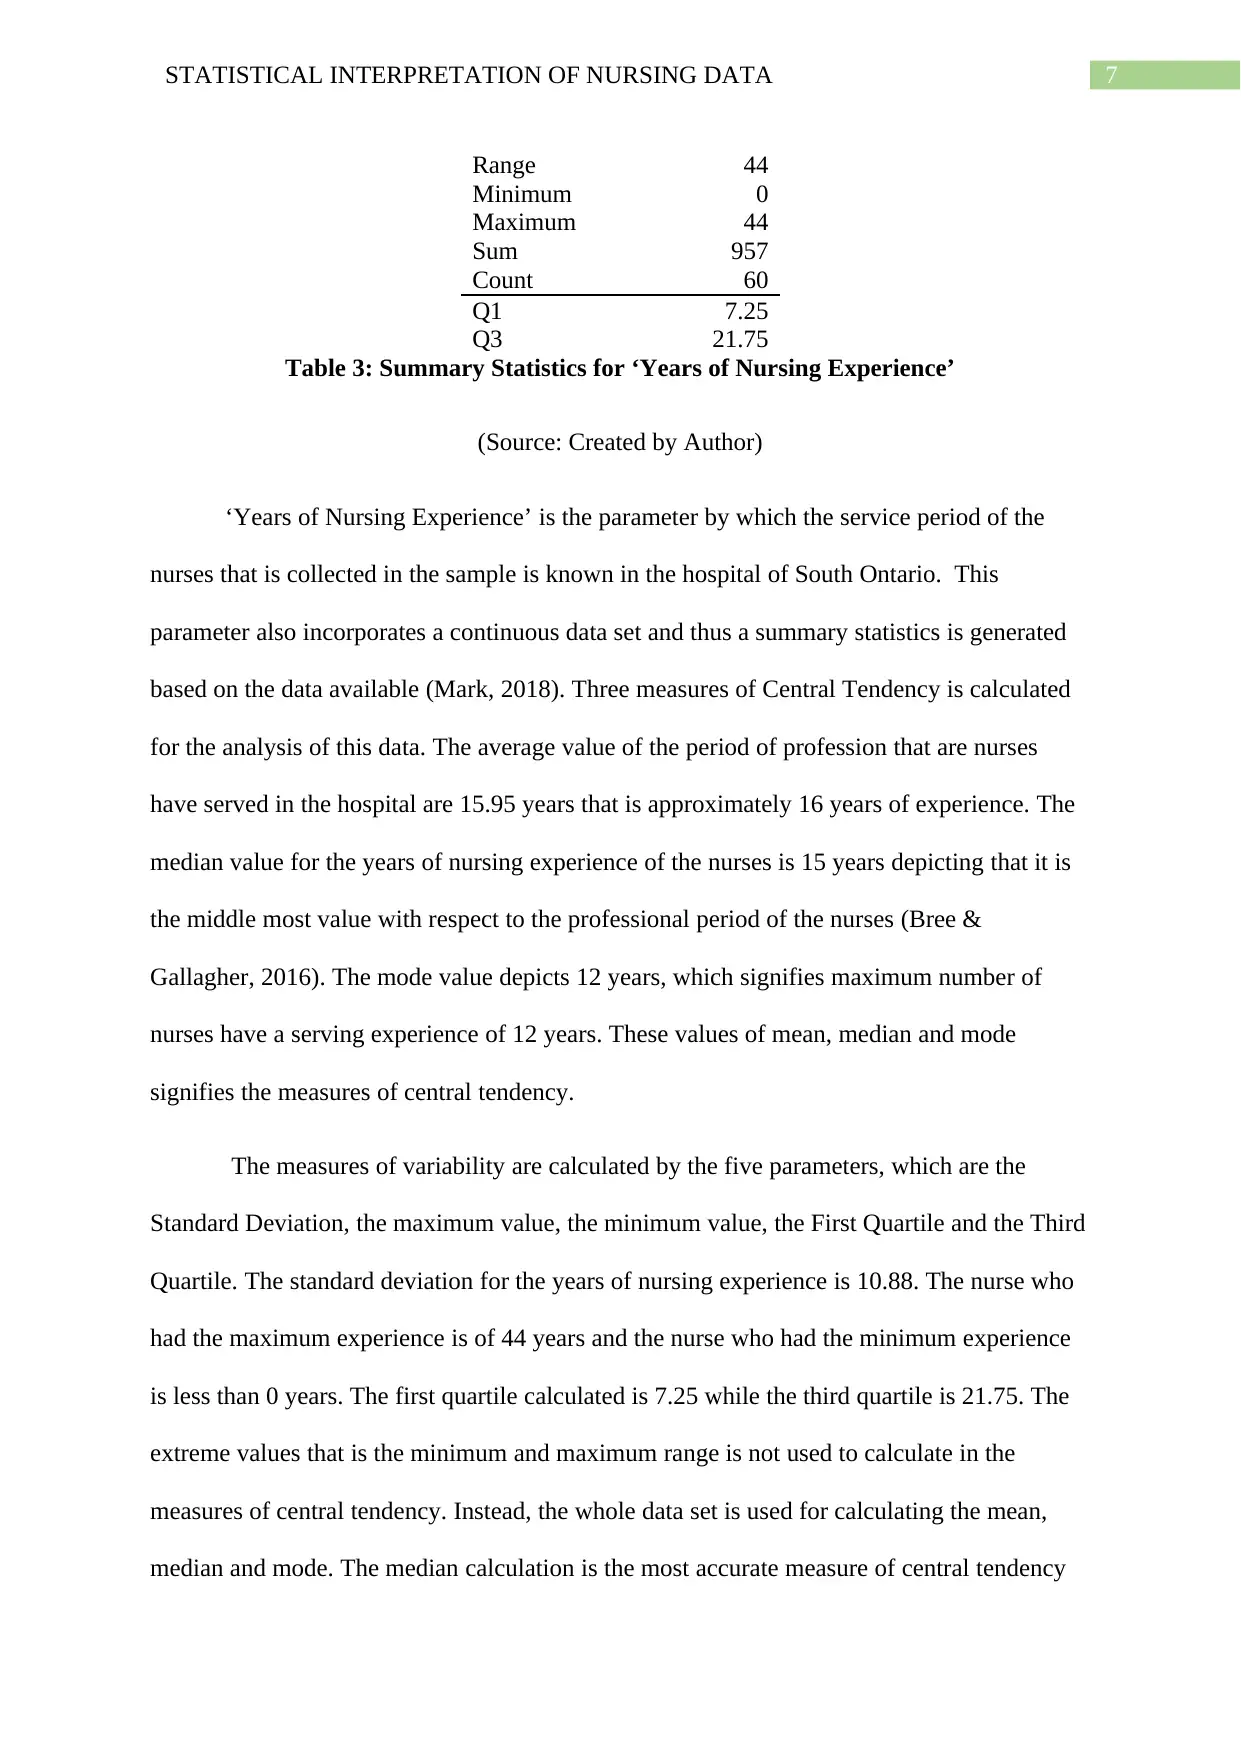
Table 3: Summary Statistics for ‘Years of Nursing Experience’
(Source: Created by Author)
‘Years of Nursing Experience’ is the parameter by which the service period of the
nurses that is collected in the sample is known in the hospital of South Ontario. This
parameter also incorporates a continuous data set and thus a summary statistics is generated
based on the data available (Mark, 2018). Three measures of Central Tendency is calculated
for the analysis of this data. The average value of the period of profession that are nurses
have served in the hospital are 15.95 years that is approximately 16 years of experience. The
median value for the years of nursing experience of the nurses is 15 years depicting that it is
the middle most value with respect to the professional period of the nurses (Bree &
Gallagher, 2016). The mode value depicts 12 years, which signifies maximum number of
nurses have a serving experience of 12 years. These values of mean, median and mode
signifies the measures of central tendency.
The measures of variability are calculated by the five parameters, which are the
Standard Deviation, the maximum value, the minimum value, the First Quartile and the Third
Quartile. The standard deviation for the years of nursing experience is 10.88. The nurse who
had the maximum experience is of 44 years and the nurse who had the minimum experience
is less than 0 years. The first quartile calculated is 7.25 while the third quartile is 21.75. The
extreme values that is the minimum and maximum range is not used to calculate in the
measures of central tendency. Instead, the whole data set is used for calculating the mean,
median and mode. The median calculation is the most accurate measure of central tendency
Range 44
Minimum 0
Maximum 44
Sum 957
Count 60
Q1 7.25
Q3 21.75
Table 3: Summary Statistics for ‘Years of Nursing Experience’
(Source: Created by Author)
‘Years of Nursing Experience’ is the parameter by which the service period of the
nurses that is collected in the sample is known in the hospital of South Ontario. This
parameter also incorporates a continuous data set and thus a summary statistics is generated
based on the data available (Mark, 2018). Three measures of Central Tendency is calculated
for the analysis of this data. The average value of the period of profession that are nurses
have served in the hospital are 15.95 years that is approximately 16 years of experience. The
median value for the years of nursing experience of the nurses is 15 years depicting that it is
the middle most value with respect to the professional period of the nurses (Bree &
Gallagher, 2016). The mode value depicts 12 years, which signifies maximum number of
nurses have a serving experience of 12 years. These values of mean, median and mode
signifies the measures of central tendency.
The measures of variability are calculated by the five parameters, which are the
Standard Deviation, the maximum value, the minimum value, the First Quartile and the Third
Quartile. The standard deviation for the years of nursing experience is 10.88. The nurse who
had the maximum experience is of 44 years and the nurse who had the minimum experience
is less than 0 years. The first quartile calculated is 7.25 while the third quartile is 21.75. The
extreme values that is the minimum and maximum range is not used to calculate in the
measures of central tendency. Instead, the whole data set is used for calculating the mean,
median and mode. The median calculation is the most accurate measure of central tendency
8STATISTICAL INTERPRETATION OF NURSING DATA
in this case because that will give the middle most value of the years of experience of the
nurses.
Answer A) (v)
Perceived Relevance of Clinical Expertise to Best Practice
Mean 8.3
Standard Error 0.149008019
Median 8
Mode 8
Standard Deviation 1.154211155
Sample Variance 1.33220339
Kurtosis 0.096547649
Skewness -0.483026986
Range 5
Minimum 5
Maximum 10
Sum 498
Count 60
Q1 8
Q3 9
Table 4: Summary Statistics for ‘Perceived Relevance of Research Evidence to Practice
Score’
(Source: Created by Author)
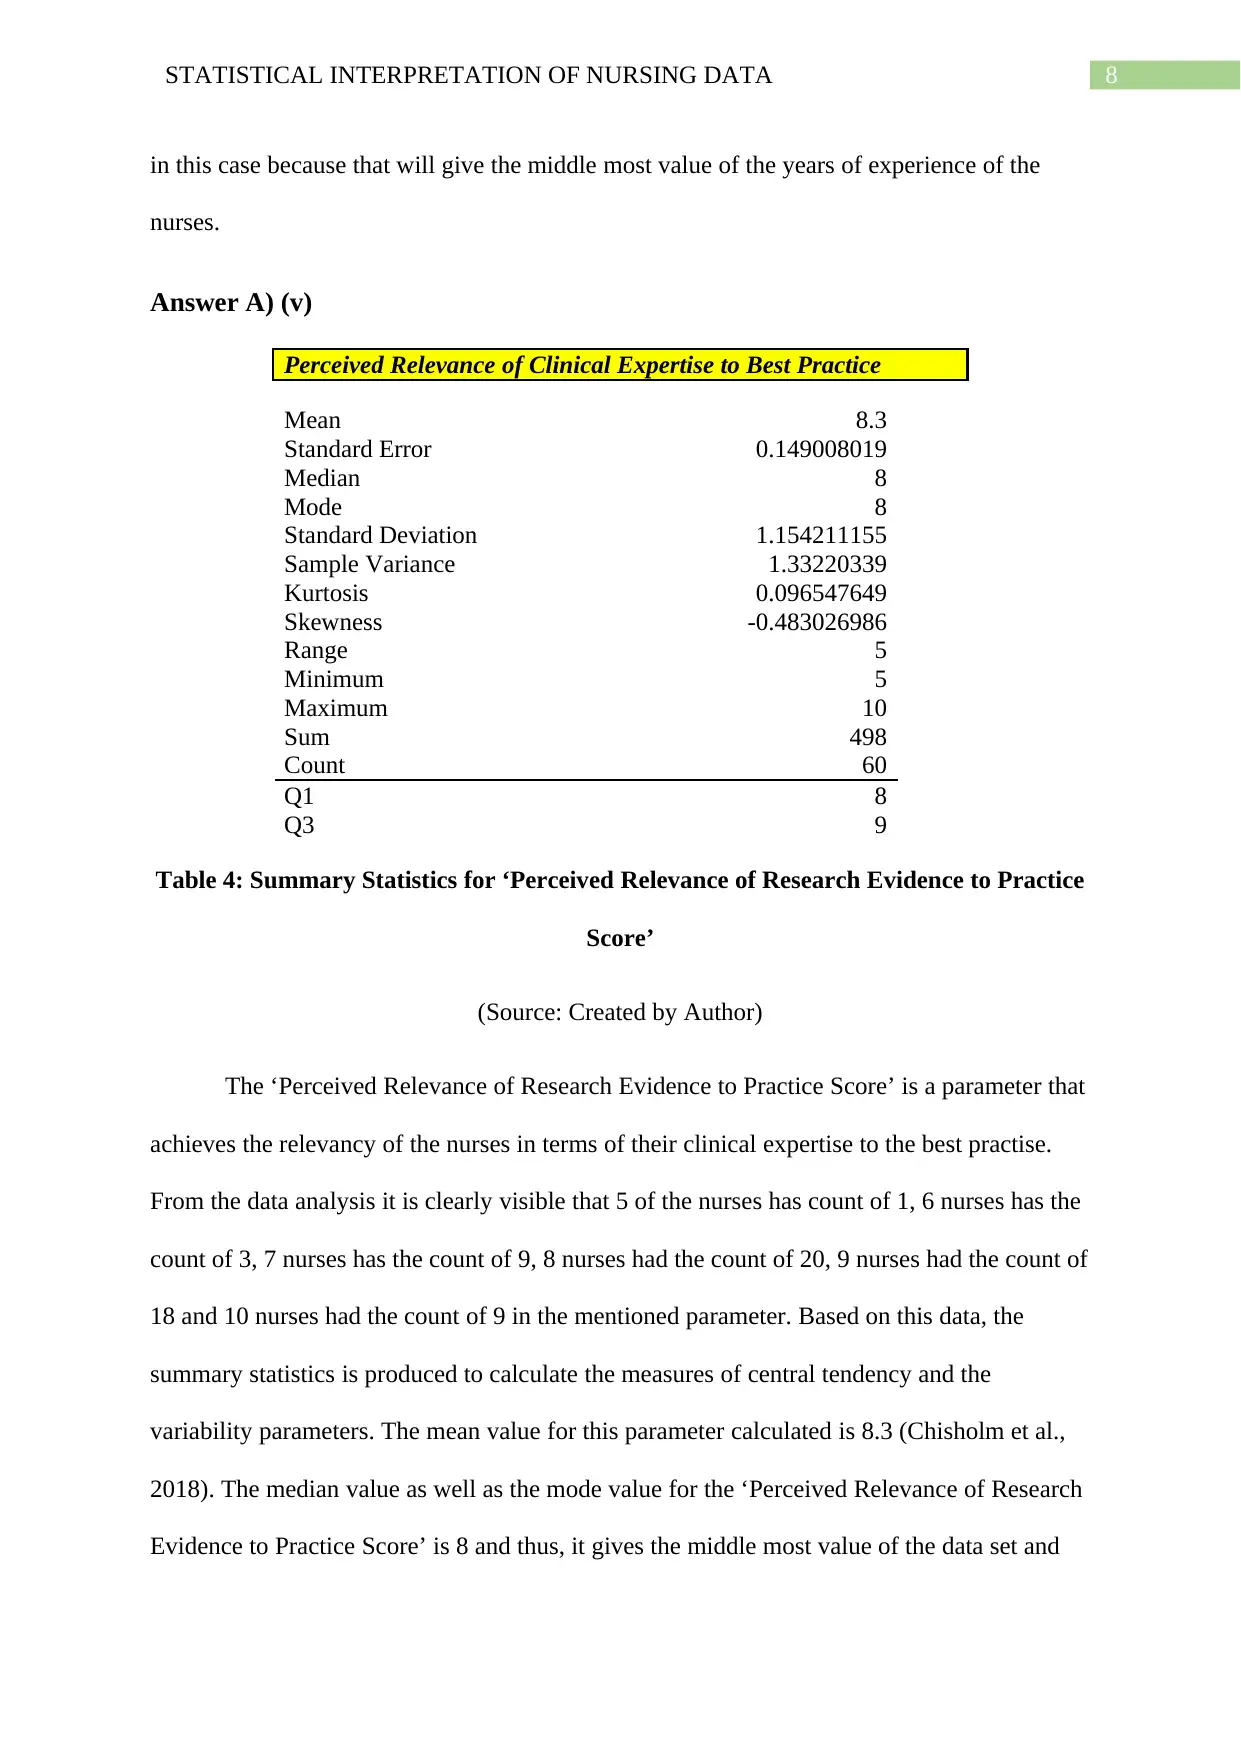
The ‘Perceived Relevance of Research Evidence to Practice Score’ is a parameter that
achieves the relevancy of the nurses in terms of their clinical expertise to the best practise.
From the data analysis it is clearly visible that 5 of the nurses has count of 1, 6 nurses has the
count of 3, 7 nurses has the count of 9, 8 nurses had the count of 20, 9 nurses had the count of
18 and 10 nurses had the count of 9 in the mentioned parameter. Based on this data, the
summary statistics is produced to calculate the measures of central tendency and the
variability parameters. The mean value for this parameter calculated is 8.3 (Chisholm et al.,
2018). The median value as well as the mode value for the ‘Perceived Relevance of Research
Evidence to Practice Score’ is 8 and thus, it gives the middle most value of the data set and
in this case because that will give the middle most value of the years of experience of the
nurses.
Answer A) (v)
Perceived Relevance of Clinical Expertise to Best Practice
Mean 8.3
Standard Error 0.149008019
Median 8
Mode 8
Standard Deviation 1.154211155
Sample Variance 1.33220339
Kurtosis 0.096547649
Skewness -0.483026986
Range 5
Minimum 5
Maximum 10
Sum 498
Count 60
Q1 8
Q3 9
Table 4: Summary Statistics for ‘Perceived Relevance of Research Evidence to Practice
Score’
(Source: Created by Author)
The ‘Perceived Relevance of Research Evidence to Practice Score’ is a parameter that
achieves the relevancy of the nurses in terms of their clinical expertise to the best practise.
From the data analysis it is clearly visible that 5 of the nurses has count of 1, 6 nurses has the
count of 3, 7 nurses has the count of 9, 8 nurses had the count of 20, 9 nurses had the count of
18 and 10 nurses had the count of 9 in the mentioned parameter. Based on this data, the
summary statistics is produced to calculate the measures of central tendency and the
variability parameters. The mean value for this parameter calculated is 8.3 (Chisholm et al.,
2018). The median value as well as the mode value for the ‘Perceived Relevance of Research
Evidence to Practice Score’ is 8 and thus, it gives the middle most value of the data set and
9STATISTICAL INTERPRETATION OF NURSING DATA
the value of highest frequency in the data respectively. These are the values of central
tendency measures for the given parameter.
The variability is measured by standard deviation that gives the value of 1.1542,
clearly visible from the summary statistics table. The maximum range calculated and the
minimum range of the data set of ‘Perceived Relevance of Research Evidence to Practice
Score’ is five in both the cases. The value of the first quartile calculated is eight and the third
quartile is nine (Grove & Cipher, 2016). However, the maximum and the minimum values
are not required to calculate the measures of central tendency and variability measures
because, while calculating these the mean or the middle most value is calculated. Hence, the
complete data set is required for the calculation and not just the extreme values. The mode is
the most accurate measure of central tendency because it gives the values that incorporates
the highest frequency value based on the ‘Perceived Relevance of Research Evidence to
Practice Score’.
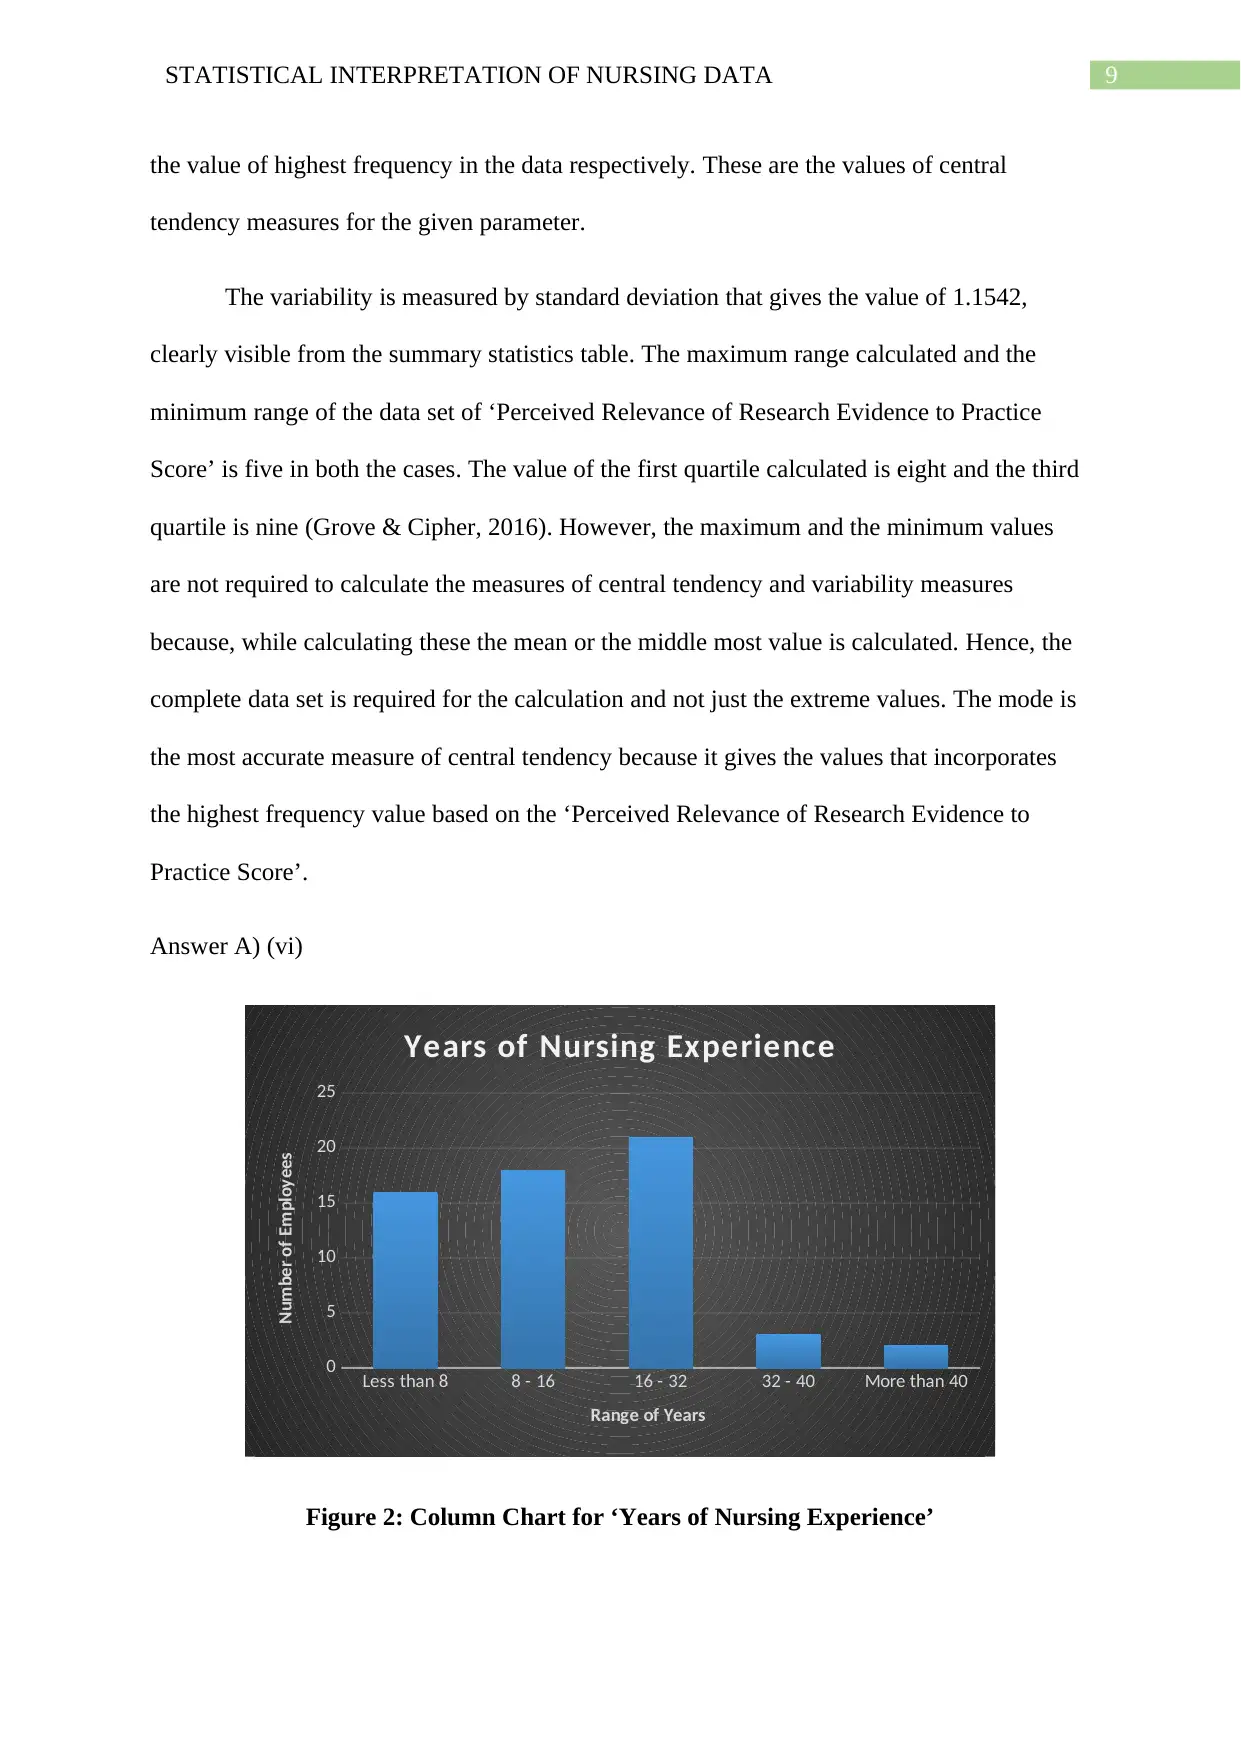
Answer A) (vi)
Less than 8 8 - 16 16 - 32 32 - 40 More than 40
0
5
10
15
20
25
Years of Nursing Experience
Range of Years
Number of Employees
Figure 2: Column Chart for ‘Years of Nursing Experience’
the value of highest frequency in the data respectively. These are the values of central
tendency measures for the given parameter.
The variability is measured by standard deviation that gives the value of 1.1542,
clearly visible from the summary statistics table. The maximum range calculated and the
minimum range of the data set of ‘Perceived Relevance of Research Evidence to Practice
Score’ is five in both the cases. The value of the first quartile calculated is eight and the third
quartile is nine (Grove & Cipher, 2016). However, the maximum and the minimum values
are not required to calculate the measures of central tendency and variability measures
because, while calculating these the mean or the middle most value is calculated. Hence, the
complete data set is required for the calculation and not just the extreme values. The mode is
the most accurate measure of central tendency because it gives the values that incorporates
the highest frequency value based on the ‘Perceived Relevance of Research Evidence to
Practice Score’.
Answer A) (vi)
Less than 8 8 - 16 16 - 32 32 - 40 More than 40
0
5
10
15
20
25
Years of Nursing Experience
Range of Years
Number of Employees
Figure 2: Column Chart for ‘Years of Nursing Experience’
Secure Best Marks with AI Grader
Need help grading? Try our AI Grader for instant feedback on your assignments.
10STATISTICAL INTERPRETATION OF NURSING DATA
(Source: Created by Author)
Less than 8 8 - 16 16 - 32 32 - 40 More than 40
0
5
10
15
20
25
Years of Nursing Experience
Range of Years
Number of Employees
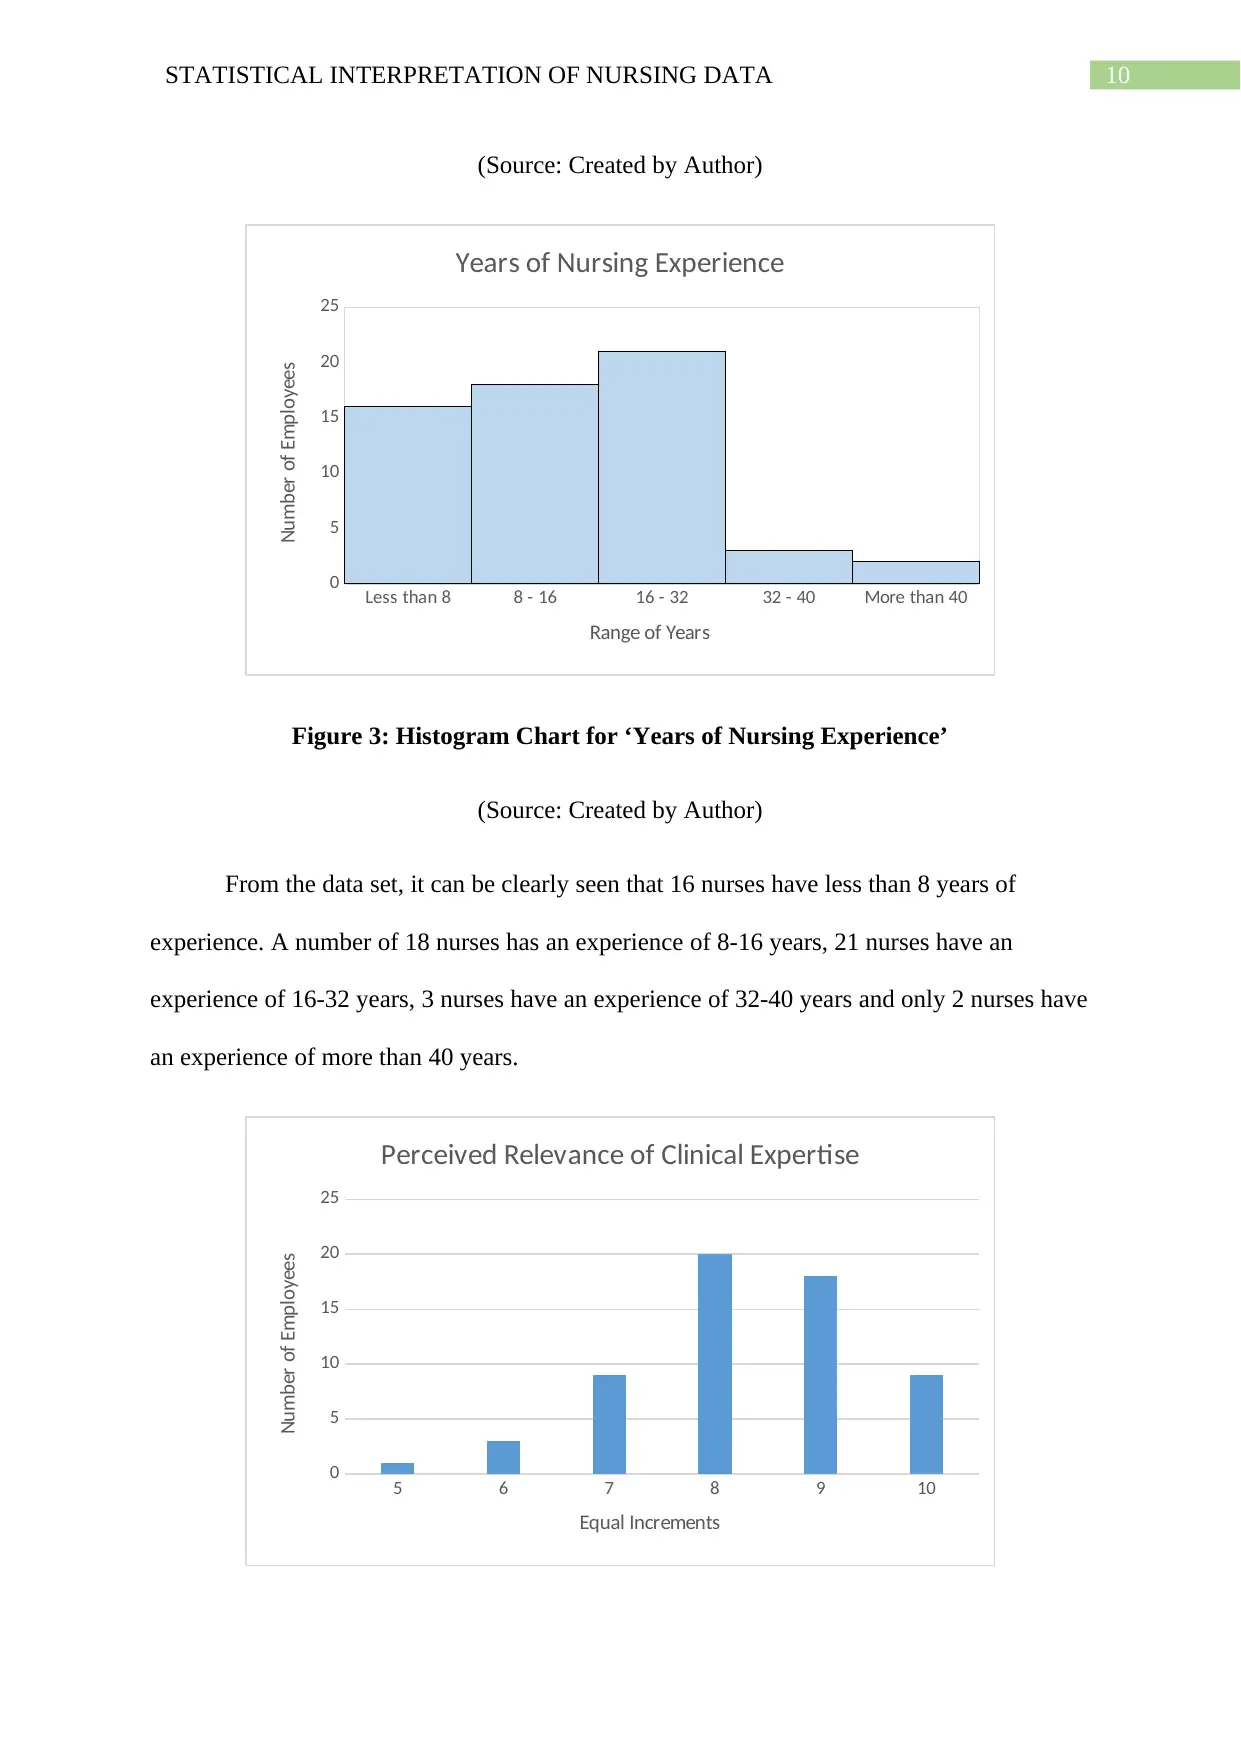
Figure 3: Histogram Chart for ‘Years of Nursing Experience’
(Source: Created by Author)
From the data set, it can be clearly seen that 16 nurses have less than 8 years of
experience. A number of 18 nurses has an experience of 8-16 years, 21 nurses have an
experience of 16-32 years, 3 nurses have an experience of 32-40 years and only 2 nurses have
an experience of more than 40 years.
5 6 7 8 9 10
0
5
10
15
20
25
Perceived Relevance of Clinical Expertise
Equal Increments
Number of Employees
(Source: Created by Author)
Less than 8 8 - 16 16 - 32 32 - 40 More than 40
0
5
10
15
20
25
Years of Nursing Experience
Range of Years
Number of Employees
Figure 3: Histogram Chart for ‘Years of Nursing Experience’
(Source: Created by Author)
From the data set, it can be clearly seen that 16 nurses have less than 8 years of
experience. A number of 18 nurses has an experience of 8-16 years, 21 nurses have an
experience of 16-32 years, 3 nurses have an experience of 32-40 years and only 2 nurses have
an experience of more than 40 years.
5 6 7 8 9 10
0
5
10
15
20
25
Perceived Relevance of Clinical Expertise
Equal Increments
Number of Employees
11STATISTICAL INTERPRETATION OF NURSING DATA
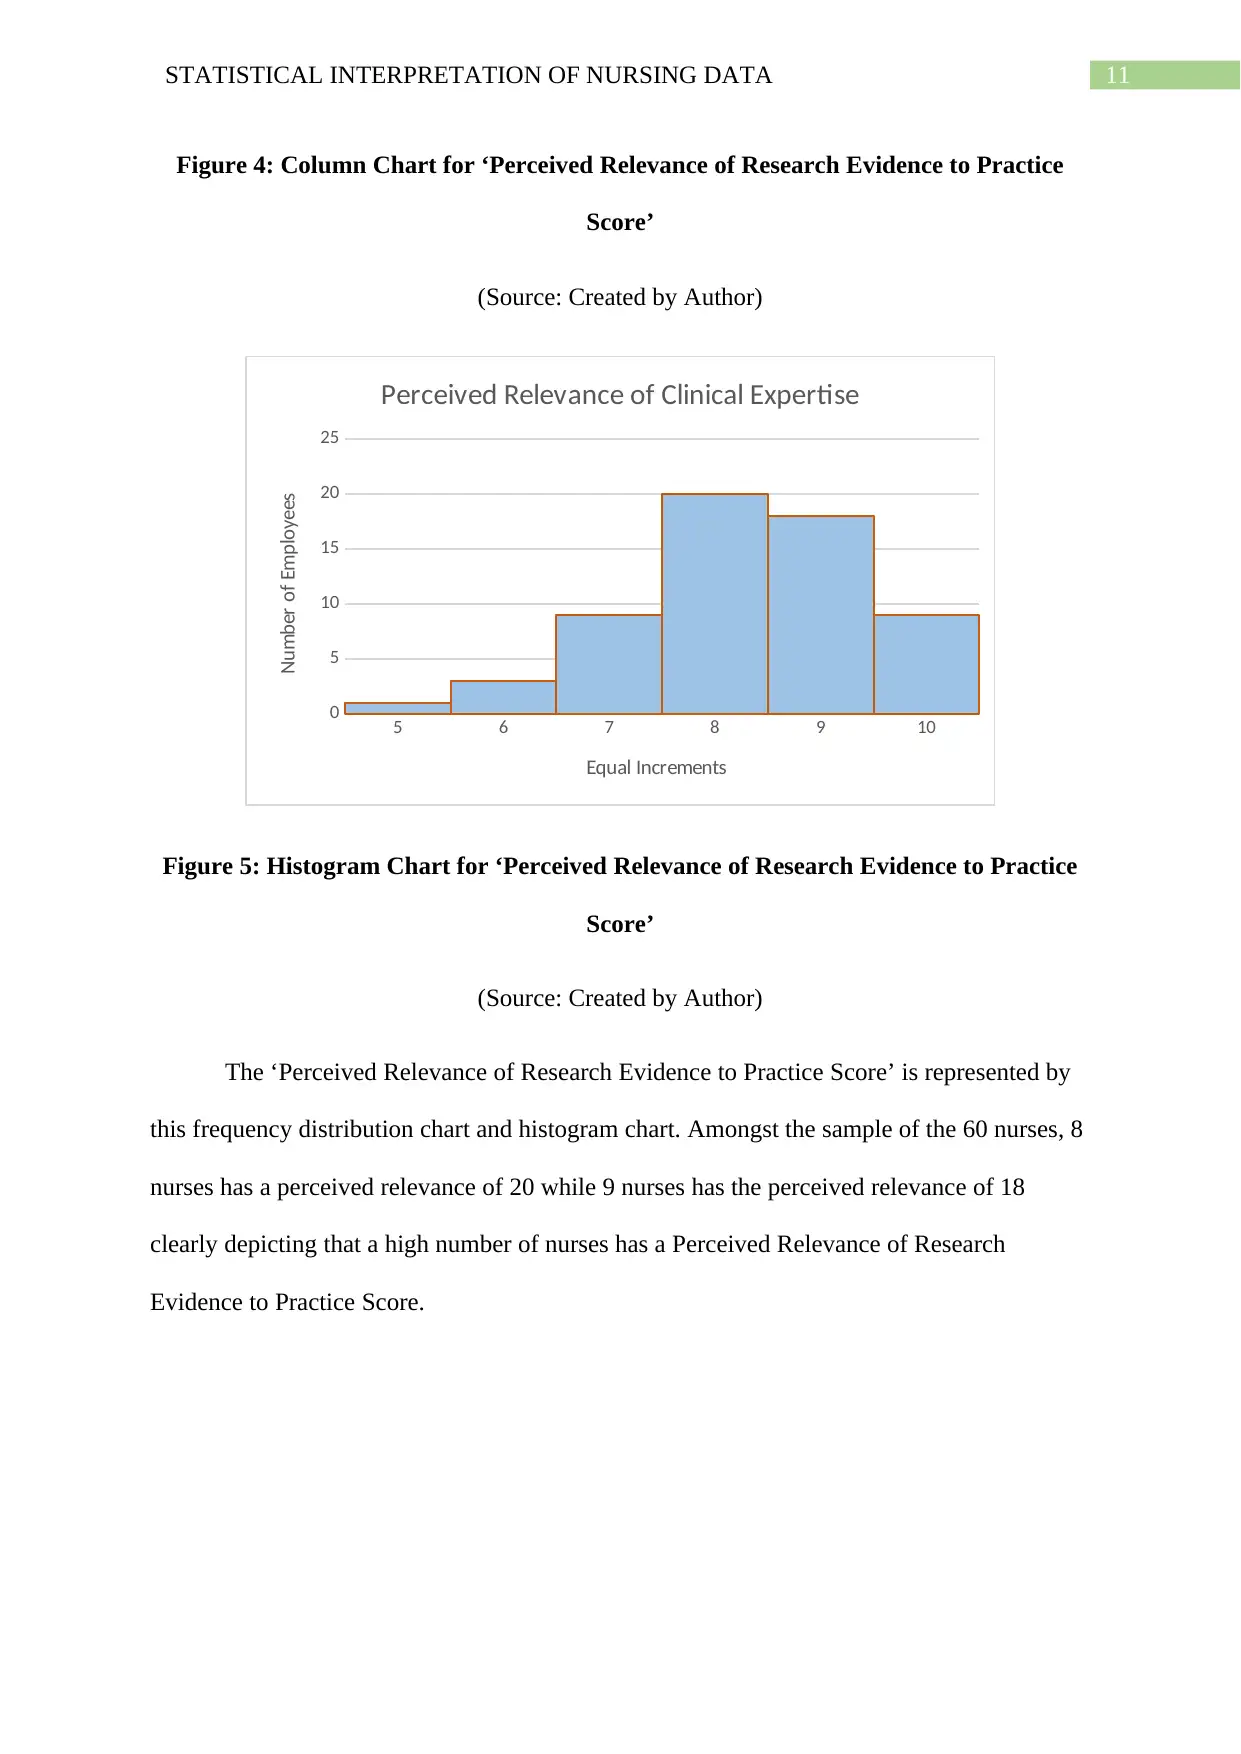
Figure 4: Column Chart for ‘Perceived Relevance of Research Evidence to Practice
Score’
(Source: Created by Author)
5 6 7 8 9 10
0
5
10
15
20
25
Perceived Relevance of Clinical Expertise
Equal Increments
Number of Employees
Figure 5: Histogram Chart for ‘Perceived Relevance of Research Evidence to Practice
Score’
(Source: Created by Author)
The ‘Perceived Relevance of Research Evidence to Practice Score’ is represented by
this frequency distribution chart and histogram chart. Amongst the sample of the 60 nurses, 8
nurses has a perceived relevance of 20 while 9 nurses has the perceived relevance of 18
clearly depicting that a high number of nurses has a Perceived Relevance of Research
Evidence to Practice Score.
12STATISTICAL INTERPRETATION OF NURSING DATA
Female Male
0
5
10
15
20
25
30
35
40
45
50 46
14
Gender
Categories of Gender
Number of Employees
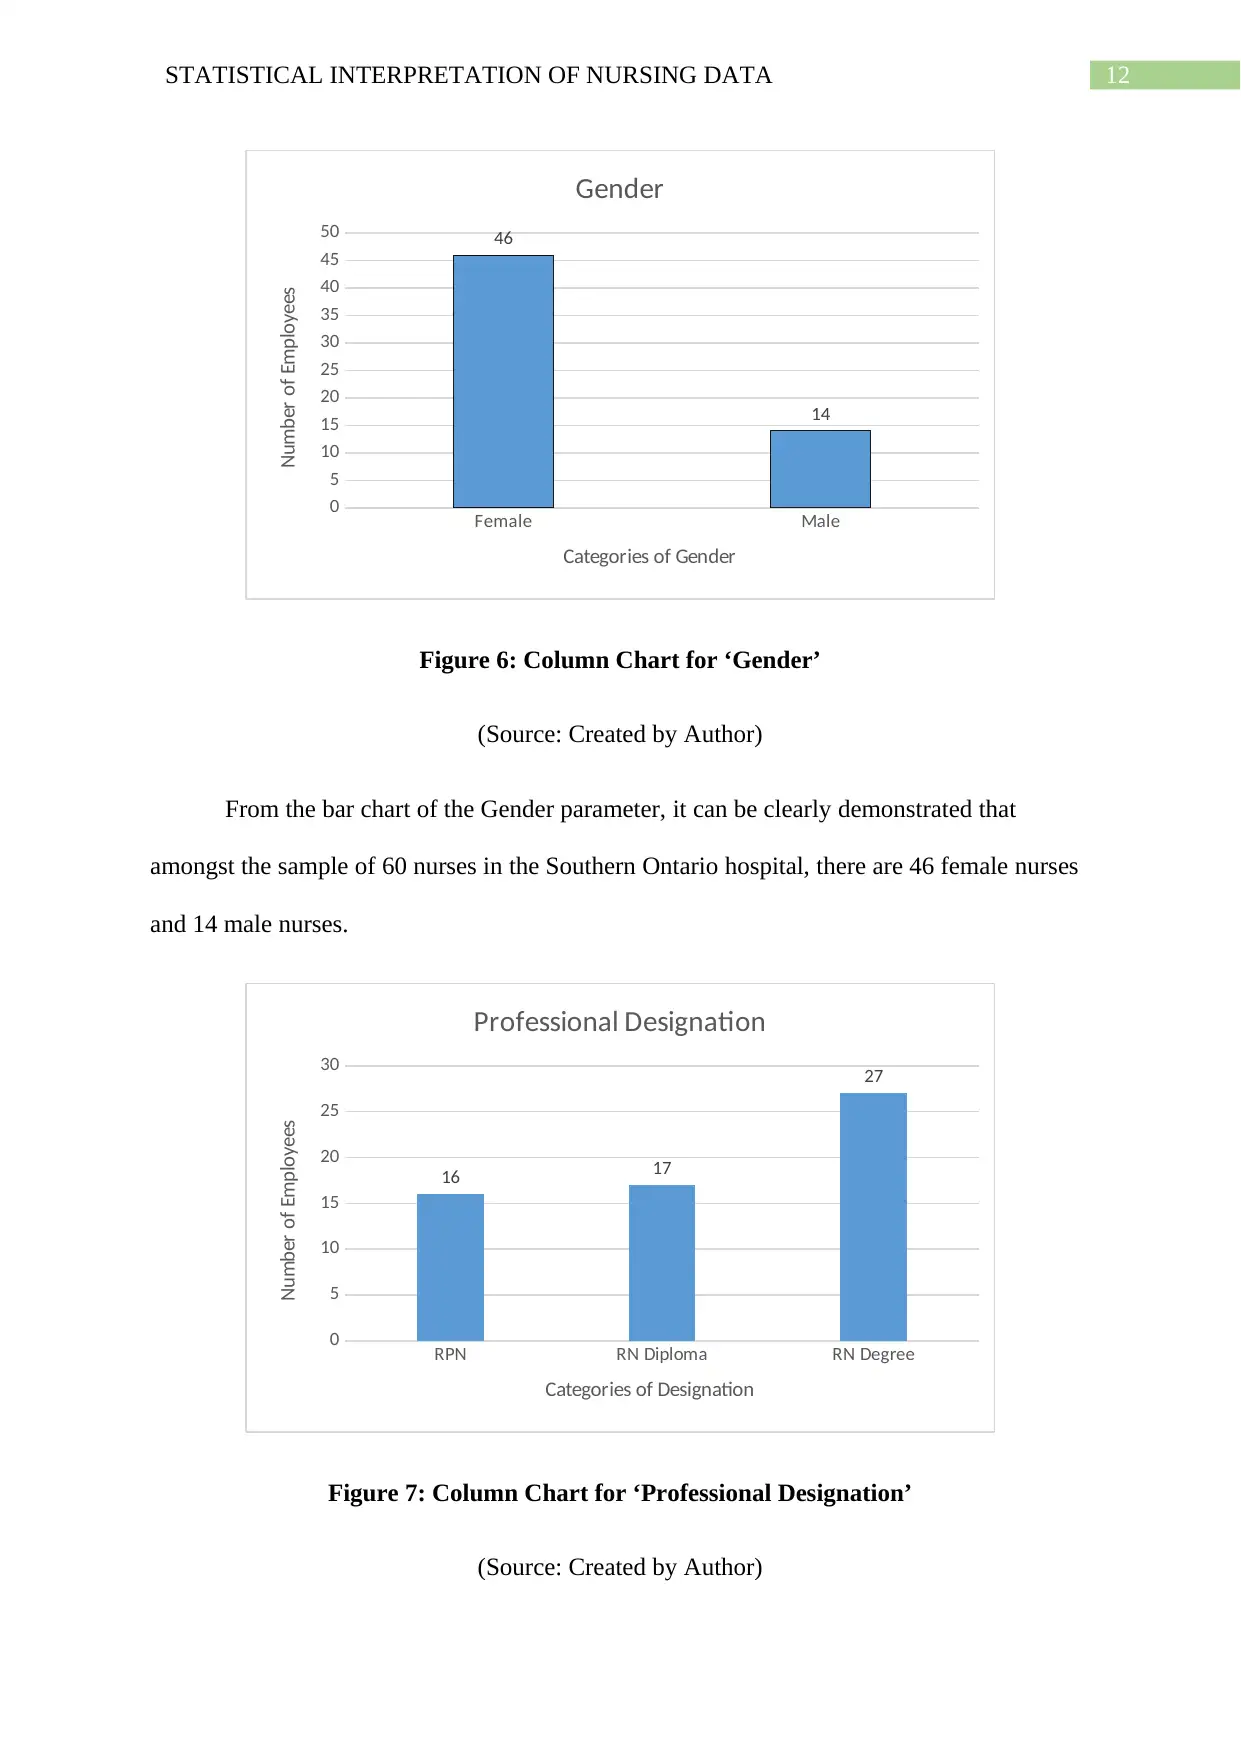
Figure 6: Column Chart for ‘Gender’
(Source: Created by Author)
From the bar chart of the Gender parameter, it can be clearly demonstrated that
amongst the sample of 60 nurses in the Southern Ontario hospital, there are 46 female nurses
and 14 male nurses.
RPN RN Diploma RN Degree
0
5
10
15
20
25
30
16 17
27
Professional Designation
Categories of Designation
Number of Employees
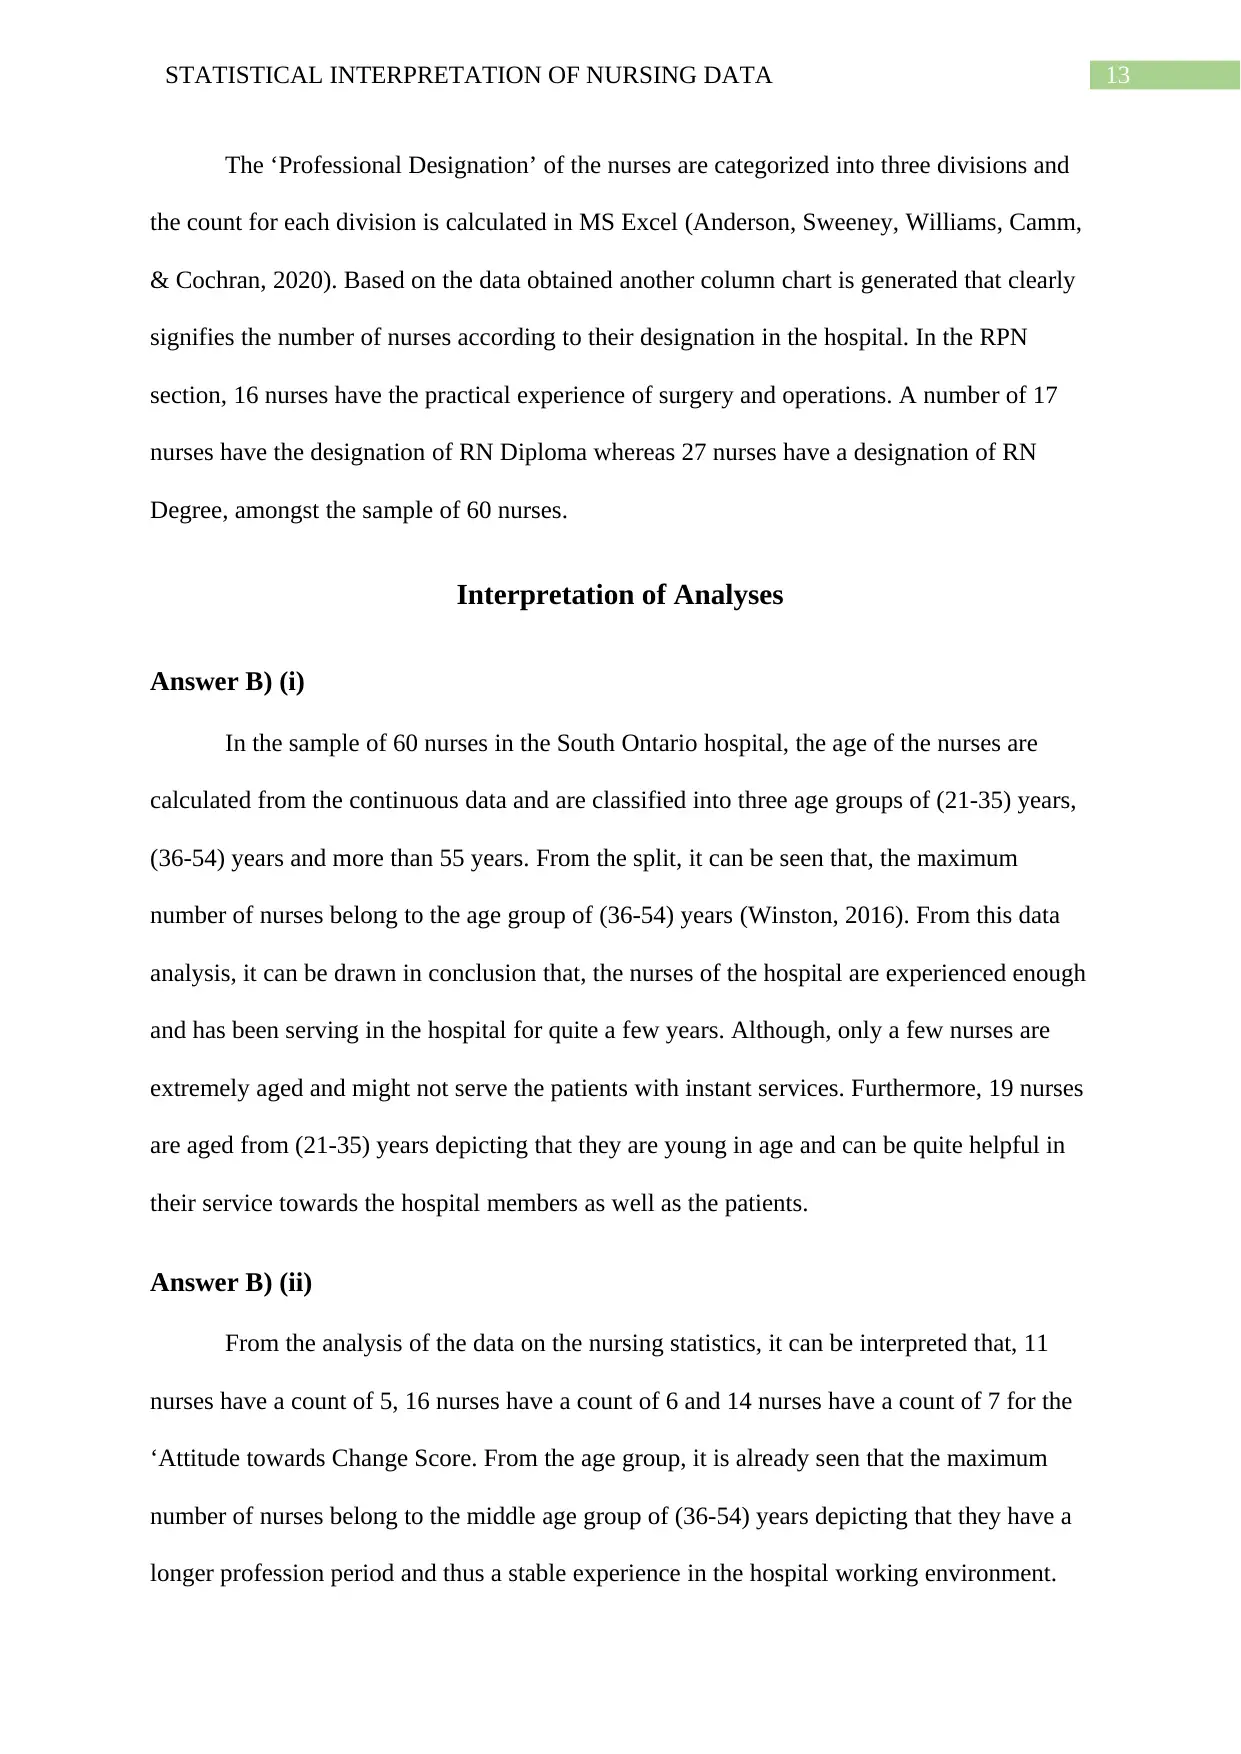
Figure 7: Column Chart for ‘Professional Designation’
(Source: Created by Author)
Female Male
0
5
10
15
20
25
30
35
40
45
50 46
14
Gender
Categories of Gender
Number of Employees
Figure 6: Column Chart for ‘Gender’
(Source: Created by Author)
From the bar chart of the Gender parameter, it can be clearly demonstrated that
amongst the sample of 60 nurses in the Southern Ontario hospital, there are 46 female nurses
and 14 male nurses.
RPN RN Diploma RN Degree
0
5
10
15
20
25
30
16 17
27
Professional Designation
Categories of Designation
Number of Employees
Figure 7: Column Chart for ‘Professional Designation’
(Source: Created by Author)
Paraphrase This Document
Need a fresh take? Get an instant paraphrase of this document with our AI Paraphraser
13STATISTICAL INTERPRETATION OF NURSING DATA
The ‘Professional Designation’ of the nurses are categorized into three divisions and
the count for each division is calculated in MS Excel (Anderson, Sweeney, Williams, Camm,
& Cochran, 2020). Based on the data obtained another column chart is generated that clearly
signifies the number of nurses according to their designation in the hospital. In the RPN
section, 16 nurses have the practical experience of surgery and operations. A number of 17
nurses have the designation of RN Diploma whereas 27 nurses have a designation of RN
Degree, amongst the sample of 60 nurses.
Interpretation of Analyses
Answer B) (i)
In the sample of 60 nurses in the South Ontario hospital, the age of the nurses are
calculated from the continuous data and are classified into three age groups of (21-35) years,
(36-54) years and more than 55 years. From the split, it can be seen that, the maximum
number of nurses belong to the age group of (36-54) years (Winston, 2016). From this data
analysis, it can be drawn in conclusion that, the nurses of the hospital are experienced enough
and has been serving in the hospital for quite a few years. Although, only a few nurses are
extremely aged and might not serve the patients with instant services. Furthermore, 19 nurses
are aged from (21-35) years depicting that they are young in age and can be quite helpful in
their service towards the hospital members as well as the patients.
Answer B) (ii)
From the analysis of the data on the nursing statistics, it can be interpreted that, 11
nurses have a count of 5, 16 nurses have a count of 6 and 14 nurses have a count of 7 for the
‘Attitude towards Change Score. From the age group, it is already seen that the maximum
number of nurses belong to the middle age group of (36-54) years depicting that they have a
longer profession period and thus a stable experience in the hospital working environment.
14STATISTICAL INTERPRETATION OF NURSING DATA
Hence, it can be concluded from the scenario that the experienced nurses have a positive
attitude to the changes that are taking place in the hospital environment. They will
incorporate positive changes in the hospital environment for beneficiary purposes. In this
way, that they can provide faster services towards the patients.
Answer B) (iii)
From the research conducted, it is clearly visible that the South Ontario hospital
incorporates maximum number of nurses that are highly qualified with practical surgery and
operational experiences. Their expertise can be measured from the service period they are
working from the organization and their own age group they are belonging to. Hence, the
maximum number of nurses who are experienced and dignified works for full time and has a
positive attitude towards the beneficiary changes in the environment of the hospital. In
addition, there are more female nurses for better service to the lady patients than male nurses
in the hospital scenario.
Answer B) (iv)
From the research study, it can be concluded that, the data incorporated by the
sample, highlights the maximum number of nurses in the age group of (36-54) years having a
renowned professional designation and profession period of an average of approximately 16
years. Due to their experience, they have a clinical expertise in their profession and
incorporates the changes positively in their working environment. However, the South
Ontario hospital in their nursing practise should include highly qualified nurses in the
younger age group. By this, they can provide better service to the patients in the hospital.
Conclusion
The research on the nursing data is being conducted on 60 nurses from the South
Ontario Hospital to assess how efficient the employees are in providing services to the
15STATISTICAL INTERPRETATION OF NURSING DATA
patients. The demographic profile of the nurses are being statistically analysed with the help
of their individual data like the Age that is being classified in Age Group, their length of
service in the hospital, their professional designation and so on. The interpretation of the
demographic analysis is written in the second part of the paper. The conclusion of the study is
that, the nurses are experienced with professional and practical experience. However, the
hospital should incorporate young nurses in a greater number to provide faster services to the
clients. In addition, the young clients can derive the effective practical experience by working
with the senior nurses in the work sphere.
Secure Best Marks with AI Grader
Need help grading? Try our AI Grader for instant feedback on your assignments.
16STATISTICAL INTERPRETATION OF NURSING DATA
References
Anderson, D. R., Sweeney, D. J., Williams, T. A., Camm, J. D., & Cochran, J. J.
(2020). Modern business statistics with Microsoft Excel. Cengage Learning.
Bree, R. T., & Gallagher, G. (2016). Using Microsoft Excel to code and thematically analyse
qualitative data: a simple, cost-effective approach. AISHE-J: The All Ireland Journal
of Teaching and Learning in Higher Education, 8(2).
Chisholm, L., Zhang, N. J., Hyer, K., Pradhan, R., Unruh, L., & Lin, F. C. (2018). Culture
change in nursing homes: What is the role of nursing home resources?. INQUIRY:
The Journal of Health Care Organization, Provision, and Financing, 55,
0046958018787043.
Grove, S. K., & Cipher, D. J. (2016). Statistics for Nursing Research-E-Book: A Workbook
for Evidence-Based Practice. Elsevier Health Sciences.
Jaggia, S., Kelly, A., Salzman, S., Olaru, D., Sriananthakumar, S., Beg, R., & Leighton, C.
(2016). Essentials of Business Statistics: communicating with numbers. McGrawhill
Education.
Mark, K. (2018). Introduction to Data Analysis Using Excel and Lab Report Writing Using
LaGCC Institution Data.
Ose, S. O. (2016). Using Excel and Word to structure qualitative data. Journal of Applied
Social Science, 10(2), 147-162.
Porter, M. (2018). An Overview of Nursing English Curricula at Private Universities in
Japan. Nursing English Nexus, 2(2), 22-30.
17STATISTICAL INTERPRETATION OF NURSING DATA
Tuominen, O. A., Lundgren-Laine, H., Kauppila, W., Hupli, M., & Salanterä, S. (2016). A
real-time Excel-based scheduling solution for nursing staff reallocation. Nursing
Management, 23(6).
Winston, W. (2016). Microsoft Excel data analysis and business modeling. Microsoft press.
Tuominen, O. A., Lundgren-Laine, H., Kauppila, W., Hupli, M., & Salanterä, S. (2016). A
real-time Excel-based scheduling solution for nursing staff reallocation. Nursing
Management, 23(6).
Winston, W. (2016). Microsoft Excel data analysis and business modeling. Microsoft press.
1 out of 18
Related Documents


Your All-in-One AI-Powered Toolkit for Academic Success.
+13062052269
info@desklib.com
Available 24*7 on WhatsApp / Email
![[object Object]](/_next/static/media/star-bottom.7253800d.svg)
Unlock your academic potential
© 2024 | Zucol Services PVT LTD | All rights reserved.