Statistical Tools and Techniques - Doc
17 Pages2234 Words21 Views
Added on 2021-02-21
Statistical Tools and Techniques - Doc
Added on 2021-02-21
ShareRelated Documents
Statistics

Executive SummaryIn the present era, business units emphasize on undertaking statistical tools andtechniques for deriving useful information from large data set. The aim behind conducting studyis to identify opportunities available in Asian shoe market. For this purpose, An Australianmanufacturing company took sample of 99 products for identifying opportunities. In order toaddress such quantitative issue SPSS tools like descriptive statistics, ANOVA and regression hasbeen applied. It has assessed from the analysis that shoe prices prevailed in countries likeThailand, Singapore and China are different. However, shoe prices of males and females aremoving in similar direction. Thus, it is recommended to company that focus needs to be placedon maintaining lower price level which in turn helps in attracting more customers in Asianmarket.
TABLE OF CONTENTSINTRODUCTION...........................................................................................................................4Statistical problem and analysis...................................................................................................4PART 1............................................................................................................................................41. Calculating mean, median, mode, standard deviation and coefficient of variation for pricesfor men, women shoes.................................................................................................................42. Computing descriptive statistics for three selected countries (Thailand, Singapore andChina)..........................................................................................................................................7PART 2..........................................................................................................................................101. Determining whether average prices for female shoes is less than from male......................102. Determining differences in the shoe prices of different countries.........................................113. Graphical presentation of production cost and price using scatter diagram..........................124. Using regression commenting on the relationship between price and production cost.........13CONCLUSION..............................................................................................................................15REFERENCES..............................................................................................................................17
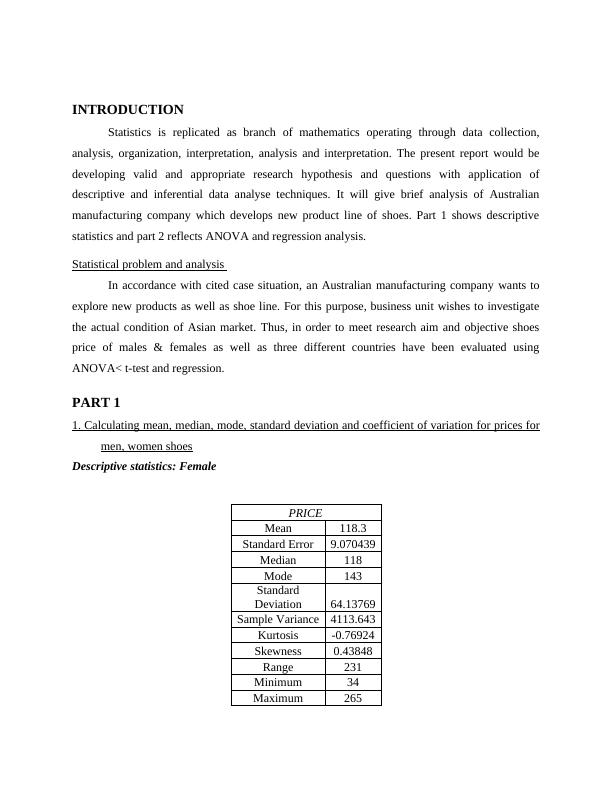
INTRODUCTION Statistics is replicated as branch of mathematics operating through data collection,analysis, organization, interpretation, analysis and interpretation. The present report would bedeveloping valid and appropriate research hypothesis and questions with application ofdescriptive and inferential data analyse techniques. It will give brief analysis of Australianmanufacturing company which develops new product line of shoes. Part 1 shows descriptivestatistics and part 2 reflects ANOVA and regression analysis.Statistical problem and analysis In accordance with cited case situation, an Australian manufacturing company wants toexplore new products as well as shoe line. For this purpose, business unit wishes to investigatethe actual condition of Asian market. Thus, in order to meet research aim and objective shoesprice of males & females as well as three different countries have been evaluated usingANOVA< t-test and regression. PART 11. Calculating mean, median, mode, standard deviation and coefficient of variation for prices formen, women shoesDescriptive statistics: FemalePRICEMean118.3Standard Error9.070439Median118Mode143StandardDeviation64.13769Sample Variance4113.643Kurtosis-0.76924Skewness0.43848Range231Minimum34Maximum265
End of preview
Want to access all the pages? Upload your documents or become a member.
Related Documents
Analysis of Shoe Prices in Asian Marketlg...
|15
|2443
|304
Analysis of Manufacturing Industries in Terms of Employees, Sales, and Revenuelg...
|6
|1080
|134
Regression Analysis for House Priceslg...
|13
|1317
|118
(PDF) An Introduction to Statisticslg...
|10
|1429
|181
Research Methods in Psychologylg...
|16
|1636
|117
Solved You are a Consultant who Works for The Diligentlg...
|7
|1155
|16