logo

Linear Relationship between Osteocalcin and Bone Formation

This study concerns with bone formation and the measurement of bone turnover markers such as osteocalcin (OC).

11 Pages1295 Words332 Views
   

Added on  2022-11-29

About This Document

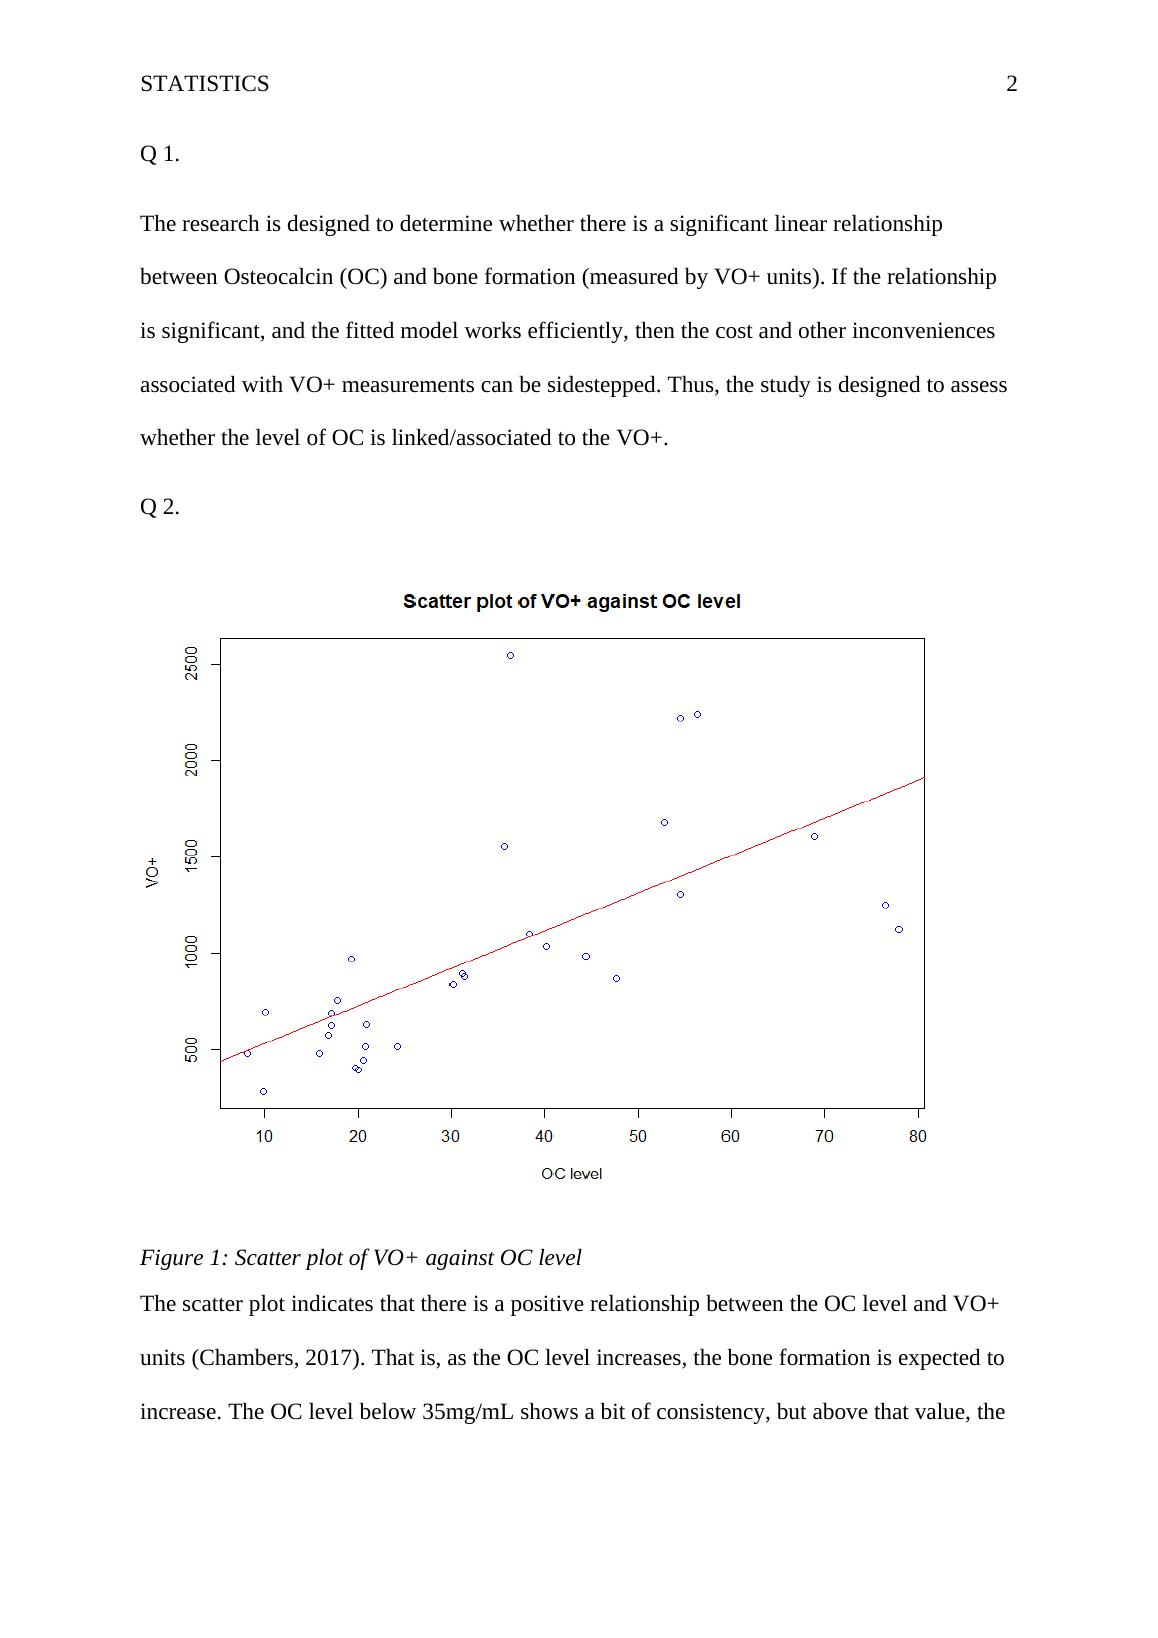
This study examines the linear relationship between Osteocalcin (OC) and bone formation (measured by VO+ units) and assesses whether the level of OC is linked to VO+.

Linear Relationship between Osteocalcin and Bone Formation

This study concerns with bone formation and the measurement of bone turnover markers such as osteocalcin (OC).

   Added on 2022-11-29

ShareRelated Documents
Running head: STATISTICS 1
Statistics
Name:
Institution:
Linear Relationship between Osteocalcin and Bone Formation_1
STATISTICS 2
Q 1.
The research is designed to determine whether there is a significant linear relationship
between Osteocalcin (OC) and bone formation (measured by VO+ units). If the relationship
is significant, and the fitted model works efficiently, then the cost and other inconveniences
associated with VO+ measurements can be sidestepped. Thus, the study is designed to assess
whether the level of OC is linked/associated to the VO+.
Q 2.
Figure 1: Scatter plot of VO+ against OC level
The scatter plot indicates that there is a positive relationship between the OC level and VO+
units (Chambers, 2017). That is, as the OC level increases, the bone formation is expected to
increase. The OC level below 35mg/mL shows a bit of consistency, but above that value, the
Linear Relationship between Osteocalcin and Bone Formation_2
STATISTICS 3
bone formation is inconsistent. However, a confirmatory test is necessary to ascertain if the
relationship is significant.
Q 3.
The regression model assumptions include; linearity, homoscedasticity, independence, and
normality of the independent variable (Cohen, West, & Aiken, 2014). In this case, the
assumption is that the data are normal, and the readings of one person are independent of
each other. The hypothesis that the linear relationship is significant was tested, and the results
are as follows.
Table 1: Model 1 summary
Call:
glm(formula = Bone.Formation$voplus ~ Bone.Formation$oc)
Deviance Residuals:
Min 1Q Median 3Q Max
-727.45 -234.43 -85.08 43.66 1500.99
Coefficients:
Estimate Std. Error t value Pr(>|t|)
(Intercept) 334.034 159.241 2.098 0.0448 *
Bone.Formation$oc 19.505 4.127 4.726 5.43e-05 ***
---
Signif. codes: 0 ‘***’ 0.001 ‘**’ 0.01 ‘*’ 0.05 ‘.’ 0.1 ‘ ’ 1
(Dispersion parameter for gaussian family taken to be 196492.3)
Null deviance: 10087061 on 30 degrees of freedom
Residual deviance: 5698276 on 29 degrees of freedom
AIC: 469.75
Number of Fisher Scoring iterations: 2
The summary indicates that there is a significant relationship between OC and VO+ (bone
formation) ( β=19.505 , t ( 30 ) =4.127 , pvalue<.05 ). Thus, the linearity assumption is met.
Also, it can be concluded that the OC can be used to predict bone formation. The residual
assessment was performed, and the results are as follows:
Linear Relationship between Osteocalcin and Bone Formation_3
STATISTICS 4
Figure 2: Model 1 residual analysis
The plot deduces that the residuals evenly, with no discerning trend. This points out that the
residuals are normally distributed. Also, the QQ-plot suggests that the data are normally
distributed as the observations lie on a relatively straight line. Thus, the homoskedasticity
assumption is met. However, there are a few points that could be influencing the association
between the dependent and independent variable.
Q 4.
Linear Relationship between Osteocalcin and Bone Formation_4

End of preview

Want to access all the pages? Upload your documents or become a member.

Related Documents
Linear Regression and Correlation Analysis Assignment
|13
|1372
|109

Econometrics Assignment Solution
|18
|1742
|129

Problem Analysis and Statistics Student Name: Instructor Name:
|3
|452
|88

Linear Models – Mini Analysis
|28
|2921
|177

ECONOMETRIC QUESTION 3: Relationship between Total Consumption Expenditure and Level of Wealth
|16
|2449
|55

Linear Regression Report on Retention Rate and Graduation Rate in Online Education
|7
|1705
|257