Linear Regression Analysis of Franchise Sales
VerifiedAdded on 2020/04/01
|10
|1747
|88
AI Summary
This assignment examines the use of linear regression to predict sales for a franchise business. It involves building a model based on variables such as floor area, inventory, advertising expenditure, the size of the sales district, and the number of competing stores. The analysis includes calculating coefficients, determining significance levels, and using the model to forecast sales for a specific scenario with given input values.
Contribute Materials
Your contribution can guide someone’s learning journey. Share your
documents today.

Surname 1
Statistics and business decision making
Name
The Name of the Class (Course)
Professor (Tutor)
Name of the University
The City and State where it is located
Date
Statistics and business decision making
Name
The Name of the Class (Course)
Professor (Tutor)
Name of the University
The City and State where it is located
Date
Secure Best Marks with AI Grader
Need help grading? Try our AI Grader for instant feedback on your assignments.
Surname 2
Task 1 10 marks
The data for Task 1 in the data file for Assignment represents the starting costs in thousands
of dollars) for different kind of business.
1. Find mean, median, mode, range, variance and standard deviation separately for
every type of business (2 marks)
X1 X2 X3 X4 X5
Mean 83
92.090
9 72.3 87 51.625
Median 80 87 70 97.5 49
Mode 35 #N/A #N/A 100 30
Range 105 120 90 115 90
Std.
Dev
34.134
5
38.893
3
31.365
4
35.904
2
27.074
9
Varianc
e
1165.1
7
1512.6
9
983.78
9
1289.1
1 733.05
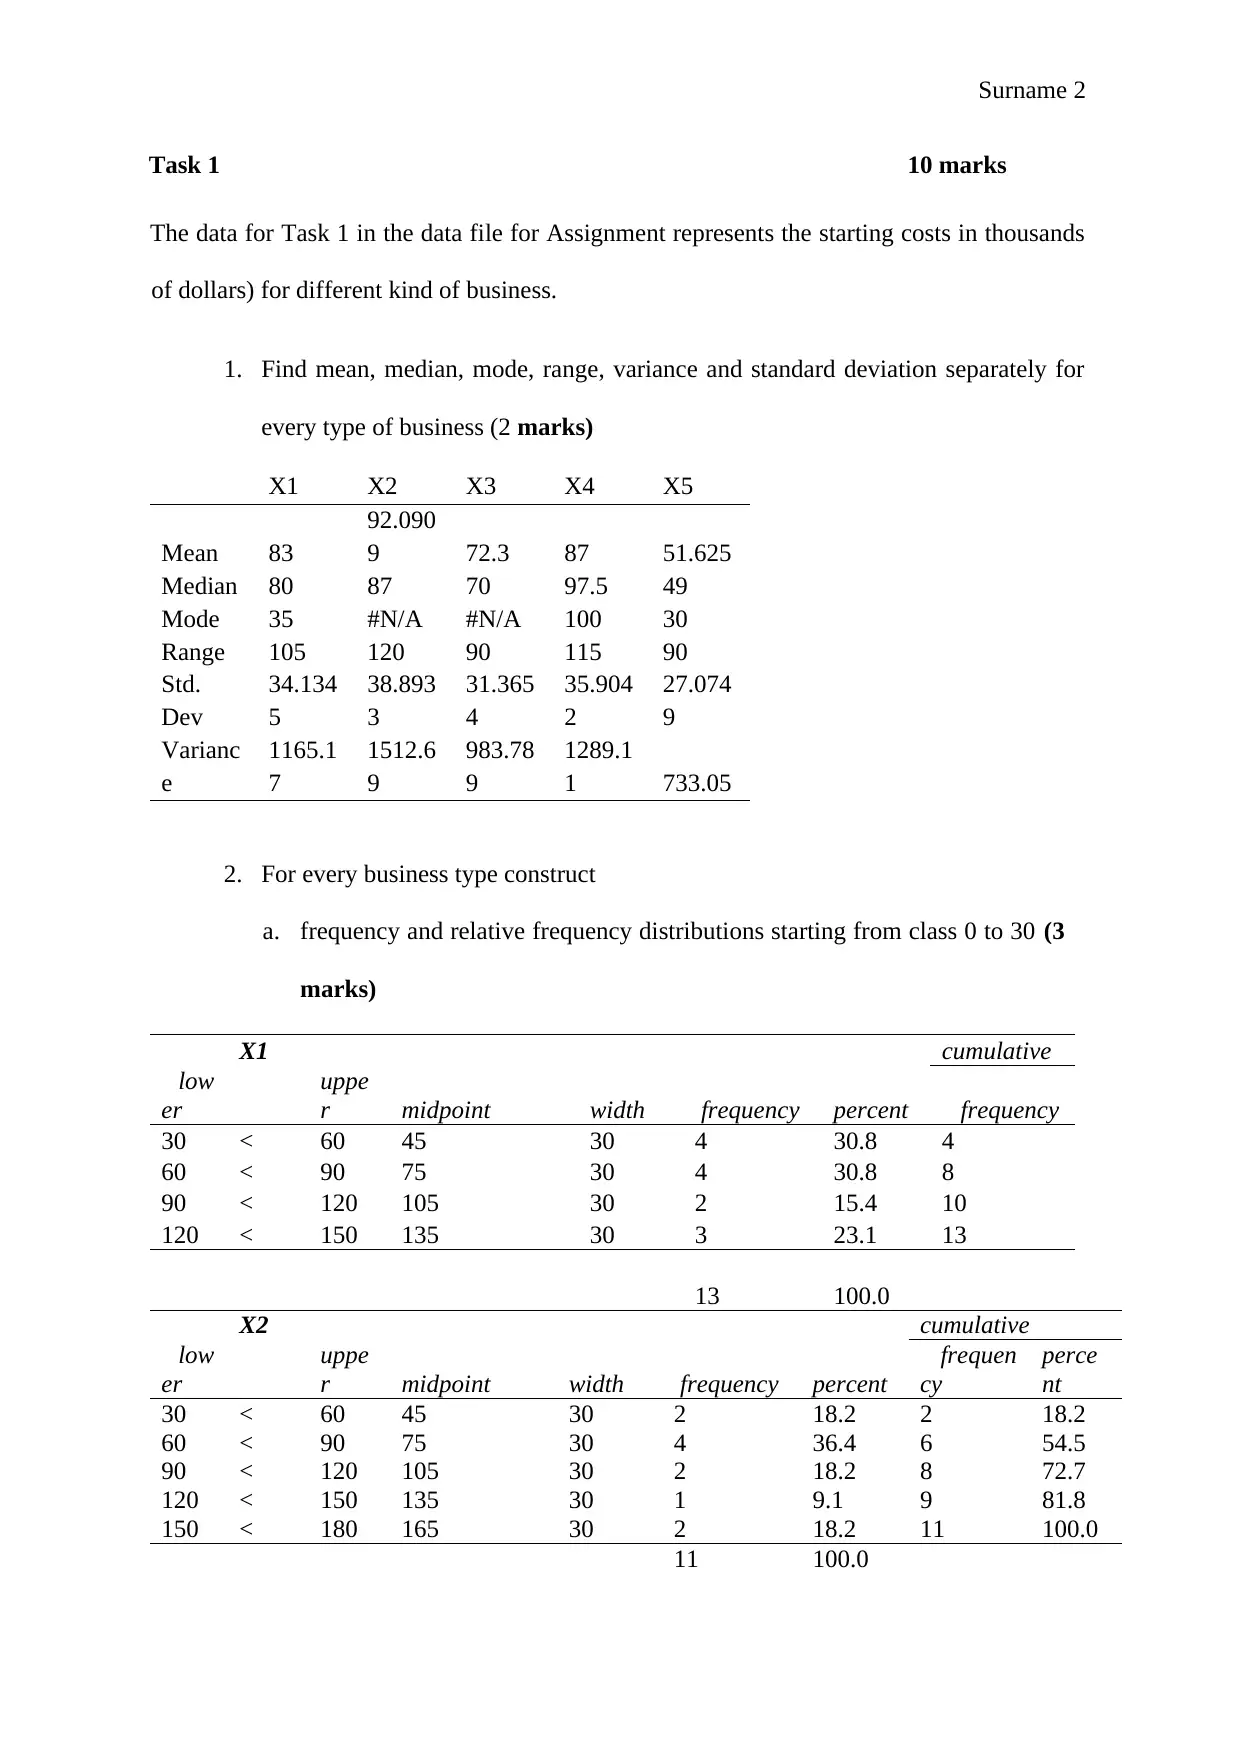
2. For every business type construct
a. frequency and relative frequency distributions starting from class 0 to 30 (3
marks)
X1 cumulative
low
er
uppe
r midpoint width frequency percent frequency
30 < 60 45 30 4 30.8 4
60 < 90 75 30 4 30.8 8
90 < 120 105 30 2 15.4 10
120 < 150 135 30 3 23.1 13
13 100.0
X2 cumulative
low
er
uppe
r midpoint width frequency percent
frequen
cy
perce
nt
30 < 60 45 30 2 18.2 2 18.2
60 < 90 75 30 4 36.4 6 54.5
90 < 120 105 30 2 18.2 8 72.7
120 < 150 135 30 1 9.1 9 81.8
150 < 180 165 30 2 18.2 11 100.0
11 100.0
Task 1 10 marks
The data for Task 1 in the data file for Assignment represents the starting costs in thousands
of dollars) for different kind of business.
1. Find mean, median, mode, range, variance and standard deviation separately for
every type of business (2 marks)
X1 X2 X3 X4 X5
Mean 83
92.090
9 72.3 87 51.625
Median 80 87 70 97.5 49
Mode 35 #N/A #N/A 100 30
Range 105 120 90 115 90
Std.
Dev
34.134
5
38.893
3
31.365
4
35.904
2
27.074
9
Varianc
e
1165.1
7
1512.6
9
983.78
9
1289.1
1 733.05
2. For every business type construct
a. frequency and relative frequency distributions starting from class 0 to 30 (3
marks)
X1 cumulative
low
er
uppe
r midpoint width frequency percent frequency
30 < 60 45 30 4 30.8 4
60 < 90 75 30 4 30.8 8
90 < 120 105 30 2 15.4 10
120 < 150 135 30 3 23.1 13
13 100.0
X2 cumulative
low
er
uppe
r midpoint width frequency percent
frequen
cy
perce
nt
30 < 60 45 30 2 18.2 2 18.2
60 < 90 75 30 4 36.4 6 54.5
90 < 120 105 30 2 18.2 8 72.7
120 < 150 135 30 1 9.1 9 81.8
150 < 180 165 30 2 18.2 11 100.0
11 100.0
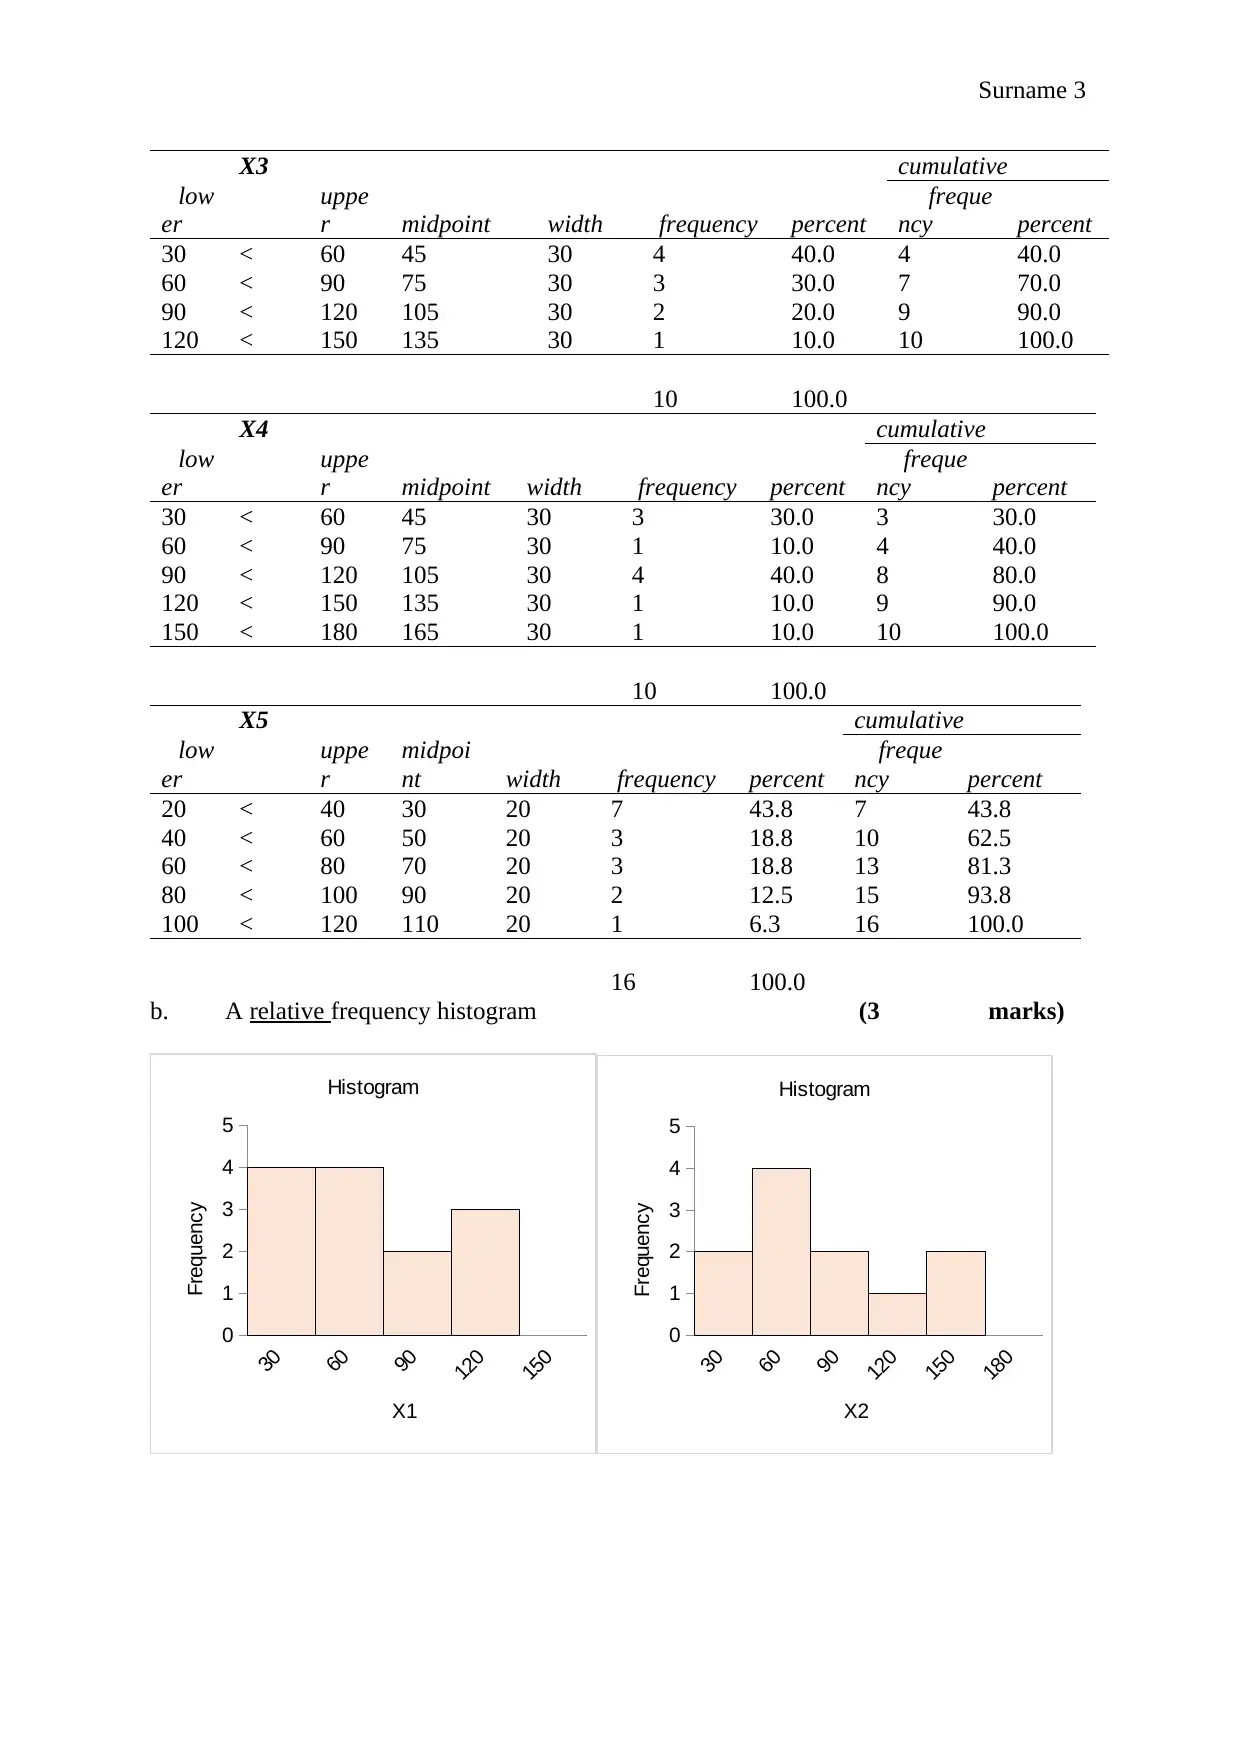
Surname 3
X3 cumulative
low
er
uppe
r midpoint width frequency percent
freque
ncy percent
30 < 60 45 30 4 40.0 4 40.0
60 < 90 75 30 3 30.0 7 70.0
90 < 120 105 30 2 20.0 9 90.0
120 < 150 135 30 1 10.0 10 100.0
10 100.0
X4 cumulative
low
er
uppe
r midpoint width frequency percent
freque
ncy percent
30 < 60 45 30 3 30.0 3 30.0
60 < 90 75 30 1 10.0 4 40.0
90 < 120 105 30 4 40.0 8 80.0
120 < 150 135 30 1 10.0 9 90.0
150 < 180 165 30 1 10.0 10 100.0
10 100.0
X5 cumulative
low
er
uppe
r
midpoi
nt width frequency percent
freque
ncy percent
20 < 40 30 20 7 43.8 7 43.8
40 < 60 50 20 3 18.8 10 62.5
60 < 80 70 20 3 18.8 13 81.3
80 < 100 90 20 2 12.5 15 93.8
100 < 120 110 20 1 6.3 16 100.0
16 100.0
b. A relative frequency histogram (3 marks)
30
60
90
120
150
0
1
2
3
4
5
Histogram
X1
Frequency
30
60
90
120
150
180
0
1
2
3
4
5
Histogram
X2
Frequency
Surname 4
30
60
90
120
150
0
1
2
3
4
5
Histogram
X3
Frequency
30
60
90
120
150
180
0
1
2
3
4
5
Histogram
X4
Frequency
20
40
60
80
100
120
0
1
2
3
4
5
6
7
8
Histogram
X5
Frequency
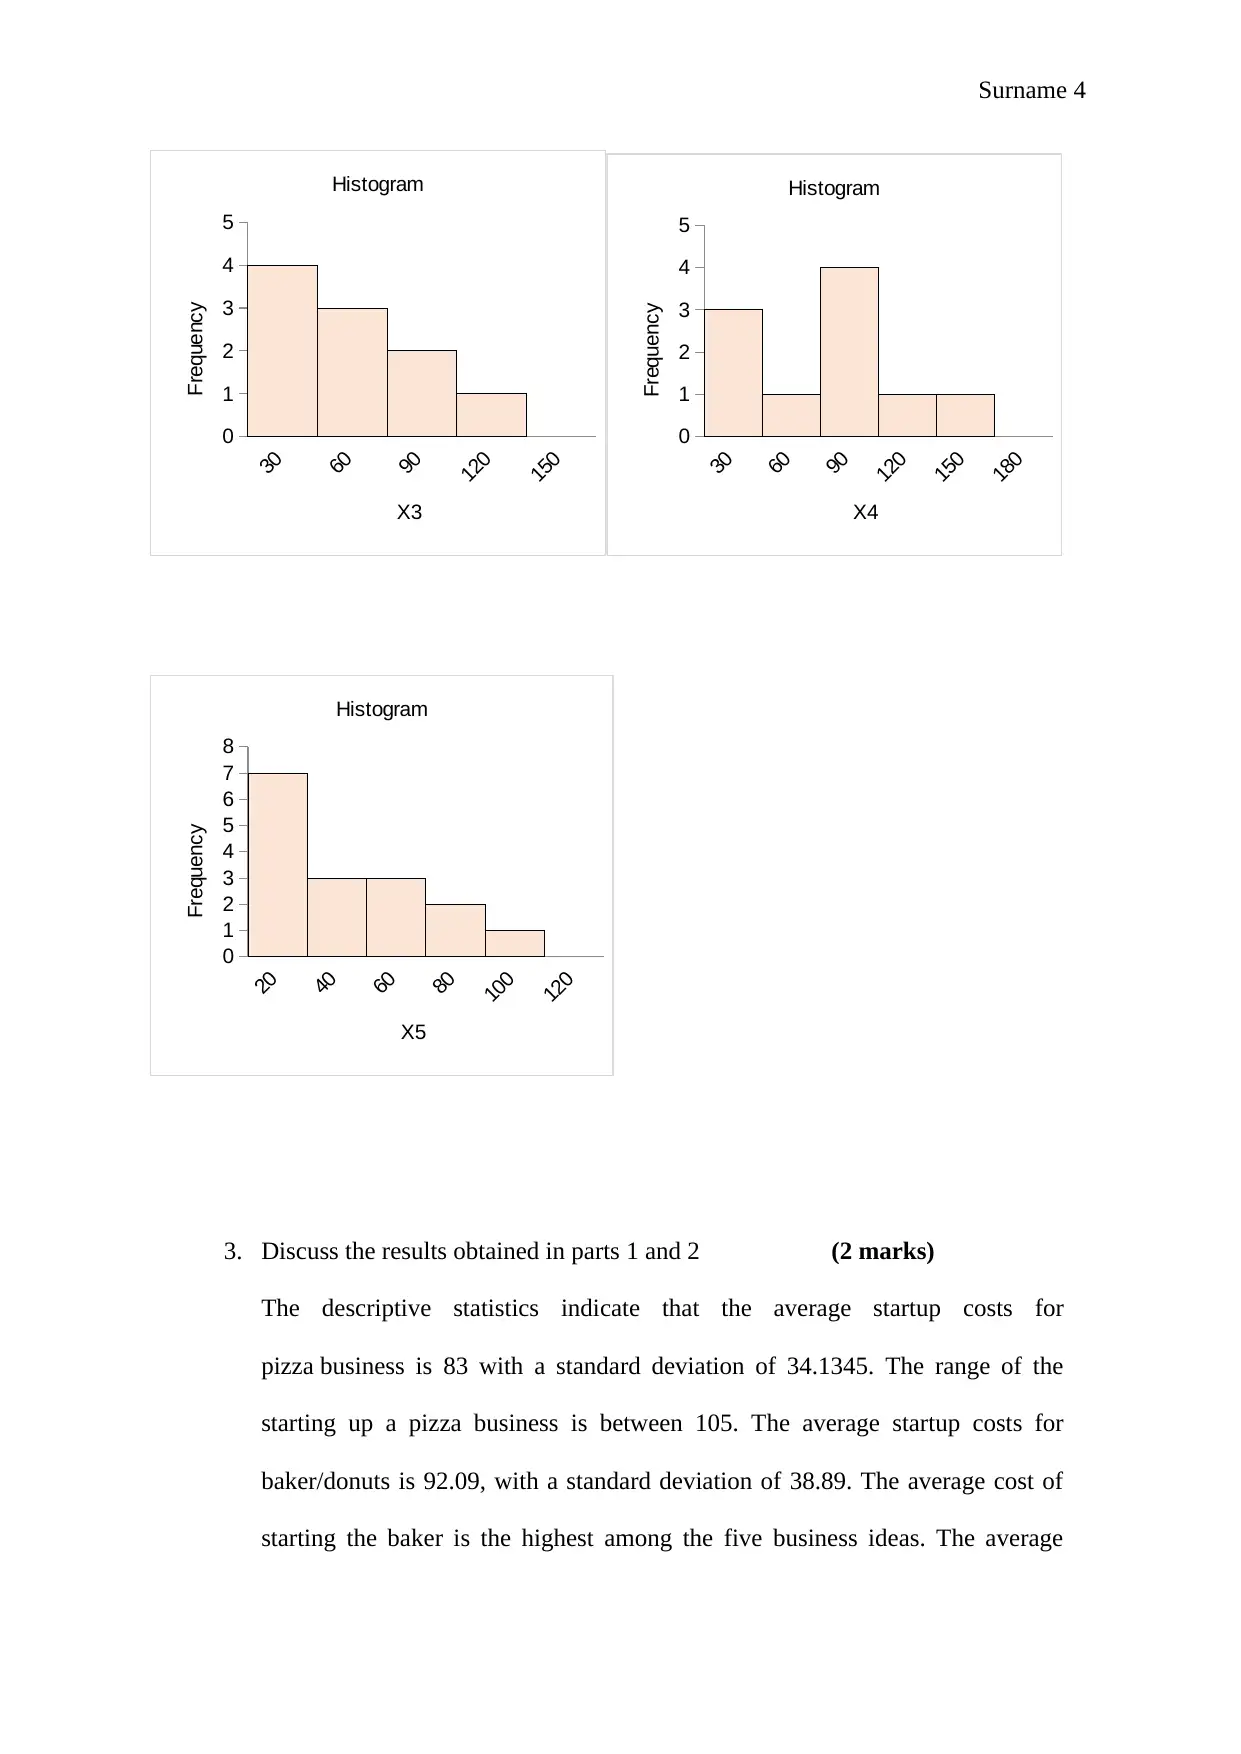
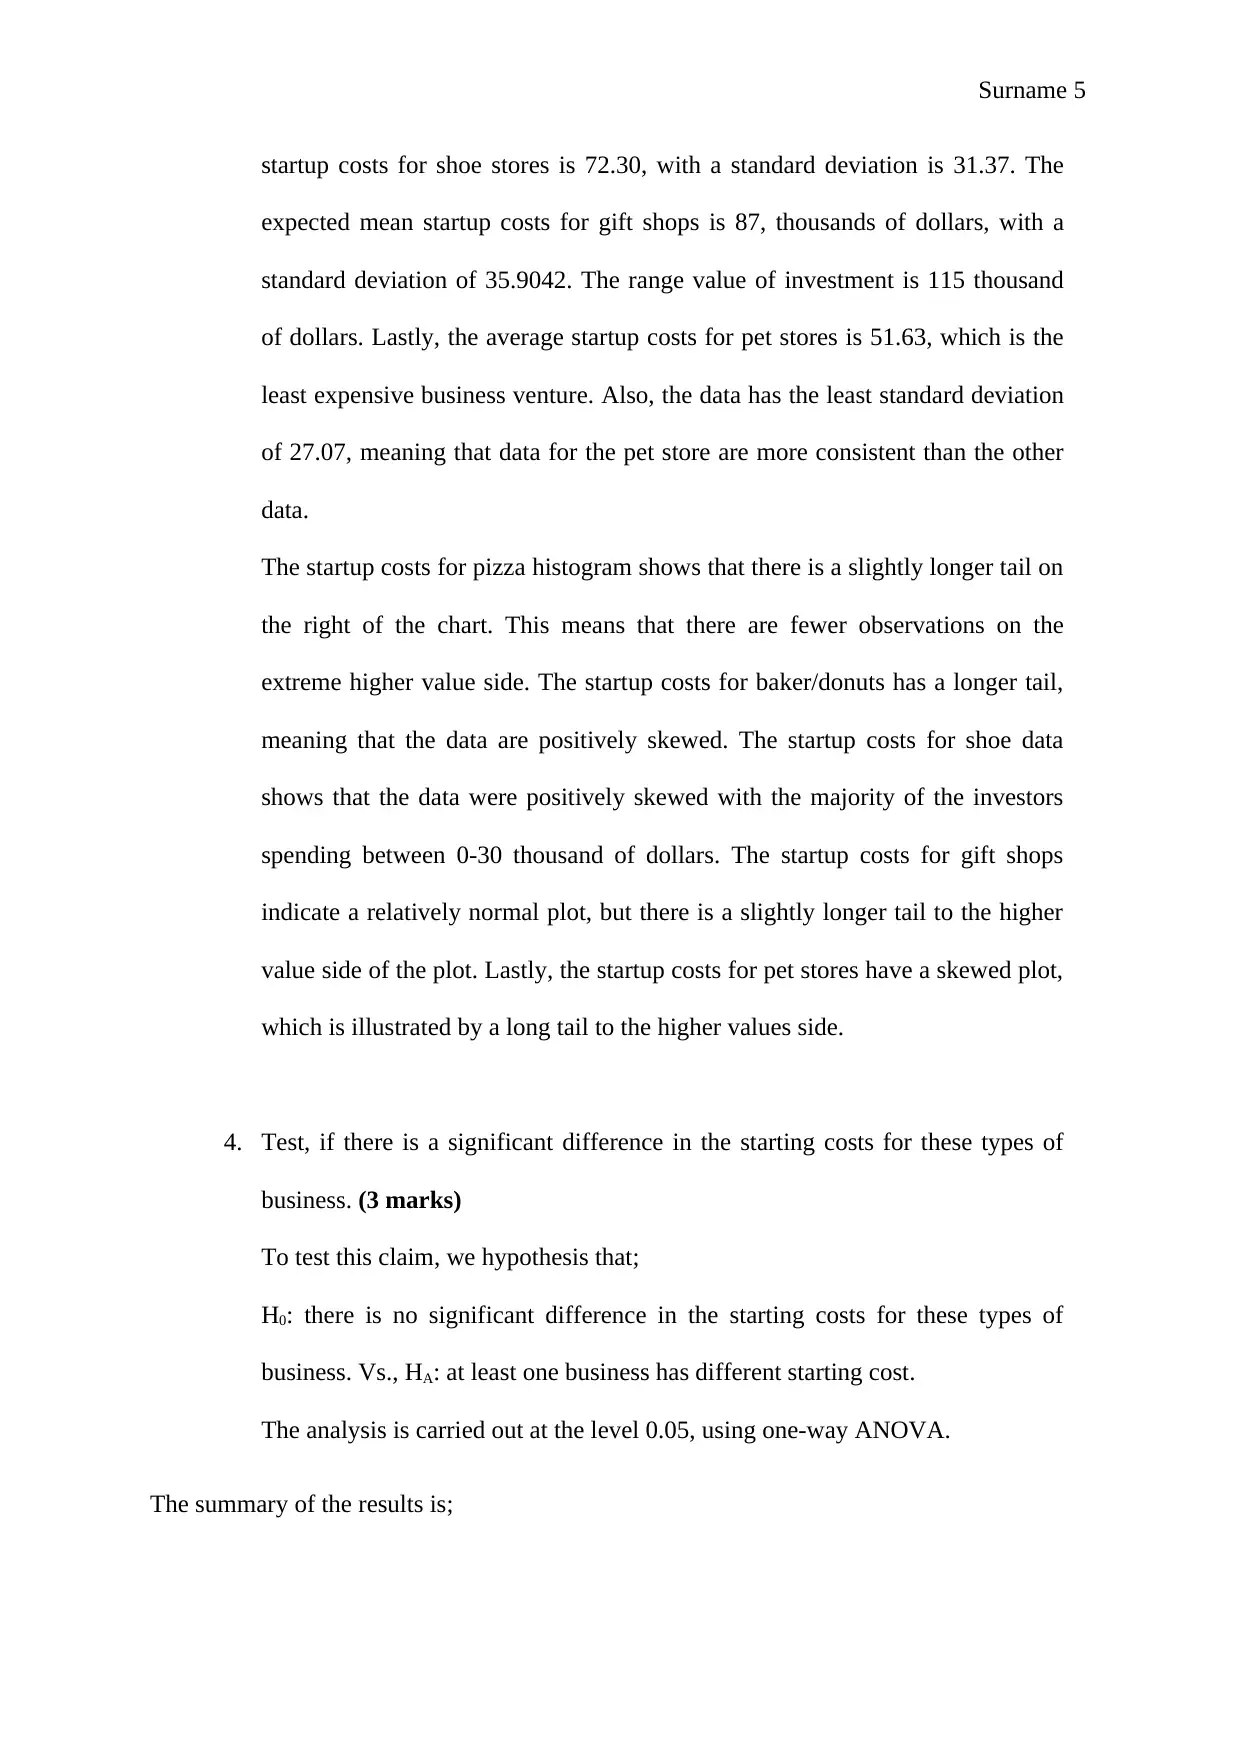
3. Discuss the results obtained in parts 1 and 2 (2 marks)
The descriptive statistics indicate that the average startup costs for
pizza business is 83 with a standard deviation of 34.1345. The range of the
starting up a pizza business is between 105. The average startup costs for
baker/donuts is 92.09, with a standard deviation of 38.89. The average cost of
starting the baker is the highest among the five business ideas. The average
30
60
90
120
150
0
1
2
3
4
5
Histogram
X3
Frequency
30
60
90
120
150
180
0
1
2
3
4
5
Histogram
X4
Frequency
20
40
60
80
100
120
0
1
2
3
4
5
6
7
8
Histogram
X5
Frequency
3. Discuss the results obtained in parts 1 and 2 (2 marks)
The descriptive statistics indicate that the average startup costs for
pizza business is 83 with a standard deviation of 34.1345. The range of the
starting up a pizza business is between 105. The average startup costs for
baker/donuts is 92.09, with a standard deviation of 38.89. The average cost of
starting the baker is the highest among the five business ideas. The average
Secure Best Marks with AI Grader
Need help grading? Try our AI Grader for instant feedback on your assignments.
Surname 5
startup costs for shoe stores is 72.30, with a standard deviation is 31.37. The
expected mean startup costs for gift shops is 87, thousands of dollars, with a
standard deviation of 35.9042. The range value of investment is 115 thousand
of dollars. Lastly, the average startup costs for pet stores is 51.63, which is the
least expensive business venture. Also, the data has the least standard deviation
of 27.07, meaning that data for the pet store are more consistent than the other
data.
The startup costs for pizza histogram shows that there is a slightly longer tail on
the right of the chart. This means that there are fewer observations on the
extreme higher value side. The startup costs for baker/donuts has a longer tail,
meaning that the data are positively skewed. The startup costs for shoe data
shows that the data were positively skewed with the majority of the investors
spending between 0-30 thousand of dollars. The startup costs for gift shops
indicate a relatively normal plot, but there is a slightly longer tail to the higher
value side of the plot. Lastly, the startup costs for pet stores have a skewed plot,
which is illustrated by a long tail to the higher values side.
4. Test, if there is a significant difference in the starting costs for these types of
business. (3 marks)
To test this claim, we hypothesis that;
H0: there is no significant difference in the starting costs for these types of
business. Vs., HA: at least one business has different starting cost.
The analysis is carried out at the level 0.05, using one-way ANOVA.
The summary of the results is;

Surname 6
One factor ANOVA
One factor ANOVA
Surname 7
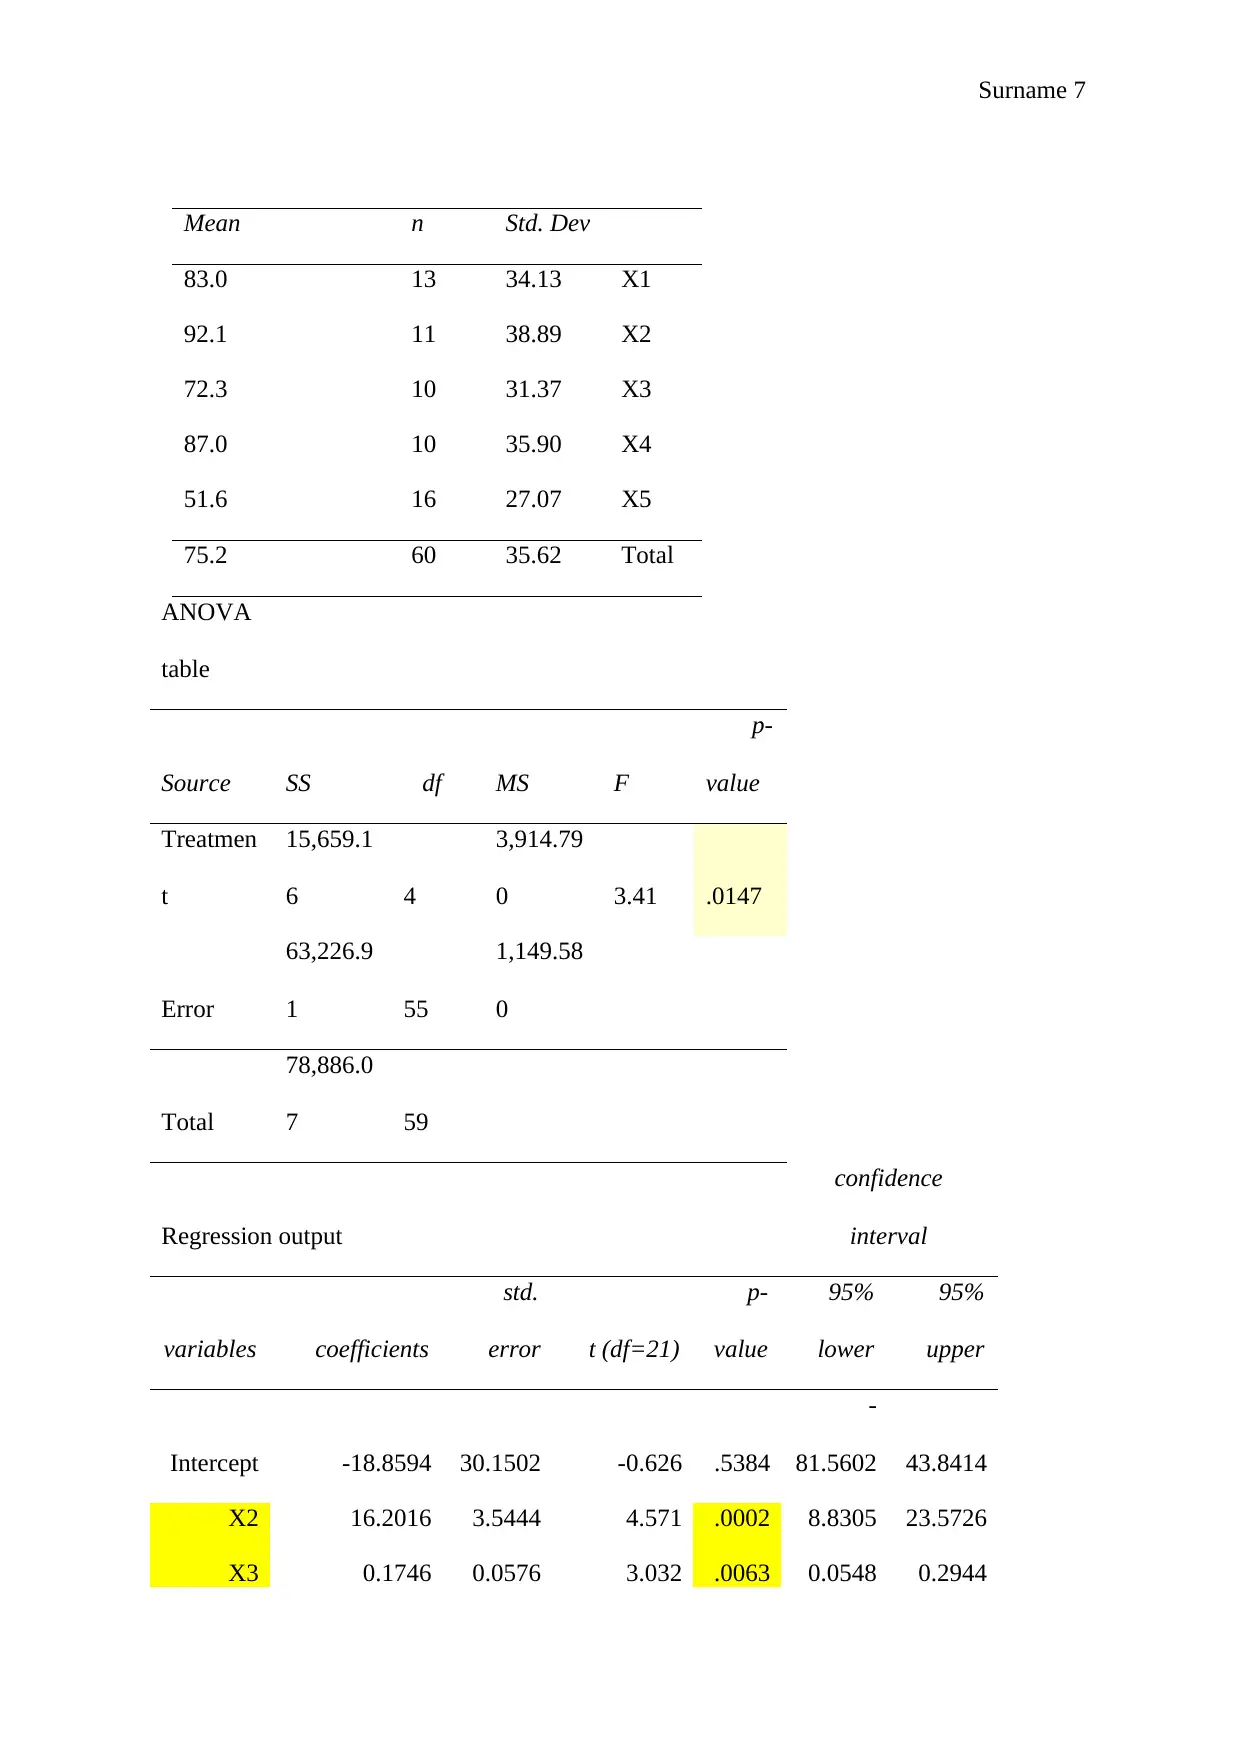
Mean n Std. Dev
83.0 13 34.13 X1
92.1 11 38.89 X2
72.3 10 31.37 X3
87.0 10 35.90 X4
51.6 16 27.07 X5
75.2 60 35.62 Total
ANOVA
table
Source SS df MS F
p-
value
Treatmen
t
15,659.1
6 4
3,914.79
0 3.41 .0147
Error
63,226.9
1 55
1,149.58
0
Total
78,886.0
7 59
Regression output
confidence
interval
variables coefficients
std.
error t (df=21)
p-
value
95%
lower
95%
upper
Intercept -18.8594 30.1502 -0.626 .5384
-
81.5602 43.8414
X2 16.2016 3.5444 4.571 .0002 8.8305 23.5726
X3 0.1746 0.0576 3.032 .0063 0.0548 0.2944
Paraphrase This Document
Need a fresh take? Get an instant paraphrase of this document with our AI Paraphraser
Surname 8
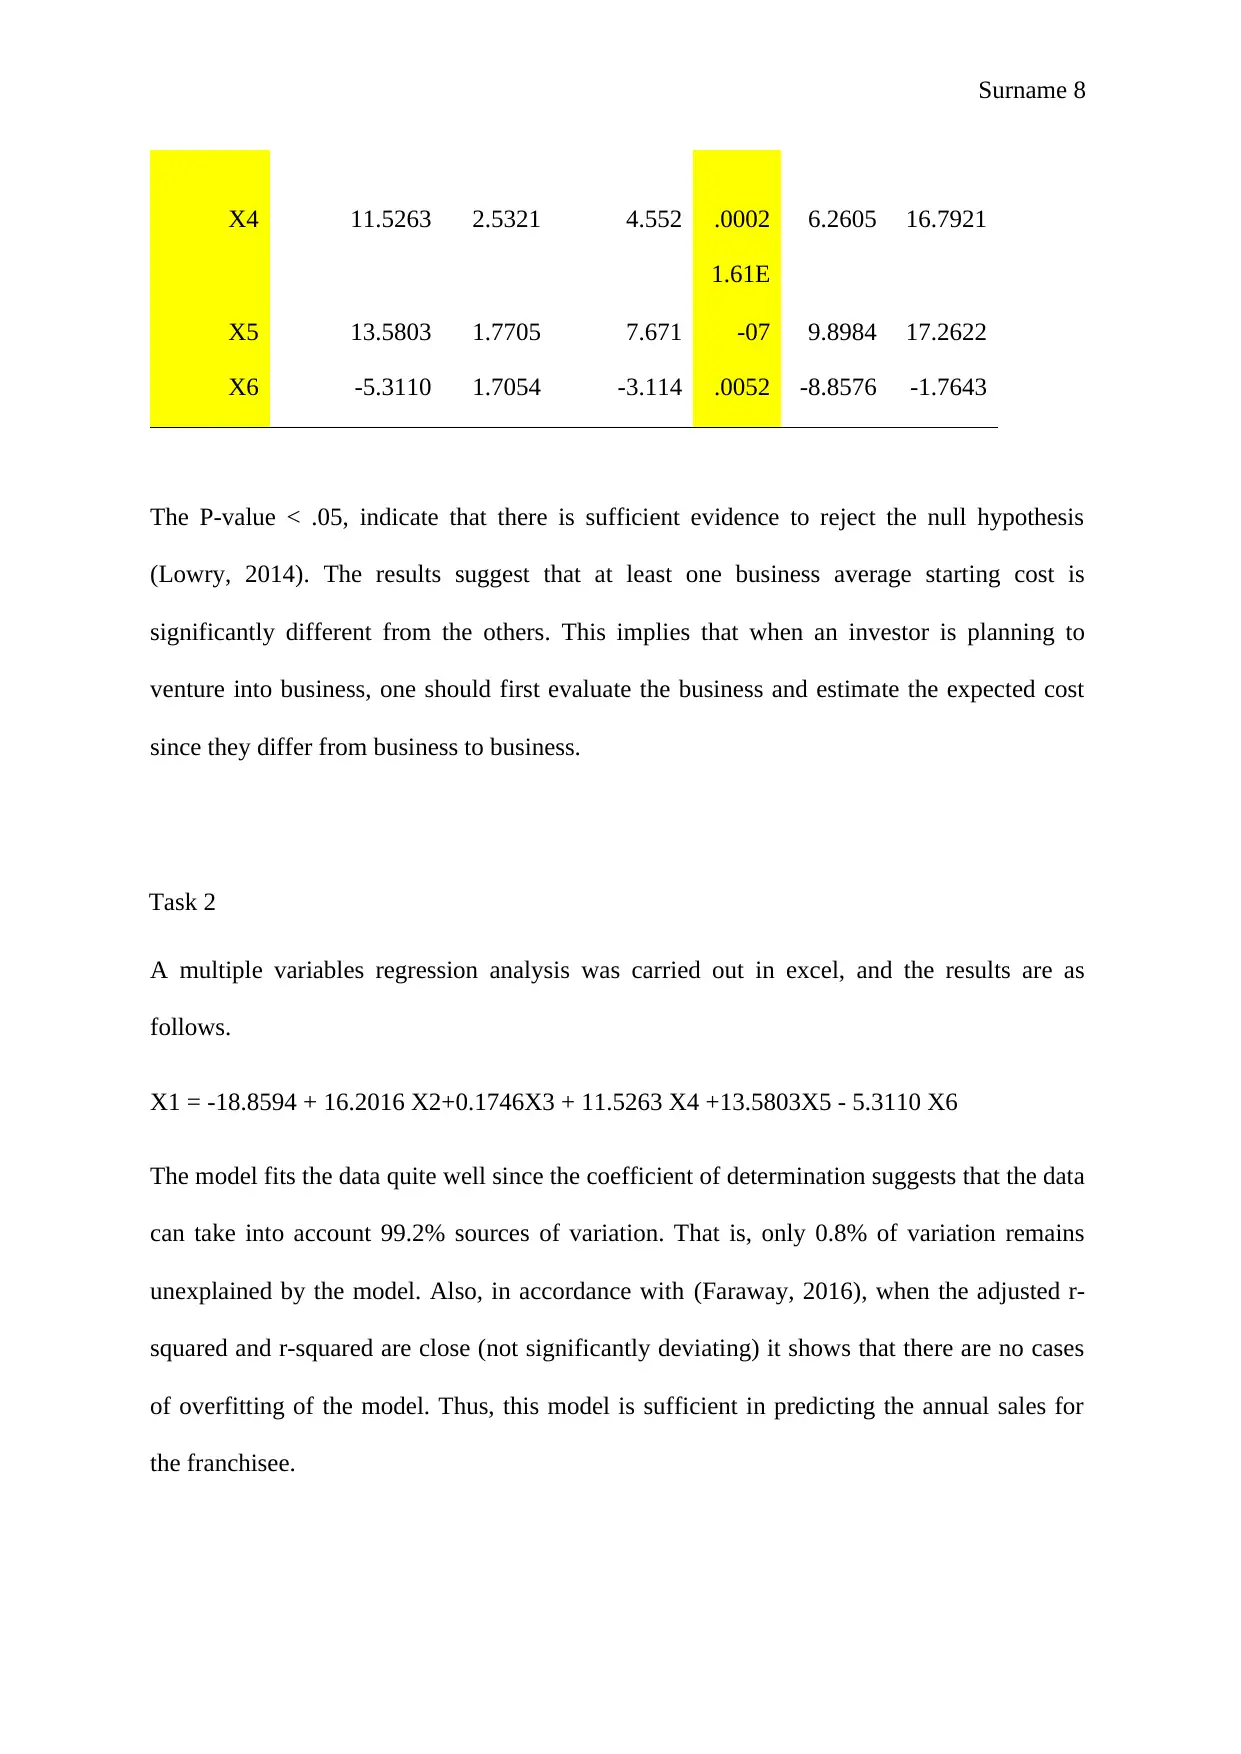
X4 11.5263 2.5321 4.552 .0002 6.2605 16.7921
X5 13.5803 1.7705 7.671
1.61E
-07 9.8984 17.2622
X6 -5.3110 1.7054 -3.114 .0052 -8.8576 -1.7643
The P-value < .05, indicate that there is sufficient evidence to reject the null hypothesis
(Lowry, 2014). The results suggest that at least one business average starting cost is
significantly different from the others. This implies that when an investor is planning to
venture into business, one should first evaluate the business and estimate the expected cost
since they differ from business to business.
Task 2
A multiple variables regression analysis was carried out in excel, and the results are as
follows.
X1 = -18.8594 + 16.2016 X2+0.1746X3 + 11.5263 X4 +13.5803X5 - 5.3110 X6
The model fits the data quite well since the coefficient of determination suggests that the data
can take into account 99.2% sources of variation. That is, only 0.8% of variation remains
unexplained by the model. Also, in accordance with (Faraway, 2016), when the adjusted r-
squared and r-squared are close (not significantly deviating) it shows that there are no cases
of overfitting of the model. Thus, this model is sufficient in predicting the annual sales for
the franchisee.
Surname 9
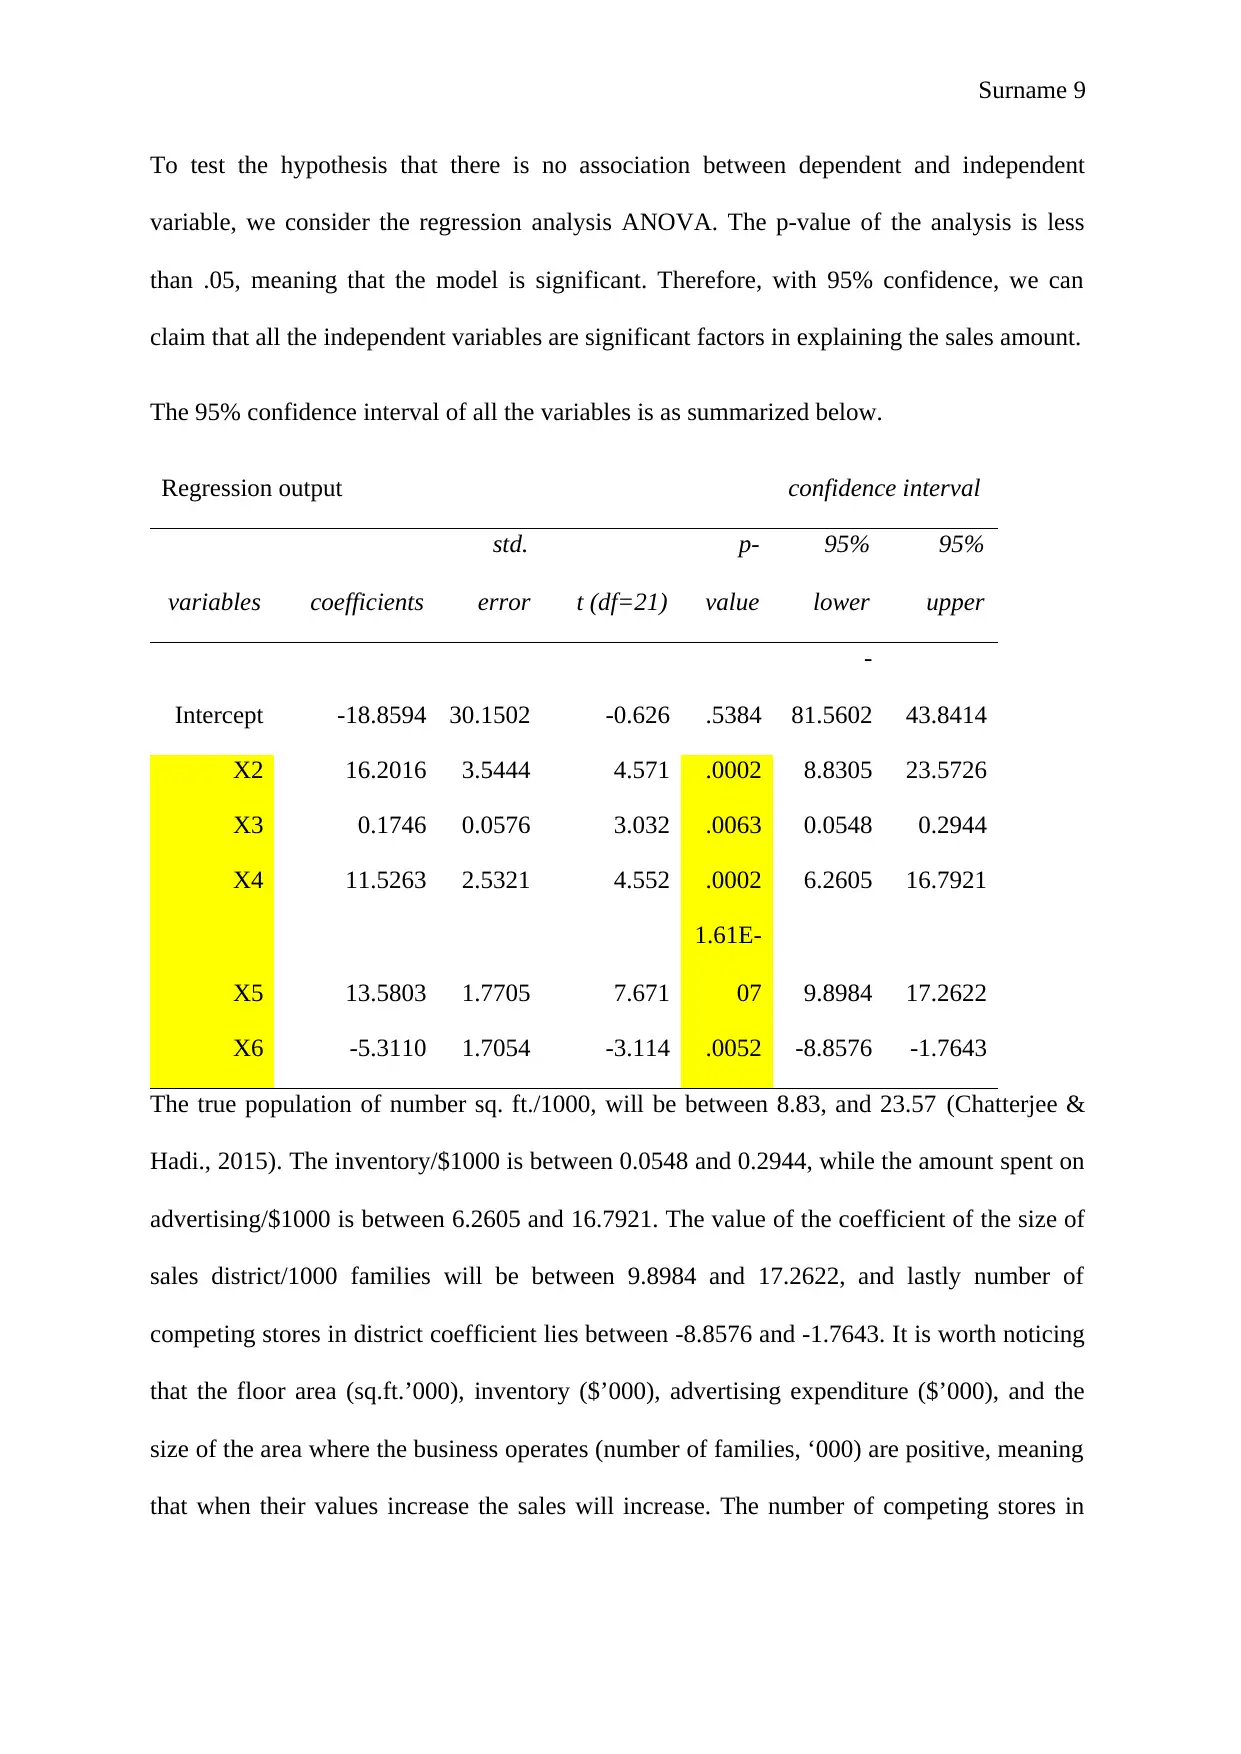
To test the hypothesis that there is no association between dependent and independent
variable, we consider the regression analysis ANOVA. The p-value of the analysis is less
than .05, meaning that the model is significant. Therefore, with 95% confidence, we can
claim that all the independent variables are significant factors in explaining the sales amount.
The 95% confidence interval of all the variables is as summarized below.
Regression output confidence interval
variables coefficients
std.
error t (df=21)
p-
value
95%
lower
95%
upper
Intercept -18.8594 30.1502 -0.626 .5384
-
81.5602 43.8414
X2 16.2016 3.5444 4.571 .0002 8.8305 23.5726
X3 0.1746 0.0576 3.032 .0063 0.0548 0.2944
X4 11.5263 2.5321 4.552 .0002 6.2605 16.7921
X5 13.5803 1.7705 7.671
1.61E-
07 9.8984 17.2622
X6 -5.3110 1.7054 -3.114 .0052 -8.8576 -1.7643
The true population of number sq. ft./1000, will be between 8.83, and 23.57 (Chatterjee &
Hadi., 2015). The inventory/$1000 is between 0.0548 and 0.2944, while the amount spent on
advertising/$1000 is between 6.2605 and 16.7921. The value of the coefficient of the size of
sales district/1000 families will be between 9.8984 and 17.2622, and lastly number of
competing stores in district coefficient lies between -8.8576 and -1.7643. It is worth noticing
that the floor area (sq.ft.’000), inventory ($’000), advertising expenditure ($’000), and the
size of the area where the business operates (number of families, ‘000) are positive, meaning
that when their values increase the sales will increase. The number of competing stores in
Surname 10
district has a negative coefficient which means that it has a negative impact on the sales on
the franchisee.
All the independent variables in the model are significant, since their 95% confidence
interval do not contain a zero (Lowry, 2014). This implies that at the 95% level of
confidence, we can claim that these variables are significant. This means that they are ideal
for the model as they could explain the source of variation of the dependent variable. Since
all the variables are significant another linear regression model was not re-estimated.
Using the model X1 (sales) = -18.8594 + 16.2016 X2+0.1746X3 + 11.5263 X4 +13.5803X5
- 5.3110 X6; where were the following variables. 1,000 sq ft floor area, $150,000 inventory,
$5,000 spent on advertising, 5,000 families in the area of operation and 2 competitors.
X2 = number sq. ft./1000 = 1000
X3 = inventory/$1000 = 150,000
X4 = amount spent on advertizing/$1000 = 5000
X5 = size of sales district/1000 families = 5000
X6 = number of competing stores in district = 2
= -18.8594 + 16.2016 (1000) + 0.1746(150,000) + 11.5263(5000) +13.5803(1000) -
5.3110(2)
= 167,900.2749997
The sale will be approximately 167,900.27
1 out of 10


Your All-in-One AI-Powered Toolkit for Academic Success.
+13062052269
info@desklib.com
Available 24*7 on WhatsApp / Email
![[object Object]](/_next/static/media/star-bottom.7253800d.svg)
Unlock your academic potential
© 2024 | Zucol Services PVT LTD | All rights reserved.