Calculating Descriptive Statistics - Exercise 27 - HLT362v
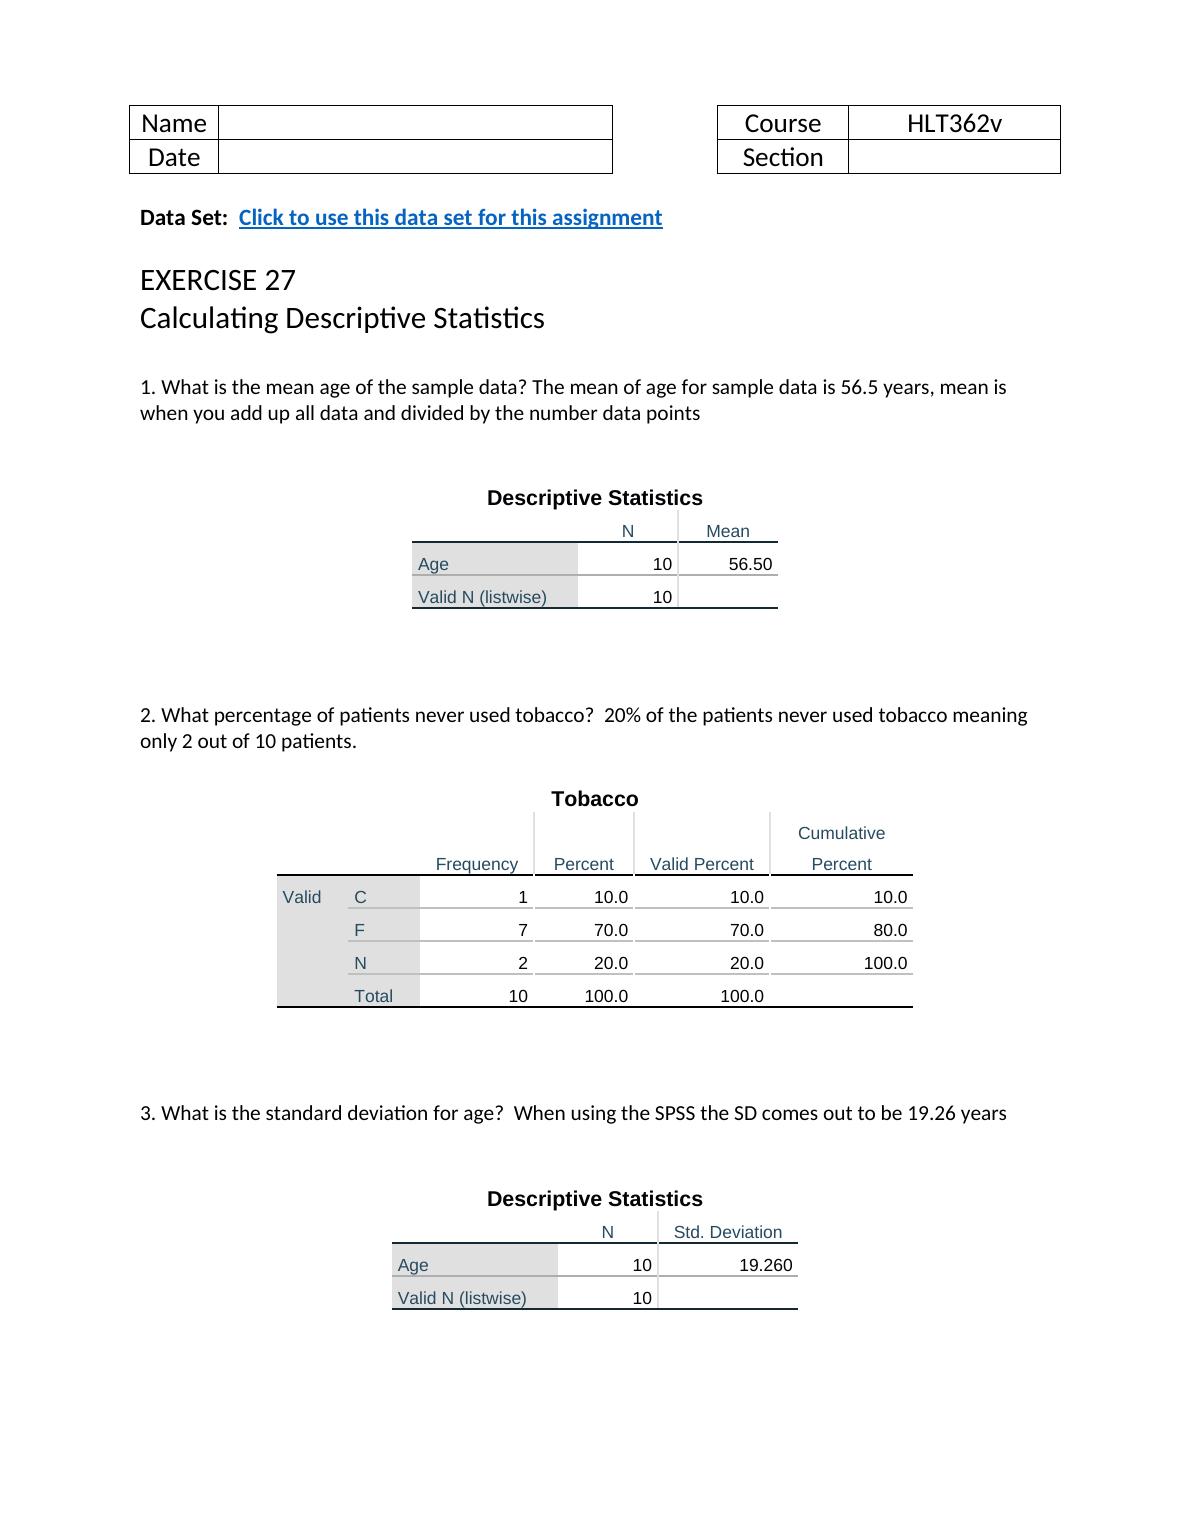
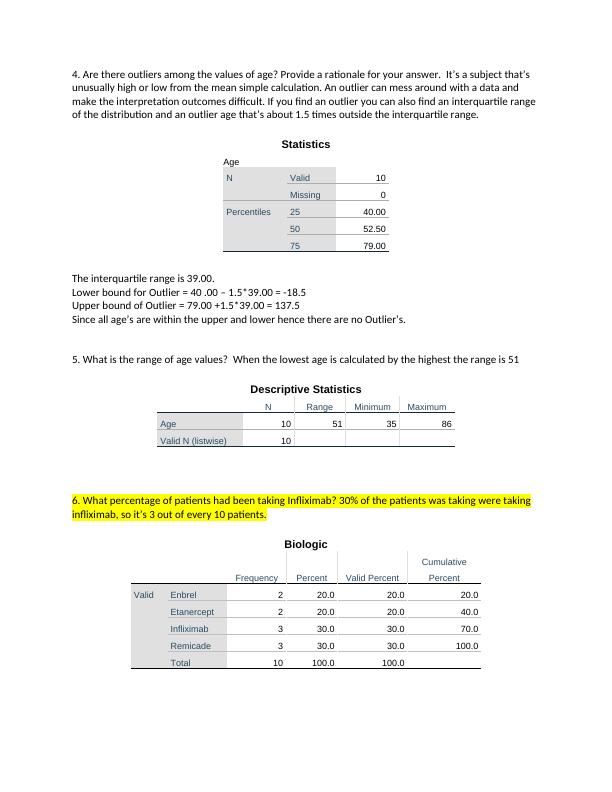
Calculating descriptive statistics for a given data set, including mean age, percentage of patients who never used tobacco, standard deviation for age, presence of outliers among age values, range of age values, and percentage of patients taking Infliximab.
4 Pages687 Words489 Views
Added on 2023-06-08
About This Document
This exercise involves calculating descriptive statistics for a sample data set in HLT362v course. It covers mean, standard deviation, range, outliers, and confidence interval.
Calculating Descriptive Statistics - Exercise 27 - HLT362v
Calculating descriptive statistics for a given data set, including mean age, percentage of patients who never used tobacco, standard deviation for age, presence of outliers among age values, range of age values, and percentage of patients taking Infliximab.
Added on 2023-06-08
ShareRelated Documents
End of preview
Want to access all the pages? Upload your documents or become a member.
Qualitative Research (Doc)
|18
|1871
|315
Quantitative Study
|18
|1851
|491
Data Analysis and Visualization
|16
|2350
|88
Data Analysis and Visualization
|16
|2397
|97
Data Analysis and Visualization
|16
|2415
|97
Analysis of Infection Rate of COVID-19 in White and BAME Patients
|16
|2302
|76